
Sell in May and Go Away and the Effect of the Fed
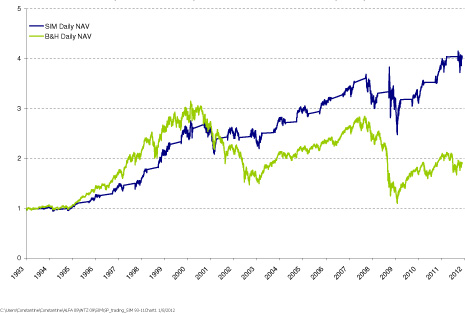
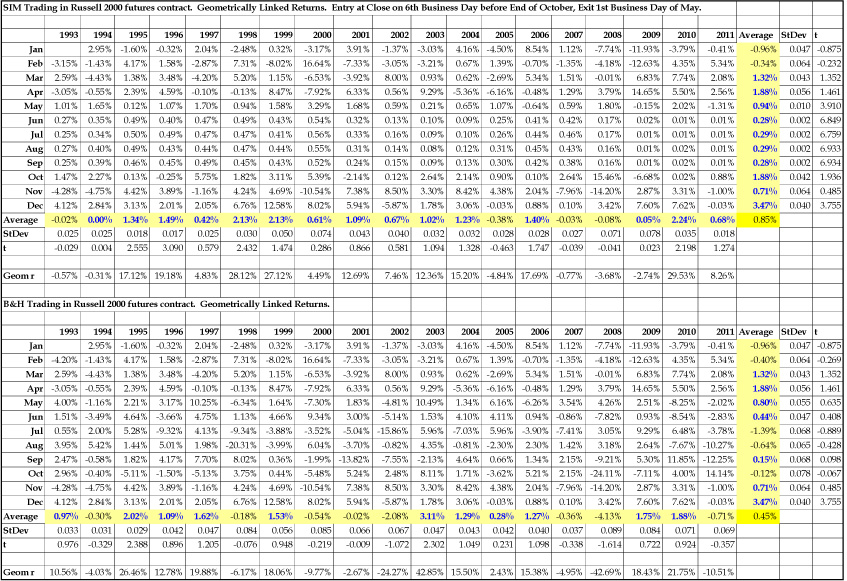
September and October have historically had low stock market returns with many serious declines or crashes occurring in October. Also the months of November to February have historically had higher than average returns; see, for example, Gultekin and Gultekin (1983) and various papers in Ziemba (2012a). This suggests the strategy to avoid the bad months and be in cash then and only be long the stock market in the good months. Sell in May and go away, which is sometimes called the Halloween Effect, is one such strategy that is often discussed in the financial press. Figures 17.1 and 17.2 show this strategy using the rule sell at the first trading day in May and buy on the 6th trading day before the end of October, for the S&P500 and Russell2000 futures indices for the years 1993-2011, respectively. This rule did indeed beat a buy and hold strategy. Tables 17.1 and 17.2 have the SIM versus buy and hold data from Figures 17.1 and 17.2

Fig. 17.1 S&P500 Futures Sell in May (SIM) and B&H Cumulative Returns Comparison. 1993–2011. (Entry at Close on 6th Day before End of October. Exit 1st Day of May.) Source: Dzhabarov and Ziemba, (2012)

Fig. 17.2 Russell2000 Futures Sell in May (SIM) and B&H Cumulative Returns Comparison. 1993-2011. (Entry at Close on 6th Day before End of October. Exit 1st Day of May.) Source: Dzhabarov and Ziemba (2012)
For the S&P500 a buy and hold strategy turns $1 on February 4, 1993, into $1.91 on December 31, 2011; whereas, sell in May and move into cash, counting interest (Fed funds effective monthly rate for sell in May) and dividends for the buy and hold, had a final wealth of $4.03, some 111.6% higher. For the Russell2000 , the final wealths were $1.83 and $5.35, respectively, some 192.3% higher. So the Sell in May and Go Away strategy has been working to produce much higher final wealth with lower risk and, as with most anomalies, the small cap results are the best.
Doeswijk (2005) offers a new hypotheses after reviewing two existing explanatory hypotheses. Bouman and Jacobsen (2002) confirm the empirical and historical basis of the maxim, finding that the ‘Sell in May‘ effect holds in 36 of the 37 countries included in their analysis. They consider vacation timing as a potential cause of the ‘Sell in May’ effect, suggesting the timing of summer vacations may cause temporal variation in appetites for risk aversion. However, they find evidence of the ‘Sell in May’ effect in their subset of Southern hemisphere countries, which under their hypothesis would be expected to have a different seasonal pattern.
Another hypothesized link between seasonality and stock returns is the Sea¬sonal Affective Disorder (SAD), which was studied in Kamstra, Kramer, and Levi (2003) and Garret, Kamstra, and Kramer (2004). SAD is a disorder in which the shorter, relatively sunless days of fall and winter cause depression, which some recent research links to an unwillingness to take risk. Kamstra (2003) concludes that the SAD explanation does not lead to a profitable trading strategy because the risk premium varies with the seasonal effects. Like the vacation timing hypothesis, Doeswijk finds the SAD hypothesis insufficient because SAD is known to start as early as September so the historically high November returns cannot be explained.
Doeswijk (2005) offers a new hypothesis to explain the ‘Sell in May’ effect. He posits that, in the fourth quarter of each year, investors are overly optimistic about the upcoming year. This excessive optimism leads to attractive initial returns followed by a renewed realism that readjusts expectations. Unlike the SAD hypothesis, which suggests a varying risk premium, the Optimism Cycle hypothesis reflects a constant risk premium but a varying perception of the economic outlook. In order to test this hypothesis, Doeswijk ran three analyses: 1) the global zero-investment seasonal sector-rotation strategy 2) the seasonality of earnings growth revisions and 3) the initial returns of IPOs as a proxy for investor optimism.
According to the Optimism Cycle, investors are over-optimistic at the end and beginning of the year. If this hypothesis is correct, a winning investment strategy is going long in cyclical stocks and short in defensive stocks during the winter period from November through April (‘winter’) and following the opposite strategy from May through October (‘summer’). (These stock groups are chosen for their relative exposure to the general economy, with cyclical stocks having a high exposure and defensive stocks a low exposure.) To test this strategy, Doeswijk uses the MSCI World index of global stock returns from 1970-2003 and tests the data as a whole, in two 17-year sub-periods, using several variations on timing of the winter period, and various sector definitions. The study runs regressions using monthly market capitalization-weighted price return indices and their monthly log returns.
Doeswijk finds that, on average during the study period, winter returns are a significant 7.6% higher than summer returns and the strategy works in 65% of the years. On a monthly basis, average performance of the global zero-investment strategy is 0.56%, which is significant at the 1% confidence level. Using further regression analysis techniques, Doeswijk also isolates the market timing effects from the seasonality and finds that seasonality alone accounts for approximately half of the excess returns.
Like the Optimism Cycle strategy, both other analyses in the Doeswijk study support the Optimism Cycle hypothesis. Doeswijk finds that expected earnings growth rates follow a seasonal cycle and that these changes have an effect on stock performance. The third analysis uses initial IPO returns, which show a remarkable seasonality, as a proxy for investor confidence. Using this investor confidence proxy as an independent variable, the regression result for remaining excess return is not statistically significant, which supports the Optimism Cycle hypothesis.
Along with the three supporting analyses, Doeswijk explains a qualitative argument in favor of his Optimism Cycle hypothesis. He argues that, since this phenomenon is one based on an aspect of human psychology, it tricks investors into repeating the same biases every year. Importantly, this cycle of optimism and pessimism is not generally accepted, which Doeswijk argues allows for investors who understand it to profit from it as a ‘free lunch’ until it is more widely accepted and the arbitrage opportunity is absorbed into the market.
The effect of the Fed meetings
The Fed has a huge influence on the stock market: adapted from Housel (2012) Former Federal chairman Alan Greenspan wrote in his 2007 memoir:
People would stop me on the street and thank me for their 401(k); I'd be cordial in response, though I admit I occasionally felt tempted to say, ‘Madam, I had nothing to do with your 401(k).’ It's a very uncomfortable feeling to be complimented for something you didn't do.
This is nave - his policies created a stock market bubble which burst and then created a bubble in real estate which also crashed
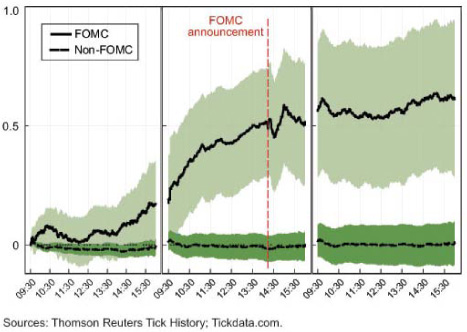
A study by David Lucca and Emanuel Moench (2011) of the Fed shows the in-fluence of the Fed Open Market meetings since they were publicized and announced in 1994 through mid 2011. Since then the S&P500 has risen from 450 to 1300. More than 80% of the equity premium on US stocks was earned over the 24 hours preceding scheduled FMOC meetings. And virtually all in the 3 day window around these meetings, see Figure 17.3

Fig. 17.3 Average cumulative returns on S&P5000 on days before, on and after ROMC announcements
The returns in Figure 17.4 are uncertain with a positive bias but considerable variation. So the Fed effect does seem to work but have risk in it in a particular meeting. Given the confidence intervals, one sees the returns are not straight up. Also some tests Constantine Dzbarov ran for us indicate that the effect is less pronounced in recent data ending September 30, 2012.
Matt Koppenheffer of Motley Fool used market data going back to 1994. He randomly removed 136 days (eight per year for 17 years, or one for every FOMC meeting) He ran the simulation several hundred times, removing different sets of random days. The difference was trivial. Nothing came within a third of the skew caused by removing the days shortly before FOMC meetings. Over the long haul, stocks are driven by fundamentals, in the short term they are impacted by headlines including waiting for the FMOC announcements which add to volatility.

Note: The sample period is 1994 to 2011
Fig. 17.4 The S&P500 index with and without the 24 hour pre-FOMC returns
Table 17.1: Data by month for Sell in May and Go Away versus Buy and Hold for the S&P500,1993-2011/ Source: Dzhabarov and Ziemba (2012)

Table 17.2: Data by month for Sell in May and Go Away versus Buy and Hold for the Rus- sell2000 Futures, 1993-2011. Source: Dzhabarov and Ziemba (2012)
