

Thoughts on the VIX Fear Index1
High put prices have led to high levels of fear and plenty to play with for volatility traders
The VIX is the standard deviation of the implied volatility of S&P500 index options that are close to the money and not far into the future. Put options dominate in the various VIX calculations for the US equity and other markets. High put prices lead to high fear reflected through high VIX values. The VIX is a weighted average of various implied volatilities of various options whose volatilities Eire backed out based on their prices by some option pricing model. The VIX can vary from a low in the 10% range to the high 20s into the low 30s for violent stressful markets and as high as 70% to 100%+ in market crashes. In 1990, the VIX of the Nikkei Stock average of 225 stocks (price weighted like thf Dow Jones) was in the 70% plus area for months and months. Figure 19.1 has the spot VIX graphs for 2002-2012 and Table 19.1 has the VIX futures as of September 30, 2012.
When as I wrote this on July 13, 2008, the S&P500 was fn a “so-called” bear market (down over 20% from itf peak) at 1239.49 and the VIX at 27.49 ts at the higher end of its five- year range. Figure 1a.2 shows the 5-year VIX with a 52-week range ol 14.79 - 37.57%. Figure 19.3(a) shows the 5-year S&P500 which shows peaks at 1527.46 on March 24, 2000 and 1520.00 on September 1, 2000 and in the last ten years, a low close of 778.63 on October 10, 2002. Figure 19.3(b) shows the S&P500 over a longer period from 1955 to 2008. In the 2000-2003 market decline, many stocks did not fall and the decline was concentrated in a few large capitalized stocks, especially telecoms. This time it was financials leading the S&P500 down, whereas in 2001/2 it was large cap momentum driven stocks, technology and telecommunications, see Ziemba (2003).
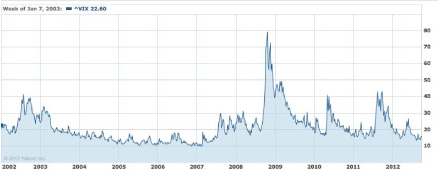
Fig. 19.1 VIX, January 1, 2002 to September 30, 2012. Source: Yahoo Finance
Table 19.1: VIX Futures, October 2012 to June 2013 as of September 30, 2012
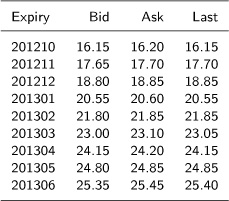
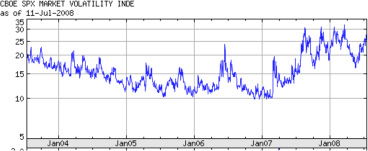
Fig. 19.2 5-year VIX, to July 11, 2008. Source: Yahoo Finance
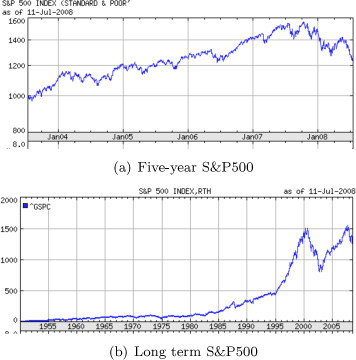
Fig. 19.3 S&P500 Source: Yahoo Finance
Is the VIX a good predictor of future stock price movements? Figure 19.4 shows as of January 10, 2007, the global 1200 index in US dollars versus the CBOE S&P500 VIX index. Basically, as the VIX falls, stocks rally and as the VIX rises, stocks fall.
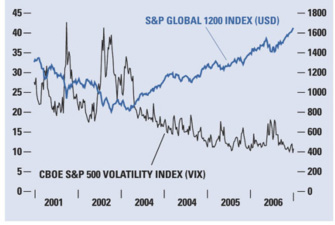
Fig. 19.4 Strong fundamentals keep volatility at bay. Source: Young, January 10, 2007
Young (2007) wrote:
Currently, the VIX is trading at multi-year lows, suggesting that fear is in deep hibernation. But when combined with the strength in global markets over the past three years - the S&P Global 1200 is up roughly 100% since March 2003 - many market participants are concerned that the complacency implied by the VIX is spreading, leaving global stock markets vulnerable to attack by the dreaded bear.
Not likely, in the opinion of S&P Equity Strategy. We believe the reason for the complacency is less the sloth of bulls than the fact that equity fundamentals are, in a word, excellent. Liquidity is ample and inflation is low, both of which serve to depress interest rates and fuel unprecedented global M&A activity. At the same time, attractive 2007 growth prospects and low P/E-to-growth ratios are lending important valuation support to global stock markets.
In this climate, investors concerned about a spike in volatility should watch for any deterioration of these fundamentals. We do not believe, however, that such an erosion is nigh. Modest portfolio rebalancing is certainly appropriate in light of recent gains. But given the difficulty of successfully timing the market - requiring both a graceful exit at the top as well as a cool reentry at the bottom - S&P Equity Strategy does not currently advise significantly reducing equity exposure. Global equity valuations are historically low, especially given healthy 2007 earnings expectations. Despite a consensus 2007 earnings growth projection of 9%, above the historical average, the S&P Global 1200 index is currently trading at a P/E of only 14.6, a 12% discount to its long-term average of 16.5.
Of course, this advice was not good for long-only investors (as are most individuals and institutions). During this time, the VIX reached low values around 10%. However, short sellers and other option players did just fine.
Rosen (2008) observes that although the current about 25% VIX may be rich by historical standards, it is low when compared to recent volatility. The S&P500 has not been nearly as volatile this summer as it was during the 1st quarter of 2008 when the VIX traded at 35%. The 30-day current realized volatility is about 18%, which is slightly higher than the 15% long-term average, but still well below a 25% VIX. To justify a VIX at 35%, actual volatility would need to rise substantially.
Following the Bear Stearns collapse in June 2007 the 30-day realized volatility reached almost 30%. The stock market may have felt more volatile in June and July 2008, but this is not supported by the data.
The VIX only reached 26% (despite the S&P500 at another 52-week low) because investors are not as exposed to equities as they were in January and March.
Those overleveraged or overexposed to stocks have long positions. This is confirmed by the latest readings from both Investors Intelligence and the ISI Hedge Fund survey, which show bearishness, and hence defensiveness, approaching historical extremes.
Since investors are less invested than they were, they do not require as much insurance as they did during previous market declines, which partially explains why the VIX has not reached the higher levels of January and March. Another reason suggested by Fishback (2008b) is that the individual stock's correlations have dropped. While Lehman keeps dropping, Apple is rising. Both have high individual volatilities but do not add much volatility to the index.
Will the VIX pull back from here, and the stock market will rally? Not necessarily, but the premise that stocks are headed lower on a short-term basis because implied volatility is only trading at a 67% premium to realized volatility seems also seems unlikely.
Rosen suggests that it is even more important to know what not to do in this business, so anyone who is planning to rush out and buy puts and calls, or sell equities because the VIX appears too low, should perhaps re-think the situation.
Rosen also notes the well-known phenomenon that realized volatility of the S&P500 (about 15% in the last 100 years) whereas implied volatility has averaged about 20% since index options started trading with some volume in 1985. S&P500 futures started in 2002. Supply/demand imbalance plus fear leads to this overestimate of the future.
Pendergraft (2008) argues that the usual expectation that when the S&P is down that implies a rise in the VIX and vice versa is not working in 2008. Of course, with small changes, the usual behavior might not work but it will with large changes (±2%+). He suggests that the future prices on the VIX, affect the current VIX changes. This is a derivative on a derivative on a derivative so the effect is complex and deserves a full study which our team of researchers is working on.
Fishback (2008a) looks at the OEX (S&P100) volatility index, called the VXO versus 19.9% and 10% declines. In all cases, before 2008, the VXO was 35% plus once the 19.99% decline was reached. See Table 19.2 and Figure 19.5. So why is the VXO lower now in 2008, at about 25.63%?
Table 19.2: Declines of 19.9%. Source: Fishback (2008a)

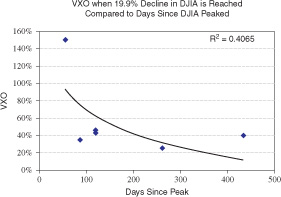
Fig. 19.5 VXO when 19.9% decline in DJIA is reached compared to days since DJIA peaked. Source: Fis7hback (2008a)
What Fishback learned is the rather obvious fact that it has been the time that it took to reach -20% that is crucial. When the decline was fast, that is less than one month, the VXO always rose above 30%. But when the decline took longer, then the VXO was under 30%. See Table 19.3 and Figure 19.6 for the 10% declines.
Table 19.3: 10% OEX declines and the VXO when the declines are reached. Source: Fishback (2008a)
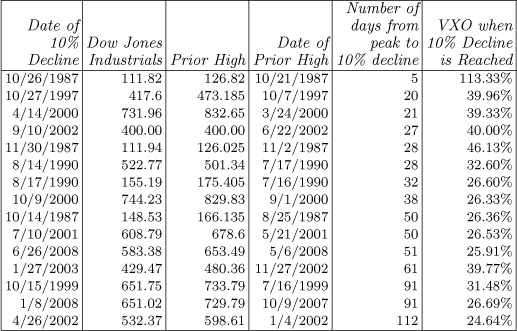
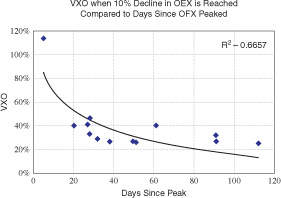
Fig. 19.6 VXO when 10% decline in OEX is reached compared to days since OEX peaked. Source: Fishback (2008a)
So the rather orderly decline from 1420 to the current 1228 has not led to a very high VXO and the VIX.
Still others point to lower stock prices with some predicting that the S&P500 will eventually fall below 1000. And, indeed, it did, bottoming out on March 9, 2009 at 683.38. That was the lowest close but on March 6 intraday the market hit 666.79. There are plenty of bearish writers. Prominent among them are Nouriel Roubini, the head of RGEMonitor.com and John Maudlin of Millennium Wave Advisors, LLC.
Roubini, an NYU professor (and, for full disclosure, Rachel's boss) has been consistently right in his forecasts and analysis since he was the first loud voice (in 2006) arguing that the subprime housing crisis was imminent and would be very widespread with large losses.
Mauldin tends to present the views of others but with a bearish focus. He believes that the subprime situation is 90% contained but that there is much trouble to come from banks and other financial assets. The banks and investment companies may need another $400 billion. Where will they get it? Some possibly could come from the sovereign wealth funds but their investments so far have led to large losses so they may be very cautious. Maudlin calculates the PE ratio of the S&P500 at 23 times forward earnings which is a lot above Barron's current PE of 20.52 based on trailing earnings versus 18.67 a year ago with a higher S&P500 and higher trailing earnings. Also there is the question of when the real estate market may stabilize as prices may fall well into 2009 or 2010. See Figure 20.1 for S&P/Case-Shiller indices which indicates the extent of the decline and the beginning recovery.
Bridgewater's estimate is that the net worth of US assets is down 13% or $8 trillion since January 2007.
Over the years since 1989, see Ziemba and Schwartz (1991), Ziemba (2003), Koivu et al. (2005), Ziemba and Ziemba (2007) and Lleo and Ziemba (2012). I have made good use of the bond-stock earnings yield (BSEYD) measure as a useful predictor of dangerous markets. Berge et al. (2008) show that the simple rule: go into cash if the measure is in the danger zone, otherwise stay in the S&P500 doubles the final wealth from 1980-2005 and 1975-2000 in all five county studies compared with staying in the S&P500. Also, by being in cash, the standard deviation risk is lower so the Sharpe ratios are even higher. Durre and Giot (2005) investigate more countries than the US, UK, Canada, Germany and Japan that we studied. See Chapters 2 and 21 for a discussion of this.
The measure kept me out of the 2001 crash and also predicted numerous other crashes. In 2006-2008 it has predicted the crashes in Iceland and China, as discussed in Chapter 21. See Ziemba and Ziemba (2007) for earlier analyses of these two countries. Before, it was the Japan 12 out of 12 correct predictions during 1948- 1988 and the big one January 1989 plus the US in 1987 and 2002. The measure also predicted the 2003+ rally from the 778.63 S&P500 low to over 1500.
In the years 2009-2012, the model was not generally in the danger zone but there was a sell signal on June 14, 2007 that presaged the 2007-2009 crash, see Chapter 21. The market has fallen for other reasons, namely, the subprime and credit crises we are now in. Maudlin (2008) thinks the subprime crisis is 90% over. But there are some $1.6 trillion is losses coming from write downs, according to Bridgewater Associates. Roubini (2008) suggests it will be more, especially if $5 trillion is needed for Freddie Mac and Fanny Mae. Last night (July 13, 2008) the S&P500 futures were up to a high of +15 as a deal between these agencies and the Treasury and Fed has been announced by Treasury Secretary Henry Paulson. The deal involves asking Congress to approve unlimited loans, buying of preferred stock, and use of their collateral. The market was not that impressed and +15 ended up -11 on the S&P500, during the day on July 14, 2008.
Indeed in Japan in 1990+ the stock and land price falls led to even more losses and a 20 year dark period. Japan, of course, was way way overpriced in land and the PEs of 60 were completely crushed when interest rates were raised in mid 1988 to August 1990. A major error was increasing interest rates a full eight months in 1990, once the stock market began to fall in January 1990. When the bond- stock measure goes into the danger zone, there usually is a 10%+ crash from the current level but with a lag. In April 1987, the signal said sell but the crash was in October. In April 1999, there was a similar signal but the stock market only fell a year later. See Ziemba (2003) and Ziemba and Ziemba (2007) for more on these episodes.
If we use Maudlin's 23 PE ratio, the BSEYD measure was ∆= 10 year Treasury bond interest rate - 1/PE = 3.96- (100/23) which is less than zero.
So, even with this high PE ratio, the BSEYD model was not in the danger zone. But the June 14, 2007 signal said sell; see Chapter 21.
Despite rumblings of US and worldwide inflation, the financial situation is so dire that higher US interest rates by the Fed's action seems unlikely, at least for the next while. So how would the ∆ get high enough to be in the danger zone (about 3)? It has to be lower and lower earnings, similar to late 2001, see Koivu et al. (2005) for that correct forecast of 2002's -22% on the S&P500.
Giorgio Consigli, Leonard MacLean, Yonggan Zhao, and I worked on a series of papers looking at determining the fair value of the S&P500 (Consigli, 2002, Consigli et al., 2008, and MacLean et al., 2008). The models involve jumps.
As a predictive model, adding the VIX as a second predictor adds value and predicts better than the bond-stock market alone during the 2000-2007 sample period. The heavy tails are modeled with the addition of a homogeneous point process. The timing of the jumps in the point process attempt to predict the price reversals. In Consigli et al. (2008), a non-homogeneous point process is introduced so the intensity and size of the jumps are state dependent. The state is the stress measure being a combination of the bond-stock and VIX measures. The direction of the shock from the VIX is revealed by the bond stock yield ratio. The model computes the stress thresholds and the weights of the risk factors.
Figures 19.7 shows the bond-stock model in its ratio form (mathematically equivalent to the difference model) and Figure 19.8 shows the VIX from 1990-2007. The predicted prices are in Figure 19.9.
The conclusions are:
(1)The addition of non-homogeneous point processes to a diffusion greatly improves the fitting to actual equity returns.
(2)Both the intensity of jumps and the size of jumps depend on the risk factors - the bond-stock measure and VIX.
(3)The VIX and bond-stock are complimentary since during some periods the dependence on VIX is more pronounced, while in other periods the dependence on the bond-stock is stronger.
(4)Because of the complimentarity, a convex combination of the factors averages out or smoothes the extremes and results in a low frequency of shocks and a poorer fit.
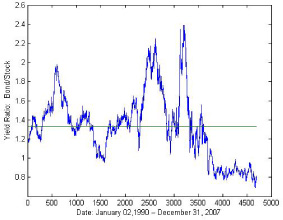
Fig.19.7 BSYR: 1990–2007
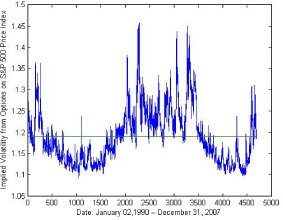
Fig. 19.8 VIX: 1990–2007
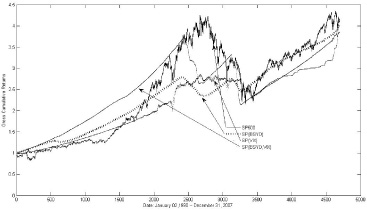
Fig. 19.9 Predicted Prices of the S&P500, 1990–2007
When the current crisis will end and how low the S&P500 will go is difficult to determine. The debts, good and bad and net positons of so many financial institutions is uncertain. We have not had the so-called bottom “capitulation” event. So far, the fall has been tense but orderly with declines in the 1, 2, and 3% range, but could and did get worse. More is still to be known about Fannie Mae and Freddie Mac, which, if Roubini is right (as he has been so far), their situation will be worse than now. They have $5 trillion in loans that they guarantee - an enormous amount. That's about 45% of the total mortgage market of $12 trillion. Others, such as former Fed Governor William Poole, think they are in bankruptcy already. They may get out of trouble and survive but only time will tell here.
1 Edited from Wilmott, September 2008.