

Understanding the Financial Markets in the Subprime Era: The 2007/9 Crisis1
How we got into this mess and where we might go
This chapter is an attempt to understand the equity, commodity, currency, real estate, fixed income and other markets in 2007.

There was a mixture of a sound economic response but the markets are moving in negative directions in real estate and the credit and equity markets plus a large fear of the unknown from reported and unreported subprime and other losses.
George Soros thinks it is the worst financial crisis in 60 years. Whether he is right or wrong, it is clear that the subprime, real estate and credit losses by banks and other financial institu-tions are large. How large ts to be determined. Numbers such as $500 billion to $1 trillion or even $2 trillion have been mentioned. Recall that -when the Japanese stock and land bubble burst in January 19)9)0 for stocks and more than a year later for land, $5 trillion was lost in real estate and. a further $5 trillion in equity for a total of $e0 trillion. Both were greatly ovsrpriced. Then Japan had a 20+ year dark period which they have called the Zort generaiion. So these numbers, though l arge, must be kept in perspective. Presumably, the US authorities 'will let businesses fail, a key mistake in Japan,
Many influential analysts are somewhat bearish onthe rtock market and supet bearish on the Ut real estate and worldwide credit markets. These include Jeremy Siegel and Abby Cohen who are bearish short term but bullish as they usually are long term. Nouriel Roubini and Bob Shiller are usually bearish and that continues. Other distinguished analysts such as Larry Summers and Felix Zulauf are bearish and feel that the US is already in recession.
Societe Generale
A major event in January 2008 was the rogue trader losses at Societe Generale. One thing to observe is that in times of uncertainty, there are more rogue traders. Besides, this loss some $1.4 billion was lost on wheat in two days by a rouge trader at MF Global causing them to lose one fourth of their worth.
On January 21 (a US holiday) and 22, 2008 (Monday and Tuesday) nights, the S&P500 futures was some 60 points lower on Globex trading(1265 area) well below previous lows (1406 on August 16, 2007, 1364 on October 17, 2006, 1273 on March 10, 2008, a new low as we go to press). On both days, the day market recovered, but much damage was done.
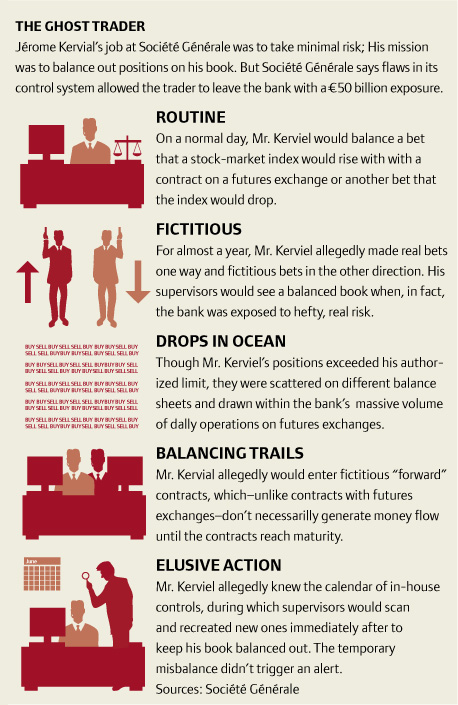
Jerome Kerviel and SG lost 4.9 billion euro trading index futures in the DAX, FTSE and CAC. By correlation, the S&P500500 fell to new lows. Many were hurt. How did a junior trader hold $50 billion euro in positions?
The sidebar exhibit is Societe Generale's explanation of the incident.
A failure of control:
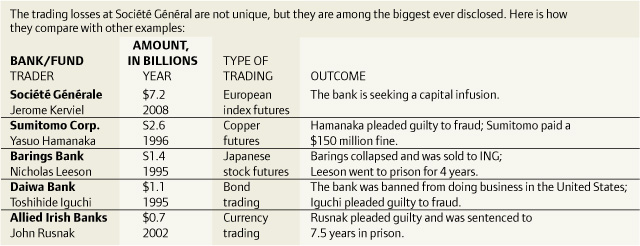
What is a subprime loan and why have they caused so much trouble in so many places?
Subprime loans: loans to borrowers who do not qualify for best interest or with terms that make the borrower eventually unqualified as with zero down payment, zero interest.
In general: lending institutions inherently get it wrong. When times are good, they tend to be greedy and try to maximize loan profits but then they are very lax in their evaluation of borrowers' ability to pay current and future mortgage payments.
•Japan in the late 1980s: real estate and stocks, eventually the 10 trillion was lost.
•US mortgages: in the run up of real estate - after the internet bubble and Greenspan, interest rates approached 1%. The assumption was that house prices had to rise as they have year by year, see Figure 20.1.
The lending organizations sell off the mortgages and they are cut and diced and bundled into packages like CMOs and CDOs and sold to others who have trouble figuring out what is in them but look at the rating agency's stamp of approval
Figure 24.3, starting in 1890, shows the buildup to overpriced areas in 2004-5 that led to the drop now that is shown in Figure 20.1. There had been 12 consecutive months of negative returns. The 10-city, 20-city decline and 10-city composite all declined. Case-Shiller and others predict up to a 25% drop in prices from the peak in 2005-6.
CMO, CDO trouble continued
As I argue in other chapters, one must be diversified and not overbet in all scenarios. But the CMOs, CDOs and other instruments were extremely leveraged by banks and others.
•The rating agencies with conflicts of interest are also at fault because they failed to point out the potential risks. Many risky derivative products were rated AAA even though they would implode as they did if only one variable - housing prices - declined.
•So it was easy and cheap money
Recall, the recipe for disaster is
•Over bet
•Do not diversity in all scenarios
Then if you are lucky you can be ok but if a bad scenario hits, you can be wiped out. Since US mortgages are in the range US$17 trillion, it is an enormous amount of money so a small change makes big impact. The bad scenario was not a small but a large change so the total losses could easily exceed 1 trillion as Figure 24.3 shows. Figure 21.15 shows data Professor Shiller compiled from 1980 to the peak in 2004-5. Observe this is 1/10 of Japanese losses in the 1990s. In 2008 it is widely recognized as a crisis. Early warnings of a large real estate decline came from Nouriel Roubini and Robert Shiller in 2006.
Once trouble hits, no one wants to lend, even to good risks. The pendulum has swung to too tight and too high rates. Figure 27.1 shows the interest rates on US treasuries over time from January 2001 to January 2008.
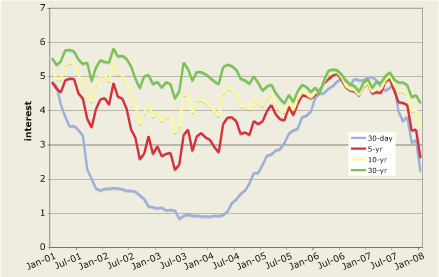
Fig. 27.1 Interest on US Treasuries
The Fed and other injections were helpful in the first few months of 2008. Japan inthe early 1990s it was similar: expensive money and you could not get it. Canadian bankr get it right more often than US! institutions but then the structure is different. Among other things, mortgage interest is not deductible excemi LQEMgR portion of a house that's an office. Also there are fewer exotic mortgages and higher down payments are required to obtain a mortgage. US foreclosures in 2008 were for mortgages written in 2006 and this continued. The following exhibit is a chronology of the subprime saga from June 2007 to January 2008.
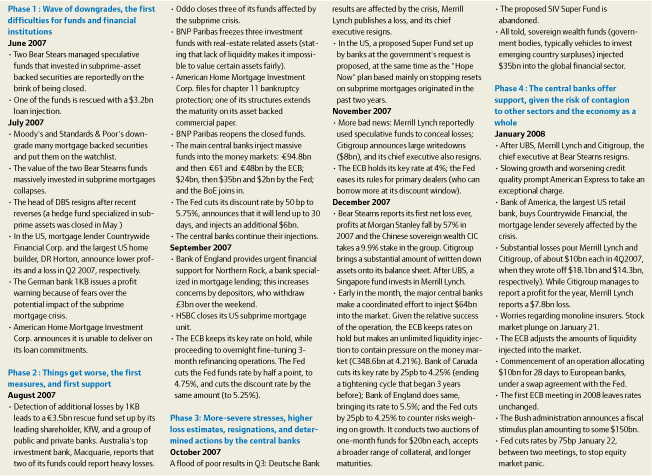
Source: Crédit Agricole S.A. - Department of Economic Research (2008)
Who will, bail out the ailing banks and financAal insti,tutions?
Sovereign wealth funds from oil and commodity exporting countries and goods exporting countries like China, see R Ziemba (March 2008) Wilmott. Buffett, Li Kai Shing and other cash rich investors will create new businesses and pick up bargains. They are bottom fishers in markets when they recognize a bottom.
What do the rational valuation and crash models say now and how accurate have they been since the 1980s?
My experience is that most but not all crashes (fall of 10% +) occur when interest rates relative to price earnings ratios are too high. That is the bond-stock model is in the danger zone. In that case there almost always is a crash. Crashes predicted by this model include the 1987 US, the 1990 Japan, and the US in 2000 and the US in late 2001, which predicted the 22% fall in the S&P500500 in 2002. This is discussed more fully in Chapters 2 and 21. Interestingly the measure moved out of the danger zone then in mid 2001 it become even more in the danger zone than in 1999. There were declines of less than 10% in 2004, 2005, 2006, 2007 and 2008. Then the big decline in January through March 2008 to lower and lower prices. This one was predicted by the bond-stock model on June 14, 2007; see Chapter 21) and exacerbated by sub-prime and credit problems. A confidential behavioral finance opfflBmHSngEMHAdel I use which has been very accurate did not predict these declines. See Chapter 22 for a description of these declines under 10% not predicted by these measures.
See Figure 27.2. The crushing blow in Japan: interest rates increased 8 full months until August 1990. It took years and years to recover from this despite dropping interest rates after August 1990 for many years. Notice how dropping interest rates too late may not work. Hopefully, Bernanke and the Chinese will not make this mistake in 2007-9 and use other fiscal measures.
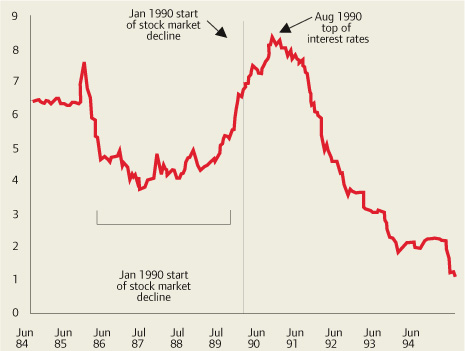
Fig. 27.2 Short term interest rates in Japan, June 1984 to June 1995
US$ decline
The US trade arid budget deficits and the US dollar decline. Why have the euro, oil and precious metals been the prime benefactors of the decline? Who can take up the slack now that the euro is possibly peaking or will the dollar rebound? It looks to be the yen and Swiss franc and continued rises in the precious metals and oil. Declining US interest rates add to the downward pressure, see Figure 27.1. By September 30, 2012 oil was 92.19 (WTI spot), 113.3 (Brent spot) and gold was 1772.25 down from over 1900. So does the 2013 slowdown which is definitely happening and whether or not it is a recession is to be determined. Some think that the likely outcome is a mild recession or something that just misses it - probably ±1.5% change in GDP duirng Q1 and Q2 of 2008. But many think it will be much worse than this. See Figure 27.3 for the currencies and precious metals.
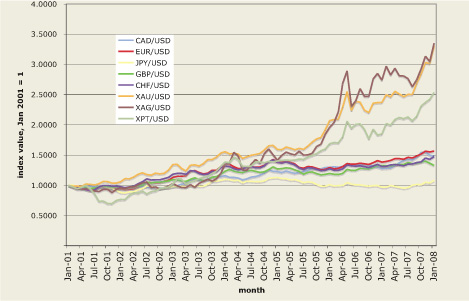
Fig. 27.3 Indices of currencies and precious metals to US$
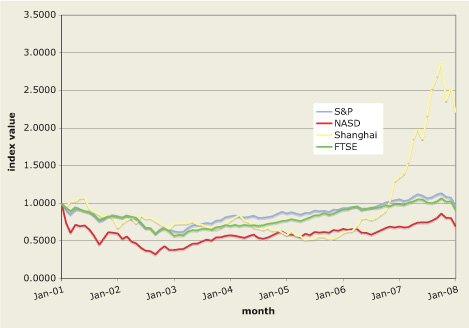
Fig. 27.4 Comparing stock indices, January 2001 = 1
The effects of an increasing trade deficit from European imports from China and other countries. The yuan while increasing against the US dollar has been dalling versus the Euro. As we go to press, the Chinese are discussing a one off revaluation of the yuan to speed up the gradual 5-7% drift upwards of the past two years. Since November 2007, this drift up has accelerated.. Among other things it would stop the decline of the yuan against the euro. But it would also make US import prices higher. Chinese growth is slowing in 2012.
Is stagflation on the way like the 1970s? Then interest rates got to 20%. So there was a weak economy plus high inflation. 2008 looks different with a weak economy with high commodity prices and possible a mild recession. The 1970's crisis was much worse with a soft economy with rising prices. So we might expect inflation  5% and core inflation
  3%. For a recession one would expect 100-200,000 job losses per month. February lost about 63,000 jobs, the most in five years. And it would have been over 100,000 except for new government jobs. The US has never avoided a recession when jobs declined two months in a row. So with January's loss of 17,000 jobs (22,000 revised), the odds of a recession have risen. January's loss was the first since the loss of 42,000 in August 2003.
What is Warren Buffett thinking and doing?
The sage of Omaha regained the title of the world's richest person as Berkshire Hathaway stock rose 28% in 2007. At 22 times trailing earnings and 1.7 times book value, Berkshire Hathaway stock at 4500 for B shares and 135,000 for A shares, was not cheap but many of us like it as a long term hold; see Chapter 6 for a long term analysis which shows that over 40 years Berkshire has had returns about double the S&P500500. The B-shares split 50 for 1 and as of September 15, 2012 were trading at about $85. As of the beginning of March, Buffett thought the US economy was in recession. Despite the falling US stock market, see Figure 27.4, with the S&P500 down 13.28% in 2008 to 1273.37 on March 10. He has been buying equities, averaging $75 million each trading day. In a CNBC interview he said that
stocks are not cheap. As a group they're not at some bubble price. But they go to extremes every now and then when they do do to extremes you have to be prepared to act.
Purchases include Burlington Northern, Kraft Foods, Wells Fargo and Johnson and Johnson. Sales include a $4 billion stake in PetroChina, with a tenfold gain in five years.
Berkshire holds a $75 billion portfolio with the largest holdings are Coca-Cola, Wells Fargo, Procter and Gamble and American Express. While Buffett says he does not like derivatives, his main business is insurance which is essentially put selling. His style, much like mine, is to try to sell options that expire worthless. Buffett has $4.5 billion in premiums from selling at-the-money S&P500 puts and on three other foreign equity indices - a dangerous trade usually - but the time to expiry of the non-exercisable puts is 15-20 years. So all he needs is the S&P500500 and the other indices to be even to use the proceeds for all these years and to expire worthless is for the S&P500500 and others to stay even over this long period. The puts have a notional $35 billion value. The buyers, presumably insurers, seek minimum payoffs on special products guaranteed not to lose money. No margin was required attesting to the great financial strength of Berkshire. Given the 2008 fall in equity prices, the $4.5 billion was worth about $5.5 billion so Berkshire is $1 billion behind but in the end, the chances are very good that the short puts will go to zero. Other bets include $3.2 billion in junk bond premiums that these bonds do no default. Buffett's game, like mine, is to obtain premiums that are large relative to the risk and have the risk contained with plenty of cash to weather the storms.
Summary
•All the subprime problems have not yet been dealt with
•No one knows how bad it will get or who next will disclose new losses
•Some measure have been taken:
–Lower interest rates
–1% of GDP US tax relief. Stimulus $165 billion coming about June 2008.
•Accommodative Fed on money supply
•Stocks have low PEs and the option T-measure is good
•But there was the June 14, 2007 sell signal by the bond-stock earnings yield model
•Still too much trouble for a large rally: much uncertainty
•January barometer suggests weak 2008
•Oil remains high at $107.90 per barrel when we went to press on March 10, 2008
•Dollar remains weak and is pulling down the US and worldwide stocks
•Gold, silver and other commodities are strong
•High volatility remains
•Effects of the US presidential election
–it will be fought over the economy and the Iraq war
–if McCain, the Republican nominee wins, he has pledged that the Iraq war will continue till it is won, up to 100 years, so there will be large costs in money and lives. The Bush tax cuts, set to expire in 2011 will be extended unless the Democrats have an expanded majority in the Congress.
–If a Democrat wins, then the Iraq war will be phased down but how fast troops will leave is not clear, and the Afghanistan war is likely to expand and it was with Obama sending 30,000 more troops; at $1 million/person year. This is a lot of money plus all the other suicides, family stress etc. The tax cuts likely will be allowed to expire or even be reversed. More will be spent on health care.
–John McCain was the Republican nominee. For the Democrats, Barack Obama was the 1.36-1.37 odds on favorite to get the nomination with Hillary Clinton and 3.95-4. So Obama was a large favorite despite Clinton's wins in Ohio and Texas. For the next president, the odds were Obama 2.26-2.28 and McCain 2.9-2.92 and Clinton 5.5-5.6 (all on Betfair, March 10, 2008).
Postscript: To update, Obama won the Democratic nomination and was the 2008-2012 president.
1 Edited from Wilmott (.May 2008) and based on a February 4, 1008 Fieance Focus lecture organized by Wilmott magazine and 7city and sponsored by d-fine. Thanks to Rachel Ziemba for helpful comments on earlier drafts.