5
USING MUTUAL FUNDS AND ETFS TO ACHIEVE YOUR FINANCIAL GOALS
“If you have the stomach for stocks, but neither the time nor the inclination to do the homework, invest in equity mutual funds.”
—Peter Lynch, American investor, mutual fund manager, and philanthropist.
Nearly 100 million individual investors own mutual fund shares, either directly or indirectly through their retirement plan account. Over half of the Generation Xers (born between 1965 and 1980) and nearly 40% of the adult Millennials (born between 1981 and 2004) own mutual funds. Why? The answer is simple: mutual funds are the best way for a novice investor to start investing. Through mutual funds, you can invest in the stock market or bond market or both, even with a small initial investment stake. You can easily diversify that small initial investment and subsequent contributions to reduce risk. This level of diversification is impossible when buying individual stocks. If you choose a fund or funds wisely, you may never have to pick another fund again. So, if you want to join those savvy investors and use the wealth-building power of the stock and bond markets but don’t want to spend your time following the economic prospects of dozens of companies, then mutual funds are for you.
You may already be exposed to mutual funds through your employer. Mutual funds are especially prevalent in retirement planning. Indeed, most people buy their first mutual fund through an employer-sponsored retirement plan, and many others own mutual funds in an individual retirement account. Chapter 6 provides a discussion of retirement accounts. You may also have seen a mutual fund distributor at your bank or credit union, which often operates under the appearance of a financial advisor. If you’re unsure how mutual funds operate and what they can do for you, read this chapter!
The term “mutual fund” actually encompasses many similar types of pooled investment vehicles (PIVs) including open-end mutual funds (OEFs), closed-end mutual funds (CEFs), exchange-traded funds (ETFs), and unit investment trusts (UITs). However, most people generally associate mutual funds with OEFs. The characteristics of these types of funds are described here. After reading about them, you’ll be able to utilize their investing power in your life to build wealth.
5.1. WHAT IS A MUTUAL FUND?
A mutual fund is a popular investment vehicle that enables you to invest even small amounts of money into targeted or diversified investment strategies. Organizationally, an investment company pools money from investors like you to buy stocks, bonds, and other financial assets aligned with its stated objectives. Fund objectives are formulated similar to “capital appreciation from large capitalization company stocks,” or “income from government bonds.” A fund’s objectives are specified in its prospectus, which is a legal document required by the Securities and Exchange Commission, that provides details about an investment offering for sale to the public. The fund’s professional investment managers select the securities in its portfolio. The most popular type of mutual fund is known as an “open-end” fund. Another less common mutual fund structure is referred to as a “closed-end” fund.
“Many financial innovations such as increased availability of low-cost mutual funds have improved opportunities for households to participate in asset markets and diversify their holdings.”
Janet Yellen
Open-end funds. The open-end structure allows the investment company to offer new shares of the fund directly to investors. The fund has no limit to the number of shares it can issue – it’s literally open ended. When you buy shares from the fund, it creates them as new shares. The fund exchanges its shares for your cash and puts the cash in the portfolio for investing. When you want to sell, the fund returns cash to you by redeeming the shares. To buy your shares, the fund uses cash from its portfolio. If the fund does not have enough cash for the shares being redeemed, it sells some investment assets to generate the needed cash. As a result, the number of fund shares outstanding changes as investors buy or redeem shares over time.
At what price do you buy or redeem shares? The price of a mutual fund’s shares is known as its net asset value (NAV) per share. Typically, at the end of the business day and after the major US exchanges have closed, the fund determines the value of its portfolio. The NAV is computed as the portfolio’s market value less any fund liabilities divided by the number of shares outstanding. The price at which you buy or sell shares is based on this NAV and fluctuates because the value of the securities held in the portfolio changes daily.
The mutual fund shares you own represent a proportional ownership in the fund’s portfolio, so your percentage return is the same as that of the fund. For example, one of the largest mutual funds is the Fidelity Contrafund. The fund seeks capital appreciation through investing in large-cap growth stocks. Thus, it owns the stock of companies like Apple, Disney, and McDonald’s. After a good day in the stock market, the invested portfolio increased from a value of $113.62 billion to $114.77 billion and had over 8,840 million shares outstanding. Thus, its NAV increased from $12.85 to $12.98 per share. The mutual fund portfolio gained 1.01% [ = ($114.77 − $113.62) ÷ $113.62 × 100%] that day, and so did the mutual fund investors 1.01% [ = ($12.98 − $12.85) ÷ $12.85 × 100%].
“Mutual funds were created to make investing easy, so consumers wouldn’t have to be burdened with picking individual stocks.”
Scott Cook
Closed-end funds. A CEF operates differently from an open-end fund. A CEF begins by first creating a large investment portfolio. Then, the fund creates shares and sells them to the public similar to a company’s initial public offering. The number of shares is fixed, so it is closed. Like an OEF, CEF shares represent a proportional ownership in the investment portfolio. Once the fund sells its shares to investors, those shares trade on a stock exchange like a typical company’s stock. Although a CEF share has an NAV, the price is determined by trading in the stock market. A discount often exists between the trading price and the NAV. Nearly two-thirds of CEFs assets are invested in bonds. CEFs have lost much popularity over the past few decades because of the frustrating and persistent price discount and the rise in popularity of ETFs. Now CEFs only represent about 1% of the total mutual fund market.
UITs. UITs form a portfolio and offer a fixed number of shares for investment like a CEF. However, UIT shares don’t trade on an exchange. Additionally, a UIT has a stated expiration date for liquidating the portfolio. Finally, investors receive securities held in the portfolio instead of cash when they redeem shares. UITs represent only 0.25% of the mutual fund market.
5.2. WHAT ARE THE ADVANTAGES OF OWNING MUTUAL FUNDS?
Mutual funds are a popular investment choice because they offer many advantages. Savvy investors appreciate that funds offer a wide variety of investment strategies, provide diversification, are convenient, can be cost-effective, and use professional managers. In some situations, like your employer’s retirement plan, mutual funds may be the only choice available. Specifically, fund attributes provide:
Strategies. Thousands of mutual funds are available with numerous investment objectives. Many mutual fund choices concentrate on equities, fixed income, or some combination. Some funds focus on more limited objectives like investing in single industries or sectors, or investing in narrow asset classes like the municipal bonds issued in a single state.
“The ‘know-nothing’ investor should practice diversification, but it is crazy if you are an expert.”
Charlie Munger
Diversification. Diversification reduces a portfolio’s overall risk. Individual company stocks have a high degree of firm-specific risk. A company faces many uncertainties conducting its business. Some risks are the same for all firms such as changing interest rates, inflation, and trade policy. Other risks, called firm risks, are specific to that company, such as its reputation, labor relations, and product liability. Combining many stocks can reduce this type of risk, but it may take numerous stock holdings. Creating these positions can be expensive after adding the various trading costs, which is difficult to do with a small investment stake. Additionally, the mechanics of obtaining the optimal level of diversification involves a high level of technical skills. However, mutual funds can have highly diversified portfolios consisting of many stocks and even bonds. Thus, the single fund share is already diversified. As a result, mutual funds are a great investment choice for people who (1) prefer not to address the complexities of diversification, (2) have a small initial investment, or (3) make small periodic contributions.
Convenience. Investing in mutual funds is both easy and convenient. You can invest an initial lump sum and set up automatic monthly contributions directly from your bank account. Each mutual fund or fund family sets its own minimum initial investment and common minimums vary between $100 and $3,000. Within a mutual fund family, you can move money from one of its funds to another as you change investment strategies or economic outlook.
Professional management. A professional manager or team of experienced professionals selects a mutual fund’s portfolio. These managers implement rigorous research and analysis using real-time access to information sources normally unavailable to the typical individual. Full-time, highly trained fund managers can monitor the buy, sell, and hold decisions better than part-time investors.
Cost. Mutual funds can build a large diversified portfolio at a lower cost than a regular investor because their size allows them to execute trades on a timely and cost-effective scale. However, mutual funds charge fees that reduce your overall return.
5.3. WHAT ARE THE COSTS OF MUTUAL FUNDS?
A main disadvantage of owning mutual funds involves the various fees that they charge. Remember, savvy investors evaluate performance after costs. Fund fees add up over time and reduce investment return. Below are some statistics from the Investment Company Institute 2019 Fact Book.
“To make the most of your money, I recommend sticking with mutual funds that don’t charge a commission when you buy or sell.”
Suze Orman
Loads. The commission to buy mutual fund shares is called a front-end sales load and usually goes to the person selling or recommending the fund to you such as an advisor, not the mutual fund itself. The maximum load charged is 8.5%, but most front-end load funds charge much less. Nevertheless, the cost can be high. Consider a $5,000 investment in a fund earning 10% per year for 10 years. Investing the full $5,000 would yield $12,968.71. However, a 5% load at the beginning would initially cost $250. The resulting $4,750 invested at 10% for 10 years would grow to $12,320.28. Because of the $250 load, you’re missing out on a future $648.43. You can avoid paying a load by buying a no-load fund because they don’t charge this fee. Avoiding loads is popular – about eight times more assets are in no-load funds than in front-end load funds. Investors recognize what the research shows – load funds, on average, don’t perform better than no-load funds, so the commission is a drag on returns. Be wary of some financial advisors who recommend load funds in order to capture the load as compensation. A no-load fund alternative is always available! Finally, some funds charge a redemption fee or back-end load. This sales charge is a fee for selling the fund’s shares. Back-end fees are less common, and the fee usually declines each year that you hold the shares to provide an incentive to hold the shares longer. Therefore, long-term investors can avoid the fee.
Marketing fee. Funds can charge an annual marketing fee, known as a 12b-1 fee. Although this fee is more widely known as paying for advertising and marketing, it can also serve as a way to compensate financial intermediaries by paying mutual fund distributors and brokers. The annual 12b-1 fee is generally between 0.25% and 0.75%, which is the maximum allowed, of a fund’s net assets.
Management fee. All mutual funds charge a management fee, which is the main source of compensation for the investment company. This fee pays for the professional manager and all of the business costs, including the institution’s own profit. The management fee can range from 0.10% to 3.0%. Actively managed fund portfolios that invest in more specialized assets, like emerging market stocks, are likely to charge higher fees because buying these assets may require hiring managers with specific expertise in addition to transaction costs of currency exchange. Passively managed funds charge much lower fees because they have no need for expensive portfolio managers and the trading costs are lower. A passively managed fund tries to match an index or part of the market instead of trying to select securities to beat the market.
Expense ratio. The best way to gauge the long-term cost of a mutual fund is to examine its expense ratio. The expense ratio combines the fees, loads, and trading costs of the fund and presents them as a percent of assets under management (AUM). The average expense ratio has declined over the past few decades largely due to competition and is now around 0.55% for stock mutual funds, 0.48% for bond funds, and 0.66% for hybrid funds. A hybrid fund invests in multiple asset classes and thus holds stocks, bonds, and cash positions.
“Even a 1% difference in expense ratio can make all the difference between a comfortable retirement and financial distress.”
Robert Rolih
5.4. WHAT ARE OTHER DISADVANTAGES OF MUTUAL FUNDS?
Although fees and costs are the primary disadvantage of mutual funds, they also have some other disadvantages.
“Another huge toll has been taken by taxes. Passively managed index funds are tax-efficient, given the low turnover implicit in the structure of the Standard & Poor’s 500 Index.”
John C. Bogle
Taxes. Most mutual fund managers focus on earning a higher return, not necessarily a tax-efficient return. For example, a fund that trades frequently could incur short-term capital gains, which are taxed at a higher rate than long-term capital gains. The mutual fund passes on those capital gains to its investors. Although the fund may advertise high returns, you could be stuck with a large tax liability. As a mutual fund investor, you may have little opportunity to maximize your after-tax returns.
Window dressing. At the end of each calendar quarter, a mutual fund must report its holdings. Just before quarter’s end, some managers may try to improve their portfolio’s appearance by selling loser positions and buying securities that flourished that quarter. This behavior is called window dressing. Although window dressing doesn’t improve the quarter’s return, it may make the portfolio look better to attract new investors. This strategy might even reduce returns because of the associated trading costs.
Excessive cash holdings. When you allocate your investment to a stock mutual fund, you expect the fund to be fully invested in stocks. Cash earns a low or no return, so holding considerable cash creates a drag on fund returns. However, mutual funds must hold some cash to meet future investor share redemptions.
Professional management. Wait, wasn’t professional management an advantage? Yes, but many professional managers aren’t any better at selecting stocks and timing the market than the average investor. At least they’re not sufficiently better to overcome the fees charged by the fund.
5.5. WHAT ARE THE DIFFERENT MUTUAL FUND CATEGORIES?
Worldwide, tens of thousands of mutual funds are available. In 2018, the United States alone had 9,599 mutual funds. Two ways to categorize these funds is by their asset type and by their investment strategy. The next question examines investment strategy. Here, the focus is on the primary groups of funds. The following list is ordered by the fund’s general level of risk with the lowest risk shown first. Note that risk and expected return are positively related. Thus, they’re also ordered by their relative expected return with the lowest expected return presented first. Note that Figure 5.1 illustrates the basic fund type and its associated risk and expected return.
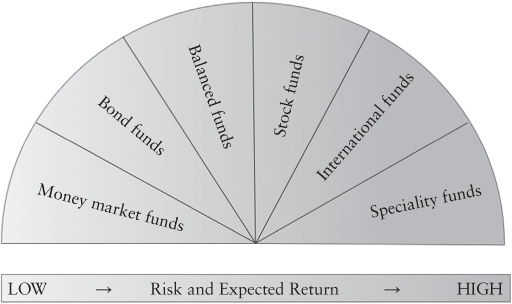
Figure 5.1. Figure 5.1. Mutual Fund Categories and Their Risk and Expected Return
Money market. Money market funds invest in very safe debt instruments maturing in less than 13 months. Investment assets include US Treasury issues, short-term commercial paper, and certificates of deposit. The returns, risks, and objectives are similar to a bank money market savings account.
Bond. These funds invest in fixed income assets, mainly bonds. Their primary objective is to provide a steady income to their investors. Bond funds entail more risk than money market funds but are generally considered to be low on the risk scale compared to stock funds. The main risks from owning bonds come from credit risk and interest rate risk. Credit risk is the risk that the issuer may fail to pay the bond’s interest and principal of its borrowings. Interest rate risk comes from the changing interest rates in the economy that cause fluctuations in bond values. An inverse relation exists between changes in interest rates (yields) and bond prices. Thus, when interest rates decrease, bond prices increase; when interest rates increase, bond prices decrease. Bond funds can also be categorized by the types of bonds that investors purchase.
Government. Some funds minimize credit risk by buying securities issued by the US Treasury and other federal bonds.
Corporate. Some funds invest in the debt of corporations. Credit risk for corporate bonds varies widely. Credit rating firms grade corporate bonds from low risk (AAA) to high risk (BB and below). Corporate bond funds often choose to either own the safer bonds or seek higher returns by owning the more speculative bonds.
Municipal. Municipal bond funds own the bonds issued by state and city governments. Their pre-tax yields are lower than corporate bonds but offer tax advantages. Thus, wealthy investors often buy municipal bond funds owning the bonds of the state in which they live, which gives them both federal and state income tax relief for the interest paid. Although the pre-tax returns are often lower in municipal bond funds, the after-tax returns can be higher for investors in high tax brackets.
Balanced/life cycle. Balanced funds, life cycle funds, and target retirement year funds all invest in a mix of stocks, bonds, and cash. The proportions of each asset in a fund portfolio vary and can change over time depending on the fund’s objective. For example, a balanced fund may increase the proportion of stocks held when the manager believes the economy favors equities. Alternatively, a target retirement year fund typically holds more stocks at its beginning and then slowly allocates more of its assets to bonds over time as the target year approaches.
“Mutual funds have historically offered safety and diversification. And they spare you the responsibility of picking individual stocks.”
Ron Chernow
Stock. Stock mutual funds hold the shares of various corporations. Historically, stock prices have been volatile and thus risky. However, over the long run, stocks have also outperformed other types of traditional investments. As such, stock funds are the most popular category of mutual fund. Because of the many stock funds available, they’re categorized in many ways including by the size of the companies they hold in their portfolios.
Large cap. These funds invest in stocks of firms with a market capitalization greater than $10 billion. Market capitalization is a measure of a company’s size and is calculated by multiplying the total number of shares outstanding by the current stock price.
Mid-cap. These funds invest in stocks of firms with a market capitalization from $2 billion to $10 billion.
Small cap. These funds invest in stocks of firms with capitalization in a range from $250 million to less than $2 billion.
Micro cap. These funds invest in stocks of firms with a market capitalization of less than $250 million.
Global/international. These funds buy securities around the world. Specifically, international funds invest outside of a home country, such as outside the United States for US international funds. Global funds buy securities anywhere. Although they provide a great diversification opportunity, global funds also entail extra risks due to currency exchange rate fluctuations and risks associated with foreign governments. Funds concentrating their holdings in a single emerging market country are especially risky.
Specialty. Specialty funds focus on specific sectors or industries, like technology or financial firms. This concentration makes them less diversified and thus more risky.
5.6. WHAT ARE THE DIFFERENT INVESTMENT STRATEGIES OF MUTUAL FUNDS?
Funds within each mutual fund category can invest for different investment goals. For example, one large-cap stock fund could seek capital appreciation by trying to buy stocks that increase in price, while another fund could seek income by owning high-dividend paying companies. Thus, the two funds’ portfolios would have little overlap even though they’re both large-cap funds.
Other common investment strategies are those associated with the growth/value dimension. Companies are often delineated by their growth versus value prospects. Growth stocks are expected to grow at a faster than average rate. In contrast, value stocks are shares of a company with strong fundamentals that are priced below those of their peers. Value stocks provide a lower relative price. Common measures of growth and value are the stock’s price-to-earnings (P/E) ratio and book-to-market (B/M) ratio, respectively. A lower stock price compared to earnings per share indicates a value stock. A higher P/E ratio is associated with a growth stock. Similarly, a higher book value (B) per share compared to the stock price (M) indicates a value stock. Growth stock mutual funds own many high P/E ratio and low B/M firms. Value funds own low P/E ratio and high B/M firms.
5.7. WHAT IS AN INDEXED OR PASSIVELY MANAGED FUND?
The old saying, “if you can’t beat them, join them,” has worked well in the mutual fund industry. Traditionally, all mutual funds shared a common goal of beating the stock market or their respective benchmark. Then, in 1976, John “Jack” Bogle, the founder and chief executive of The Vanguard Group, had a different idea – just try to match the market. Some derided this idea as only trying to be average and labeled it Bogle’s Folly. However, because of the high fees funds charged in those days, most funds didn’t beat the market. In fact, they underperformed. If a fund could match the market, it would rank much better than average. The idea was to form a portfolio that mimicked the S&P 500 Index with very low fees. Since the investment company didn’t need to hire expensive portfolio managers, it could charge an extremely low management fee to fund investors. Also, since the stocks in an index rarely change, the fund would have little turnover and experience lower associated trading costs. With the start of the Vanguard 500 Index mutual fund (VFINX), the indexed fund was born. Formally, a passively managed fund, also called an index fund, invests using a strategy to match the performance of a stock index. An actively managed fund has a manager or team choosing investments with the objective of outperforming the fund’s benchmark or market index. The mutual fund industry now differentiates between actively managed and passively managed funds. Today, index funds hold more than one-fifth of the total mutual fund AUM. Clearly, Bogle’s idea was not folly but quite savvy! The competition from the growth of index funds has caused actively managed funds to lower their fees. Now, the average expense ratio for actively managed stock mutual funds is around 0.76%. The largest stock index funds’ expense ratio averages only 0.08%. In 2018, Fidelity Investments announced two zero-cost index mutual funds – the Total Market Index Fund and the International Index Fund. The cost of trying to mimic an index has become negligible and thus should be an important part of a savvy investor’s portfolio.
5.8. WHAT DO ACTIVELY MANAGED MUTUAL FUNDS TRY TO ACCOMPLISH?
Actively managed funds don’t try to mimic the return of a particular index. Instead, they try to beat it. If you owned all of the same stocks in an index and owned them in the right proportions, you’d earn exactly the index return. To beat that index return, you need to do something different. You could invest in a subset of the index’s stocks, own different proportions of each stock than represented in the index, or both. Active portfolio managers use their research, experience, and intuition to select stocks to buy and sell. If the fund holds the better performing stocks but not the underperforming ones, it will beat the market. Because stocks are risky, their prices fluctuate. If fund managers can time the market fluctuations to buy stocks at low cycle prices and sell at cycle highs, they’ll beat the market. Sound easy? It isn’t. Because mutual funds and other institutional investors hold most of the stocks and do most of the trading, they can’t all beat the market. If some funds hold the outperforming stocks, then other funds likely hold the underperforming ones. When one fund buys a stock, another fund is likely selling it. You might, therefore, think that for every fund beating the market, another is underperforming. That is, half the funds beat the market and half don’t. Unfortunately, that’s not true because of the fees that mutual funds charge. Active funds charge higher fees than index funds. So, in the end, abundant research evidence shows that most actively managed funds underperform the market net of fees and expenses. Because of that, index funds tend to outperform most actively managed funds over time.
“Santa Claus and the Easter Bunny should take a few pointers from the mutual-fund industry. All three are trying to pull off elaborate hoaxes. But while Santa and the bunny suffer the derision of eight year olds everywhere, actively-managed stock funds still have an ardent following among otherwise clear-thinking adults.”
Jonathan Clements
5.9. CAN YOU JUST SELECT THE ACTIVELY MANAGED FUNDS THAT OUTPERFORM THE MARKET AFTER FEES?
“The idea that a bell rings to signal when investors should get into or out of the market is simply not credible. After nearly 50 years in this business, I do not know of anybody who has done it successfully and consistently.”
John C. Bogle
That turns out to be difficult to do for several reasons. First, the stocks that outperform one quarter are often not the same stocks that outperform in the following quarters. Thus, active managers need to rotate their holdings to try to keep picking the winners, which involves trading costs. Second, funds that do well for several quarters attract much more money to invest because investors chase these winner funds with their investment stake. This phenomenon is called herding. The larger the portfolio becomes, the more difficult it is for fund managers to invest in the subset of stocks they think will outperform. Finally, discerning manager talent from luck can be difficult, especially in the short run. What if it’s just luck that causes the subset of the stocks in the index a manager selects to outperform? After all, a broken clock is right twice a day.
Say that you find 64 actively managed mutual funds with a small-cap growth objective. Like flipping a coin, half of them, 32, will outperform one quarter. Half of those, 16, will outperform two quarters in a row, and 8 will do so for three quarters. Only about four will outperform in all four quarters of the year. So, when you see a fund has outperformed in every quarter of the year, was this performance based on investment skill or just luck? Because differentiating between manager luck and skill for short time periods like a few years is so difficult, savvy investors have moved to passively managed, low-cost index funds.
5.10. WHAT FUND CHARACTERISTICS SHOULD YOU EXAMINE?
You should pick a mutual fund based on specific characteristics that suit your situation. The main factors that are likely to drive a fund’s suitability for you revolve around strategy, cost, and performance. Performance evaluation is discussed in the next question. Ultimately, a fund’s return depends on the performance of the underlying securities in the portfolio. Thus, the type of assets and the strategy for selecting them is paramount. Besides performance, you should consider the following factors.
Avoid loads. Mutual funds want investment flow. That is, they want investors to buy their funds. The larger their portfolio, the more money they make from fees. Thus, most funds offer different share classes for the same portfolio. This situation means that they’re willing to charge no loads for investors who seek them out directly. They’re also willing to charge a sales load to compensate financial advisors who bring them new investors. Funds are also willing to charge lower fees for other institutional investors investing large sums in their fund. So, if a pension fund or other mutual fund wants to invest in their fund, then a lower fee share class may be available for them. The bottom line is that you can likely find a way to avoid sales charges.
Choose funds with minimal expenses. As discussed earlier, your primary annual fund costs come from the management fee, marketing fee, and trading costs. These and other costs combine to form the expense ratio. The lower the expense ratio, the higher the fund’s return is likely to be in the long run. You should avoid funds with excessive expense ratios.
Strategy. You should choose a fund whose investment objective, asset class, and style match your needs.
Match the objective. The primary fund objectives are capital preservation, capital growth, and income. Look for the funds that meet your needs at this point in your life.
Identify the asset class. The major traditional asset classes are stocks, bonds, and cash-like securities. Within these major categories, funds also have subclassifications. For stocks, classifications can be by geography or region (international and domestic) and by company size (large, mid, small, and micro). Bond funds delineate by the type of bond issuer such as government, corporate, and municipal and level of credit risk.
Determine the investment style. Stock funds are either actively or passively managed. If they’re actively managed, they may seek higher returns by focusing on value or growth stocks. Other common strategies are also available such as following momentum or using environmental, social, and governance (ESG) criteria. ESG funds focus on stocks that have positive environmental impact, such as low pollution or the use of recycled products. These funds may also seek pro-society policies like ensuring their supply chains do not include child labor. Bond funds can also be indexed or actively managed.
5.11. HOW CAN YOU EVALUATE THE PERFORMANCE OF A MUTUAL FUND?
The answer to this question may seem like it should simply be “historical return.” However, evaluating a fund’s performance is more complicated. A basic principle in finance is the risk–return trade-off. That is, a positive relation exists between risk and expected return. Over time, if you take more investment risk, you should earn a higher return. Therefore, when you see that one stock mutual fund earned a higher return than another, it could simply be that it took more risk, which doesn’t make it a better fund, just a riskier one. Additionally, a stock fund’s performance over time depends on how the market performs in general. Therefore, you should consider both risk and the contemporaneous market return when evaluating a fund’s performance. Popular strategies for evaluation include computing a risk-adjusted performance, comparing performance to indices or other funds with similar risk, or both.
Three major types of risk-adjusting performance methods are prevalent in the industry. To adjust for risk, you first need a measure of risk. Two common risk measures are the standard deviation of historical returns and beta. A high standard deviation indicates high total risk because it means that the return varies considerably and is unstable. Beta is a measure of market risk, also called systematic risk, that indicates the relation between a fund’s return and the return on a market index, such as the S&P 500 Index. A higher beta indicates a stock or portfolio has more market risk. That is, the stock or portfolio is more sensitive to market movements than the overall market, which has a beta of 1.0. For example, a stock with a beta of 2.0 would return twice the market return in a given period. Thus, if the market as measured by the S&P 500 increases 3%, the stock would be expected to increase 6%.
Three common risk-adjusted measures are:
Sharpe ratio. The Sharpe ratio is named for its creator, William F. Sharpe, a 1990 Nobel Memorial Prize in Economics winner. This popular method divides the average portfolio return earned above the risk-free rate (i.e., a portfolio’s excess return) by the portfolio’s standard deviation of return. Thus, the Sharpe ratio indicates the excess return per unit of total risk. Since each investor can earn the risk-free rate via the Treasury bill, the excess return above the Treasury bill is the proper measure of return. For example, if the Sharpe ratio is 1.5, this means that for every unit of portfolio risk measured by the standard deviation of portfolio return, you’d be getting 1.5 units of excess portfolio return. Because you want a higher return for the level of risk taken, you’d prefer portfolios with higher Sharpe ratios. The Sharpe ratio is usually compared among funds and indexes. A fund with a higher Sharpe ratio earned more return for the risks taken compared to a fund with a lower Sharpe ratio.
Treynor measure. The Treynor measure is similar to the Sharpe ratio except that it uses beta as its risk measure. Thus, the Treynor ratio is computed by dividing the portfolio’s average return less the risk-free rate by the portfolio’s beta. It shows the portfolio’s excess return per unit of market risk. Like the Sharpe ratio, the higher the Treynor measure, the better is the risk–return trade-off.
Alpha. Alpha is a fund’s excess return relative to the return of a benchmark index. What should the fund have earned? That’s determined by how a market index performed, like the S&P 500 Index, which is then adjusted for the portfolio’s risk level as measured by its beta. For example, consider that one month’s risk-free rate was 0.1% and the S&P 500 Index earned 2.0% that month. If a fund has a beta of 1.2 and earned a return of 2.7% that month, its alpha would be 0.3% ( = 2.7% − 0.1% − 1.2(2.0% −0.1%)). That means the fund earned 0.3% more than it should have earned. That is, the fund outperformed, given its level of risk. If the fund had earned 2.3%, then its alpha would have been −0.1%. Thus, savvy investors prefer funds with positive alphas, not negative alphas.
Where can you find Sharpe ratios, Treynor ratios, and alphas for the funds you’re researching? One common source is Morningstar.com. You can get information like the performance of Fidelity Growth Strategies, which is in the mid-cap growth category of funds. For the past three years (ending September 2019), the fund’s alpha was –0.78%, which is negative but still better than the category average of –1.09%. The fund’s Sharpe ratio of 0.85 beat the category average of 0.80. Although the fund beat the average performance of its category, it underperformed its benchmark index, the Russell Mid-Cap Growth Index. The Index alpha was –0.04% and its Sharpe ratio was 0.91. Underperforming a benchmark index is common because funds charge fees, have trading costs, and need to hold some cash to facilitate redemptions. In contrast, indexes have none of these limitations.
A comparison with the fund’s category and benchmark is a common way to assess its performance. Two popular mutual fund information services conduct this analysis using category rankings and performance indicators.
“The best-known stars are, of course, those funds awarded top five-star billing by Morningstar Mutual Funds.”
John C. Bogle
Morningstar ratings. Morningstar presents fund returns and risk-adjusted measures relative to the fund’s competitors in its fund category as well as with the benchmark index as just illustrated. Morningstar also ranks fund performance in its category and presents percentile ranks. Thus, you can easily see if a fund is in the top 20% of its category. Additionally, Morningstar assigns a star system based on risk-adjusted performance to rank the funds. The top rating is five stars, while the bottom ranking is one star. A fund must perform in the top 10% of its category to earn a five-star rating. The next 22.5% of the ranked funds earn four stars. The middle 35% earn three stars.
Five-star mutual funds often advertise the ranking and see new investors flock to the fund. For a three-year period ending September 2019, Fidelity Growth Strategies earned a return of 11.80% per year, which was 1.33 percentage points lower per year than its category average and 2.96 percentage points lower than the Russell Mid-Cap Growth Index. The fund merited a three-star rating. Three stars might seem too generous, but the system is based on risk-adjusted performance. Because this fund was less risky, its Sharpe ratio and alpha were higher than the category average.
Lipper ratings. Lipper is a competitor to Morningstar and has its own proprietary five-tiered rating system. The Lipper ratings rank funds within the same category into quintiles, thus the top category is the best 20% of category funds over the period. These top funds are labeled as a “Lipper Leader.”
5.12. HOW DO YOU INVEST IN A MUTUAL FUND?
You buy and sell mutual fund shares in specific amounts. This approach differs from buying stocks where you purchase a specific number of stock shares which, along with the price, determines the amount of the purchase. For example, to buy 100 shares of a stock priced at $35 per share requires investing $3,500 plus commission costs. When buying fund shares, you choose the amount of money to invest and the NAV determines the number of shares purchased. When you invest $3,000 in a mutual fund with an NAV of $25.35, you will get 118.3432 shares. Yes, you read that correctly, you can own fractional shares of a mutual fund.
You don’t need a brokerage firm to buy mutual fund shares. You should go directly to the mutual fund family’s web page to fill out the forms. The minimum initial investment in a mutual fund usually varies between $100 and $3,000. Some funds waive the minimum when you sign up for monthly automatic investments.
5.13. WHAT IS AN ETF?
ETFs have become a popular investment tool for both individual and institutional investors. An ETF is similar to an open-end index mutual fund in several ways. An ETF is created when a financial institution forms a portfolio that is designed to mimic a specific index. Like an index mutual fund, it is a passively managed portfolio and the largest ETFs have a very low expense ratio of less than 0.20%. The main distinction is that shares of an ETF are issued like a company’s stock. To buy ETF shares, you must buy them like you’re buying shares of a company. For example, the SPDR S&P 500 ETF (with ticker symbol SPY) tracks the S&P 500 Index. It is usually one of the most traded stocks on the stock exchange and averages 70 million shares traded per day. Remember, you buy shares of a mutual fund from the fund itself, including fractional shares. Buying shares of an ETF involves a brokerage account, which may charge a commission and the purchase of whole, not fractional, shares. Compared with open-end funds, this difference involves several advantages and disadvantages.
5.14. WHAT ARE THE ADVANTAGES OF USING ETFS?
ETFs have gained popularity for several reasons.
Convenience. Anyone with a brokerage account can easily buy and sell ETFs. Because they’re traded like stocks, you can trade intraday and you can place some sophisticated orders such as limit orders and stop loss orders. You can also use strategies such as short selling and margin trading. Chapter 2 contains information about different types of buy and sell orders, short selling, and margin trading.
Low costs. Because most ETFs are passively managed to track an index, they have very low expense ratios.
Liquidity. Over the past decade, institutional investors substantially increased demand for ETFs, which greatly increased the trading of ETFs. Indeed, the most traded stocks on the exchanges are frequently ETFs – often the SPDR S&P 500 (SPY) and the Invesco QQQ Trust (QQQ) are at or near the top. The QQQ tracks the NASDAQ 100 Index and averages 30 million shares traded daily. All this trading provides enormous liquidity for investors when they buy and sell.
“The reason why ETFs are a phenomenal success is that they solved a lot of problems clients faced with mutual funds, namely surrounding transparency, liquidity, costs and tax-efficiency. Remember, we have been working on developing the ETFs for 15 years before it finally caught on and became popular.”
Robert S. Kapito
Diversification and segment exposures. Investors can buy diversified portfolios or get access to narrow market exposures depending on the ETFs selected. For example, you could own an ETF like the SPY and have your investment diversified across the 500 largest companies in the United States. However, if you’d like to add exposure to smaller companies, then you could buy an ETF such as the iShares Russell 2000 EFT (IWM). If you want to add bonds to the portfolio and diversify even more, then you could add something like Vanguard’s Total World Bond ETF (BNDW). Thus, obtaining a diversified investment portfolio is easy. However, you can also use ETFs to concentrate investment in narrow economic segments or industries. For example, if you think that the current economic environment suits energy firms, you can buy the Energy Select Sector SPDR Fund (XLE). Or maybe you think that world trade favors a specific country. If so, then buy a country-focused ETF like iShares MSCI Switzerland ETF (EWL) or a regionally focused fund like iShares Latin America 40 ETF (ILF) or an economically developed or developing category fund like Schwab Emerging Markets Equity ETF (SCHE).
5.15. WHAT ARE THE DISADVANTAGES ASSOCIATED WITH INVESTING IN ETFS?
Despite their popularity due to their flexibility and advantages, ETFs also have several disadvantages.
“The ETF industry has become like a supermarket. You can’t go in and not know what you want-you’ll end up buying all these things that you won’t ever eat.”
Matthew Reiner
Trading costs. Since investors buy and sell ETFs on stock exchanges like equity shares, they have two sources of trading costs: commissions and the bid–ask spread. Commission costs are the trading fee charged by your broker. This fee is likely small, and the industry trend is for brokers to eliminate commission costs on ETF trades. The bid–ask spread is a cost that is not particularly obvious to investors. When you buy a stock, you buy at the market maker’s ask (higher) price and sell at the bid (lower) price. The difference between the two prices is known as the bid–ask spread. This difference is a profit to the market maker and a cost to the investor. The spread’s magnitude varies depending on the liquidity of the shares trading. Highly liquid shares have very small bid–ask spreads. ETFs generally have high liquidity. Thus, while ETFs involve trading costs for buying and selling ETFs, these costs are likely to be relatively low.
Proliferation of ETFs. Around 2,000 ETFs currently trade in the United States. Even if you know what index you want to follow, dozens of similar ETFs may be available. Dealing with the number of choices can be overwhelming to some investors.
Tracking error. An ETF may not exactly mimic the returns of the index it tracks. Differences are called tracking error. The source of tracking error tends to come from three factors: costs, cash, and modified holdings. The ETF must buy the shares of stock in the index it mimics, which can incur trading costs that the index itself does not suffer. Additionally, the ETF may have some cash position because of aspects such as the timing of the dividends paid. Finally, some indexes have many stocks that do not contribute much to a value-weighted index. Thus, an ETF may decide to only hold a subset of the firms in the index. Generally, tracking errors are small.
5.16. FOR WHAT ASSET CLASSES AND STRATEGIES CAN INVESTORS USE ETFS?
ETFs are useful for both diversification and engaging in many different types of investment strategies. Below are some examples of the types of ETFs available in the three asset classes of stocks, bonds, and alternative investments. The alternative asset class includes commodities, real estate, currencies, and other investment opportunities. ETFs typically don’t include other alternative investments including hedge funds, private equity, and infrastructure.
Stocks. At least one ETF is likely available for every domestic or foreign stock index. Although the most popular ETFs track the broad indices of the S&P 500 Index and the Nasdaq 100 Index, many other options are available, including
Country-specific, regional, and global indexes.
Emerging markets.
Company size (large cap, mid-cap, small cap, and micro cap).
Growth or value focused.
Economic segments of the economy such as financial, health, and technology.
Individual industries.
“In the ETF world you can be in any sector at any point. You can now invest more like institutions. Prior to this big explosion, retail investors couldn’t invest that way.”
Nadav Baum
Bonds. An ETF as a stock that actually represents a portfolio of bonds may seem odd. But the bond or fixed-income ETFs provide investors with many great opportunities to diversify and receive income. Bond ETFs can index to the following bond types and characteristics.
US Treasuries.
High-grade and high-yield corporates.
Municipal bonds from each state.
Long-term and short-term maturities.
Various foreign government bonds.
Alternative investments. This category is for any ETF that does not belong to the traditional stock and bond categories. Besides commodities, currencies, and real estate, it also includes leveraged stock and inverse positions. Leveraged ETFs try to magnify the index return by using financial leverage, which often means borrowing money to increase the portfolio’s size and using index futures contracts. Inverse ETFs try to earn the opposite return of an index. That is, if the index rises 1%, the inverse ETF NAV would fall 1%. Alternative ETF categories might include the following:
Commodities: precious metals, agricultural products, and energy resources.
Currencies: a single currency and a basket of currencies.
Real estate: broad domestic, foreign, mortgage, and commercial.
Specialty: leveraged, inverse, volatility, and actively managed portfolio.
5.17. HOW CAN YOU USE MUTUAL FUNDS AND ETFS TO ACHIEVE YOUR INVESTMENT GOALS?
You should begin by determining your investment goals. These goals depend on your personal situation such as your risk tolerance, wealth level, age, and income. As discussed in Chapter 4, your financial goals lead to your desired portfolio allocation. Assume that you want to allocate 70% of your investment portfolio to equities, 25% to fixed income, and 5% to cash assets. Let’s look at two scenarios using this allocation scheme.
Scenario A. Martha has little wealth to start but does have a retirement plan through her employer. Chapter 6 discusses the details and wealth-building power of retirement plans. Like most retirement plans, she can invest with a large mutual fund family. Within that fund family she could allocate 70% of her contributions and those of her employer to a stock index fund that tracks the S&P 500 Index and 25% to a bond index fund. If she wants to take a little more risk, she can split the 70% equity investment into 20% to an international stock index fund and 50% to that S&P 500 Index fund. The 5% allocation to cash can be done at a local bank or a money market mutual fund as funds become available.
“I do love ETFs. I’m not a big stock picker, and I think, generally speaking, you do better with an index.”
Ben Stein
Scenario B. José has been fully funding his retirement plans and uses open-end index funds provided by his employer. He now has a substantial amount of cash built up outside his retirement plan. The cash position is much higher than the 5% he wants, so it’s time to invest it in equities. To complement his retirement plan investments, José could buy a small company growth-oriented indexed ETF, a gold ETF, and a real estate ETF.
Many other ways are available to include funds in a portfolio. For example, someone with a high level of income and wealth might use a municipal bond OEF with a focus on her state of residence for a portion of non-retirement plan money to shelter some income from taxes. An investor who stays knowledgeable about the general economy may want to rotate some assets among different sector ETFs. Rotating between investment in the sectors of technology, health, energy, and financial is a form of market timing. Although successfully timing the market leads to higher returns, doing so is difficult and can lead to lower returns from mistiming. Because of their flexibility, you can use mutual funds and ETFs to implement almost any investment strategy. Savvy investors recognize the incredible choices and flexibility of ETF products!
5.18. WHAT ONLINE RESOURCES ARE AVAILABLE FOR MUTUAL FUNDS AND ETFS?
The following are commonly used online resources for finding mutual funds and ETFs.
Morningstar (https://www.morningstar.com/funds.html) provides a hub for mutual fund news, portfolio statistics, analysis, and data.
Yahoo! Finance (https://finance.yahoo.com/mutualfunds and https://finance.yahoo.com/etfs) provides a screener, data, and pricing for mutual funds and ETFs.
Lipper Leaders (http://www.lipperleaders.com/index.aspx) offers mutual fund information, analytical tools, and commentary.
MAXFund (http://www.maxfunds.com/) provides a fund screener that can help identify the most appropriate funds.
Kiplinger (https://www.kiplinger.com/) is known for personal finance advice and provides access to a host of performance, style, and fee information for funds.
ETF.com (http://www.etf.com) offers authoritative news, education, and discussion about ETFs.
ETF Trends (https://www.etftrends.com) offers daily research and commentary on the ETF world.
5.19. TAKEAWAYS
Mutual funds are a popular and important PIV for nearly every investor. In some cases, such as an employer-sponsored retirement plan, you can’t avoid them. Savvy investors can implement nearly any investment strategy with mutual funds and ETFs. Here are some key lessons from this chapter:
Use mutual funds to easily, cheaply, and conveniently diversify.
Avoid paying loads by transacting directly with the mutual fund.
Look for low expense ratio funds.
Utilize indexed mutual funds and avoid actively managed funds.
Match the fund’s investment objectives and strategies to your investment goals.
Compare fund performance between funds of similar strategy or use risk-adjusted performance measures.
Buy ETFs through low- or no-commission brokers.
Design your overall portfolio using mutual funds in your retirement plan along with funds and ETFs outside the plan.