CHAPTER IV
HYPERBOLIC, LOGARITHMIC, AND EXPONENTIAL FUNCTIONS
THE trigonometrical functions are called circular functions, because they arise naturally in connection with the geometry of the circle. There are other functions which are associated with the geometry of the hyperbola and may therefore be classified as hyperbolic functions; this name is, however, usually restricted to certain special functions of this group. We use it, in this Chapter, in a general sense.
In developing the argument, we shall make use of geometrical ideas, and especially that of an area bounded by a curve. At a first reading, the reasoning is more easily understood if this method is followed. But it is important to realise that the functions themselves can be regarded as purely analytical and that their properties can be obtained by purely arithmetical arguments. The more abstract line of approach will be followed in the companion volume on Analysis.
The Area-function for the Rectangular Hyperbola. Fig. 31 shows part of the graph of the function y = ![]() ; this equation represents a rectangular hyperbola. We shall confine attention to that part of the curve for which x > 0.
; this equation represents a rectangular hyperbola. We shall confine attention to that part of the curve for which x > 0.
To every positive value of x there corresponds one, and only one, value of y; and, as x increases, y steadily decreases and tends to zero as x increases indefinitely. Further, if x tends down to zero from above, y increases without limit.
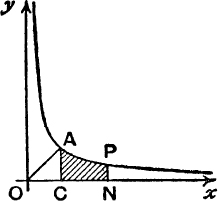
FIG. 31.
The point (1, 1) lies on the curve, and the curve is symmetrical about the line y = x, since, corresponding to any point P,  , on the curve, there is the point P′,
  , also on the curve.
The curve is therefore shaped as in Fig. 31.
Consider the area bounded by the fixed ordinate CA, x = l, the variable ordinate NP, x = t, the curve and the x-axis. This area CNPA, shaded in Fig. 31, is a function of t and will be denoted by the symbol hyp (t).
Expressed as a definite integral,

Approximate values of hyp (t) can be found for given values of t by the ordinary methods of practical geometry, such as counting squares or Simpson’s rule.
It is best to adopt the usual sign conventions of the Integral Calculus for areas, as follows :
If t > 1, that is, if N is to the right of C, the area CNPA is represented by a positive number.
If 0 < t < 1, that is if N lies between O and C, the area CNPA is represented by a negative number.
![]()
If t ≤ 0, we shall not discuss or even define hyp (t).
If t = 1, the shaded area CNPA vanishes ;
![]()
Behaviour of hyp (t) when t increases indefinitely. If, in Fig. 32, P1N1, P2N2, … are the ordinates x = 2, x = 4, … , x = 2k, then
![]()
but this is the sum of the areas
![]()
and is therefore greater than the sum of the areas of the rectangles
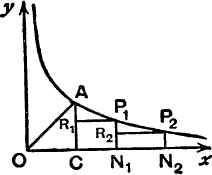
FIG. 32.
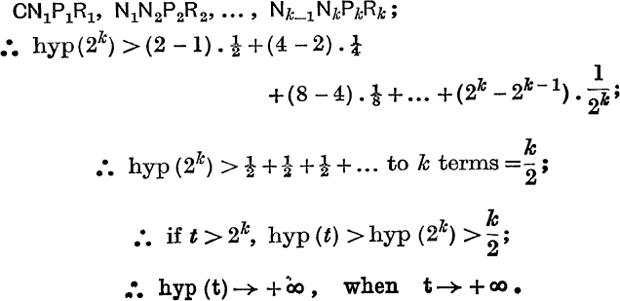
This fact cannot be assumed without proof. For example, if a(t) denotes the area under the curve ![]() from x = l to x = t, we have
from x = l to x = t, we have

∴ α(t) tends to the finite limit 1, when t → ∞.
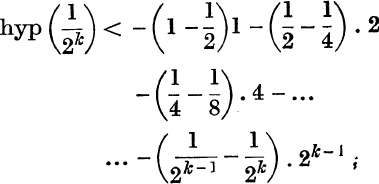
Behaviour of hyp (t) when t tends to 0 from above. Using the same method as before, suppose, in Fig. 33, Q1M1, Q2M2, … are the ordinates  ; and construct the rectangles CAS1M1, M1Q1S2M2, M2Q2S3M3, etc.
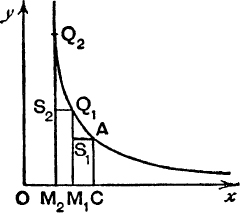
FIG. 33.
Then

EXERCISE IV. a.
1. Find from the graph of y = ![]() , by some method of practical geometry, approximate values of hyp (2), hyp (3), hyp (4), hyp (
, by some method of practical geometry, approximate values of hyp (2), hyp (3), hyp (4), hyp (![]() ).
).
Draw a rough graph of y = hyp (x) from x = ![]() to x = 4.
to x = 4.
2. Use Fig. 34 to show that 0·5 < hyp (2) < 1.
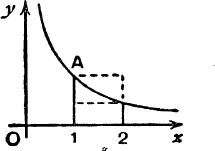
FIG. 34.
3. By drawing the ordinate x = ![]() , show as in No. 2 that
, show as in No. 2 that
![]()
4. Use Fig. 35 to show that hyp (2) lies between ![]() and
and ![]() .
.
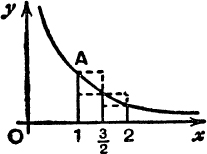
FIG. 35.
5. By drawing the ordinates x = l, x = ![]() , x =
, x = ![]() , show as in No. 4 that –
, show as in No. 4 that – ![]() < hyp (
< hyp (![]() ) < –
) < – ![]()
6. By taking the ordinates x = l, 1·1, 1·2, … 1·9, 2, show that hyp (2) lies between
![]()
Deduce that 0·66 < hyp (2) < 0·72. [Actually, hyp (2) = 0·693… .]
7. Show from a figure that hyp (t1) < hyp (t2), if 0 < t1 < t2.
8. Prove, as on p. 53, that hyp (2k) < k, if k is a positive integer.
9. In Fig. 36, PN is the ordinate x = t of any point on the line y = 2x. If the area of Δ ONP is denoted by sq(t), prove geometrically that (i) sq(2t) = 4sq(t); (ii) sq(t + t′) – sq(t – t′) = 4tt′.
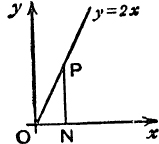
FIG. 36.
What does (ii) become if t = t′, and if t = 0 ?
Interpret geometrically sq( –t).
10. Use geometrical methods to prove that

11. In Fig. 37, PN is the ordinate, x = t, where t > 1. Use the indicated construction to show that 1 – ![]() < hyp (t) < t – 1.
< hyp (t) < t – 1.
12. Draw, in Pig. 37, the ordinate x = s, where s < 1, and by the method of No. 11, show that 1 – ![]() < hyp (s) < s – 1.
< hyp (s) < s – 1.
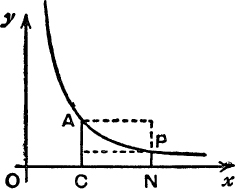
FIG. 37.
13. In Fig. 38, take PN and QM as the ordinates x = t, x = t + h and hence show that ![]() lies between
lies between ![]() and
and ![]() .
.
Is this result true if h is negative, t + h being positive ? What result is obtained by making h tend to 0 ?
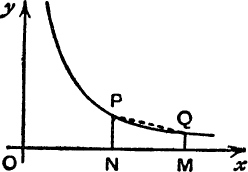
FIG. 38.
14. In Fig. 38, PN, QM are the ordinates, x = p, x = q, for the curve ![]() . Prove that the area of the trapezium PNMQ is
. Prove that the area of the trapezium PNMQ is ![]() .
.
If P′N′, Q′M′ are the ordinates,  , prove that the area of the trapezium P′N′M′Q′ is
  .
.
What relation between the values of hyp (t) and hyp ![]() can be deduced from these results ?
can be deduced from these results ?
15. If, in Fig. 38, PN and QM are the ordinates, x = λp, x = λq, for the curve ![]() , prove that the area of the trapezium PNMQ does not depend on the value of λ.
, prove that the area of the trapezium PNMQ does not depend on the value of λ.
Use this fact to prove that the value of hyp (λt) – hyp (λ) does not depend on the value of λ, and so obtain its value in terms of t.
16. Draw a rough graph of ![]() , marking the lengths of the ordinates at the points P0, P1, P2, P3 whose abscissae are 0, 1, 2, 3. By considering the area under the curve P0P1P2P3, prove that
, marking the lengths of the ordinates at the points P0, P1, P2, P3 whose abscissae are 0, 1, 2, 3. By considering the area under the curve P0P1P2P3, prove that

17. Show that

Deduce that if tan–1t is defined to be  , the function tan–1t increases with t, but remains always less than 2.
18. By considering the area under the parabola y = x2, show that l2 + 22 + 32 + … + n2 lies between ![]() n3 and
n3 and ![]() {(n + l)3 – 1}.
{(n + l)3 – 1}.
19. Prove that
![]()
20. Prove that, if 0 < θ < ![]() , sin θ + sin 2θ + … + sin nθ lies between
, sin θ + sin 2θ + … + sin nθ lies between ![]() .
.
Differentiation of hyp (t). In Fig. 39, if ON = t and ON′ = t + h, we have

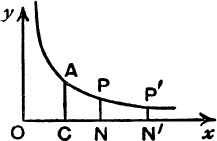
FIG. 39.
But area NN′P′P lies between NN′.NP and NN′. N′P′, i.e. between ![]() and
and ![]() .
.

But ![]() tends to the value
tends to the value ![]() as h tends to 0;
as h tends to 0;

If h is negative, t + h being positive, hyp (t + h) – hyp (t) is negative. ∴ ![]() is positive and still lies between
is positive and still lies between ![]() and
and ![]() .
.
Therefore it tends to the limit ![]() as h tends to 0 in any manner.
as h tends to 0 in any manner.
EXERCISE IV. b.
1. Differentiate with respect to x:
(i) hyp (2x);
(ii) ![]() .
.
(iii) hyp (ax);
(iv) hyp (ax) – hyp (x).
What inference can be drawn from the last result ?
2. Differentiate with respect to x :
(i) hyp (x2);
(ii) hyp (x3);
(iii) hyp (![]() );
);
(iv) hyp (xn).
What inference can be drawn from the last result ?
3. Differentiate with respect to x:
![]()
4. Differentiate with respect to x:
(i) hyp (sin x);
(ii) hyp (tan x);
(iii) hyp (cot x).
5. Integrate the following with respect to x, giving the answers as hyp functions.

6. Write down an expression for ![]() {hyp [f(x)]}. Use the result to integrate with respect to x:
{hyp [f(x)]}. Use the result to integrate with respect to x:

7. What is  Hence find
 ![]() .
.
8. What is ![]() {x hyp (x)} ? Hence find
{x hyp (x)} ? Hence find ![]() .
.
9. What is the sign of ![]() {hyp (x)} ? What inference can be drawn from the result ?
{hyp (x)} ? What inference can be drawn from the result ?
10. What is the sign of ![]() {x – 1 – hyp(x)}, (i) if x > 1, (ii) if 0 < x < 1. Use the result to prove that hyp (x)< x – 1 for x > 0, x ≠ 1.
{x – 1 – hyp(x)}, (i) if x > 1, (ii) if 0 < x < 1. Use the result to prove that hyp (x)< x – 1 for x > 0, x ≠ 1.
11. If ![]() , show by the method of p. 57, that
, show by the method of p. 57, that
![]()
12. By the substitution ![]() show that
show that  , and deduce that tan –1 t + tan–1
 ![]() is independent of t.
is independent of t.
Other Properties of hyp (t). The following properties have all been illustrated in the previous examples.
To prove

By definition,

Put ![]() , so that z = t when x =
, so that z = t when x = ![]() , and z = l when x = 1; also
, and z = l when x = 1; also
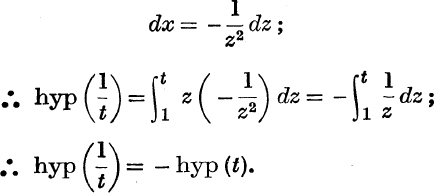
This result may be illustrated geometrically.
In Fig. 40, OC = OC′ = 1, ON = ON′ = t, NP, N′P′ are perpendiculars to Ox, Oy and P′K is perpendicular to Ox, so that ![]() .
.
Since the curve is symmetrical about OA, the areas bounded by ON′P′AC and ONPAC′ are equal.
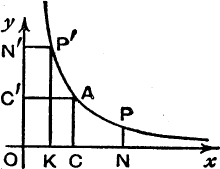
FIG. 40.
But OKP′N′ and OCAC′ are each of unit area; therefore the remainders, the areas KCAP′ and CNPA, are equal.
But these areas are – hyp (![]() ) and hyp (t) respectively.
) and hyp (t) respectively.
An alternative geometrical method is indicated in Ex. IV. a, No. 14.
![]()

Since

where c is a constant;

∴ the value of hyp (ct) – hyp (t) does not depend on the value of t and is therefore equal to the value obtained by putting t = 1;
![]()
Putting c = a, t = b, we have hyp (ab) = hyp (a) + hyp (b).
Putting c = ![]() we have hyp (
we have hyp (![]() ) = hyp (a) – hyp (b).
) = hyp (a) – hyp (b).
It should be noted that the result in (8) really contains those in (5), (6), andd (7).
Relation (6) may be illustrated geometrically.
If, in Fig. 41, NP, MQ are the ordinates x = p, x = q, and if N′P′, M′Q′ are the ordinates x = bp, x = bq, then the trapeziums P′N′M′Q′, PNMQ are equal in area.
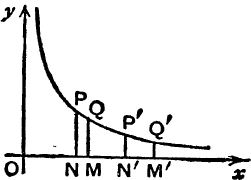
FIG. 41.
For, trapezium P′N′M′Q′
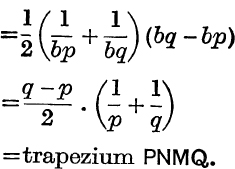
Now draw a large number of ordinates between x = l and x = a, and take, as above, the corresponding ordinates between x = b and x = ba, (see Fig. 42). We then obtain corresponding pairs of trapeziums of equal area.
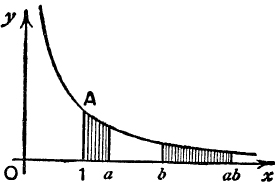
FIG. 42.
If we allow the number of ordinates to increase indefinitely and the width of each trapezium to tend to zero, we see that, in the limit, the area under the curve from x = l to x = a is equal to the area under the curve from x = b to x = ba;
![]()
This geometrical illustration corresponds to the analytical method indicated in Ex. IV. c, No. 7.
To Prove
![]()
where n is any rational number.
If n is any positive integer, we have, by repeated applications of (6),
![]()
Putting a1 = a2 = … = an = a, this becomes
![]()
It is now possible to show by a similar argument that this result is true if n is any rational number; see Ex. IV. c, No. 9. Relation (9) may, however, be proved in a different way, as follows :
By definition,

Put x = yn, so that y = a when x = an and y = 1 when x = 1; also

EXERCISE IV. c.
1. Given that hyp (2)![]() 0·693 and hyp (3)
0·693 and hyp (3)![]() 1·099, find approximate values of hyp(x) for x = 49 6, 8, 9,
1·099, find approximate values of hyp(x) for x = 49 6, 8, 9, ![]() .
.
Draw on squared paper the graph of hyp(x) from x = 1 to x = 3, and use it to solve hyp(x) = l.
2. Use the data of No. 1 to evaluate :

3. Evaluate ![]() by putting x = ay.
by putting x = ay.
What relation can be deduced from  ?
?
4. Use the method of No. 3 to prove that
![]()
5. Prove that hyp(2n) > ![]() by applying the substitution x = yn to
by applying the substitution x = yn to ![]() .
.
6. Use the method of No. 5 to prove that hyp(2n) < n.
7. By using a suitable substitution, prove that
![]()
What is the geometrical meaning of this relation ? What property of hyp (t) is obtained from the relation ?
8. Prove that ![]() , where x > 1 and [x] denotes the greatest integer not greater than x.
, where x > 1 and [x] denotes the greatest integer not greater than x.
Deduce that hyp (x) tends to + ∞ when x tends to + ∞.
9. Use the fact that hyp(an) = n hyp(a) if n is a positive integer, to prove that  , where p, q are positive integers [put a = bq]. Prove also that
  .
.
10. Use the relation

to prove that ![]() < hyp (2n)< n.
< hyp (2n)< n.
11. By considering the area of the trapezium ACNP in Fig. 40, p. 59, show that  , where k > 0.
12. By using the method of No. 11, prove that

where 0 < k < 1.
The Function hyp (x). We have shown that, as x increases from zero to + ∞ , hyp (x) increases steadily from – ∞ to +∞ and is zero when x = 1. The graph is shown in Fig. 43.
Further, since hyp (x + h) – hyp (x) lies between ![]() and
and  , (see p. 57), it follows that hyp (x) is a continuous function of x and, since everywhere it increases with x, we may conclude that it assumes once, and only once, any given value, as x passes from 0 to + ∞. In particular, there exists a unique value of x, such that hyp (x) = 1. This value is always denoted by e, so that
![]()
The number e is irrational and, moreover, like π, is not algebraic; that is to say, there is no algebraic equation of any degree, having rational coefficients, which has e (or π) for a root. It will be shown later how the value of e can be calculated to any number of places of decimals. For the present, we shall merely point out some limits between which e must lie. Thus from Ex. IV. a, No. 2, hyp (2) < 1 and.hyp (4) = 2 hyp (2) > 1; therefore 2 < e < 4.
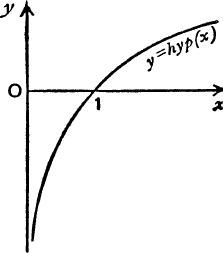
FIG. 43.
Again, from Ex. IV. a, No. 10, hyp (2![]() ) < 1 < hyp (3), therefore e lies between 2
) < 1 < hyp (3), therefore e lies between 2![]() and 3. See also Ex. IV. c, No. 1. Actually, e = 2·71828… .
and 3. See also Ex. IV. c, No. 1. Actually, e = 2·71828… .
The reader has probably solved by this time the mystery of the function hyp (x).
From equations (9), (10), we have, if y is any rational number,
![]()
Therefore, if ey = x, hyp(x) = y; and so ehyp(x) = x.
In other words, the “hyp” of a number is the power to which e must be raised to make that number.
Therefore the “hyp” function is the logarithm of the number to the base e. Logarithms to base e are called natural logarithms or Napierian logarithms.
In mathematical work (as distinct from mere computation) the logarithms which occur are nearly always natural logarithms; and so the symbol logx is generally understood to mean the natural logarithm and is used as an abbreviation for loge x.
The argument, given above, therefore shows that
![]()
and equations (1)-(10) of this chapter may now be re-written in this sense. The most important of these results are
![]()
and

It should be noted that the function log x has been defined for positive values of x only.
The Exponential Function. If y = log x, not only is y determined uniquely when x is given, but for any assigned value of y there is one and only one value of x, and that value of x is positive, since it has been shown that log x increases steadily from – ∞ to + ∞ , as x increases from 0 to + ∞.
Therefore, if y = log x, we may regard x as a function of y and this function is single-valued and everywhere positive. This function might be denoted by hyp–1(y) or by antilog (y), but it is in fact denoted by exp (y), and is called the exponential function of y. We therefore write
![]()
and equation (11) may be expressed in the form
![]()
The graph of x = exp (y) is of course the same as that of y = log x. We therefore obtain the graph of y = exp (x) by interchanging the axes of x and y in Fig. 43, or, equally well, by taking the image of y = log x in the line y = x.
This gives the curve in Fig. 44.
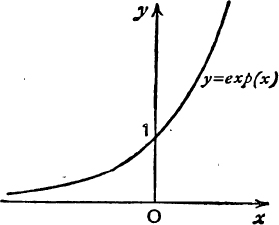
FIG. 44.
If y is any rational number, we have from (9),

A discussion of the theory of irrational numbers is beyond the scope of this volume; we shall not, therefore, at this stage define the function ey for irrational values of y. But it will be found that, when this function has been denned, equation (15) is true also when y is irrational.
Differentiation and Integration. If y = exp (x), then x = log y;
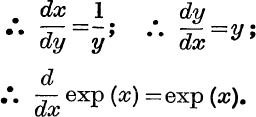
Thus

The function ax, where a > 0, may also be called an exponential function of x, but it is easily expressed as a power of e.
If y = ax, then log y = log (ax) = x log a, a being supposed positive;
![]()
It follows that

Applications to the Calculus. The results of (12) and (16) may be used in conjunction with the ordinary processes of differentiation and integration; and the scope of the Calculus is thus extended to include many functions involving logarithms and exponentials. The most important applications are those of
![]()
Example 1. Integrate tan x.
![]()
therefore it follows that
![]()
Whenever a function can be written in the form  , where the numerator is the differential coefficient of the denominator, the integral can be written down in the form A. log [f(x)].
Example 2. Evaluate ![]() .
.

A very large class of functions can be integrated by the method of the last example, which consists in expressing the integrand as the sum of partial fractions; for the general method of doing this, see p. 231.
The formula for integration by parts will be required in some of the examples in the next exercise. It is
![]()
EXERCISE IV. d.
1. What is the connection between the graphs of
(i) y = x2 and y = ![]() x;
x;
(ii) y = sin x and y = sin–1x ?
2. Sketch the graphs of 2x and e2x.
3. Sketch the graphs of
(i) log x;
(ii) log(2x);
(iii) log(x2);
(iv) log (![]() ).
).
4. What is the value of x, when
(i) log x = 1 + log a;
(ii) log x = l – log b;
(iii) log (log x) = 0; (iv) log (log x) = 1 ?
5. Simplify (i) e2log x; (ii) exlog2; (iii) log(e2x).
6. Prove that if x1 < x2 then ex1 < ex2.
7. Sketch the graphs of
(i) e–x; (ii) ex2; (iii) e–x2; (iv) e![]() .
.
Show graphically that ex = x + a has two roots if a > 1 and no roots if a < 1.
8. Differentiate x log x – x and write down the value of
![]()
9. Differentiate (x – 1) ex and write down the value of ![]() .
.
Differentiate with respect to x :
10. x2 logx.
11. ![]() .
.
12. ![]() .
.
13. eax
14. ex3.
15. e log x.
16. log (cos x).
17. log (sec x).
18. e sin x.
19. etan2x.
20. exp (x sec x).
21. cos (ex).
22. cosec (log x).
23. log(a + bx)n.
24. log (ex + e–x).
25.
![]() .
.
Integrate with respect to x :
26. ![]() .
.
27. ![]() .
.
28. ![]() .
.
29. e3x.
30. ex – e–x.
31. ![]() .
.
32. ![]() .
.
33. ![]() .
.
34.  .
.
35. xex2.
36. cot 3x.
37. ![]()
38. (i) sec x; (ii) cosec x; (iii)  . [See No. 25.1]
Use the method of partial fractions to find :
39. ![]()
40. 
41. 
42. 
43. ![]()
44. 
Use the method of “integration by parts ” to find :
45. ![]()
46. ![]()
47. ![]()
48. ![]()
49. ![]()
50. ![]()
51. Differentiate eax sin bx and eax cos bx, and hence integrate the same two expressions.
52. Find the value of x for which x2 log x is a minimum.
53. Find the maximum value of ![]() , and discuss the number of roots of the equation log x = Ax for different values of A.
, and discuss the number of roots of the equation log x = Ax for different values of A.
Useful Inequalities. The results given in Ex. IV. a, Nos. 11, 12 should be noted. They may be deduced directly from the definition

First, suppose t > l. Then throughout the range of values 1 < x < t, the integrand ![]() is < 1 and is >
is < 1 and is > ![]() ;
;
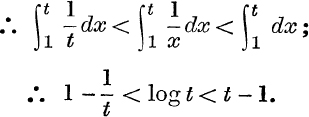
Next, suppose 0 < t < 1 and put ![]() , so that s > 1;
, so that s > 1;
![]()
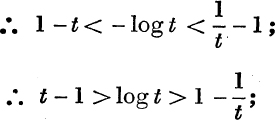
∴ for all positive values of t, except t = 1, we have

Example 3. Prove that  .
.
From equation (18), ![]() < log t < t – 1, if t > 0, t ≠ 1;
< log t < t – 1, if t > 0, t ≠ 1;
∴ if t > 1,
![]()
and if 0 < t < 1,
![]()
∴ if x > 0, x ≠ 1, ![]() lies between
lies between ![]() and 1;
and 1;

Example 4. Prove that
(i) ![]() → 0, when x → ∞;
→ 0, when x → ∞;
(ii) x log x → 0, when x → 0 through positive values.
(i) From equation (18), log t < –l if t > 0, t ≠ 1.
Put

∴ if x > 1,

But when x → ∞, ![]() → 0; ∴
→ 0; ∴  .
.
(ii)  , from (i).
(i)  when t → 0;
(ii) ![]() when n → ∞, for a > 0.
when n → ∞, for a > 0.
(i)  is the value of
  at x = 0 and is therefore e0, = 1. This result can be obtained directly as follows:
from equation (18), with et instead of t,
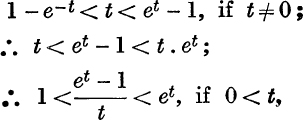
and
![]()
∴ when t tends to 0 in any manner,  .
.
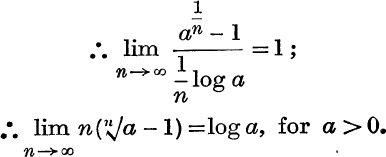
(ii) In (i), put t = ![]() log a, where a is any positive constant.
log a, where a is any positive constant.
Then ![]() . Also when t → 0, n → ∞;
. Also when t → 0, n → ∞;
Example 6. Prove that the function
![]()
decreases when n increases, but that it remains positive.

but equation (18) with 1 + ![]() instead of t, proves that
instead of t, proves that

thus un+1 < un.
Equation (18) also gives

∴ un is positive.
Since un decreases but remains positive, it follows that ![]() exists and is not negative; but the theorem on which this depends is bound up with the theory of irrational numbers, and the discussion of it must be left to the companion volume on Analysis. The limit in the present example is called Euler′s Constant, and it is denoted by γ. Since u1 = 1, it follows that γ < 1; from Ex. IV. e, No. 14, it follows that γ > ·3; the actual value is ·577….
exists and is not negative; but the theorem on which this depends is bound up with the theory of irrational numbers, and the discussion of it must be left to the companion volume on Analysis. The limit in the present example is called Euler′s Constant, and it is denoted by γ. Since u1 = 1, it follows that γ < 1; from Ex. IV. e, No. 14, it follows that γ > ·3; the actual value is ·577….
Example 7. Prove that  .
.
Since ![]() , we may assume that x is positive; also if
, we may assume that x is positive; also if ![]() .
.
Thus, from equation (18), putting sec ![]() for t,
for t,

since sin θ < θ (see E.T., p. 162).
But when n → ∞, sec ![]() → l, and sin
→ l, and sin ![]() → 0,
→ 0,

thus

EXAMPLES IV. e.
1. If 1 < t1 < t2, prove that log t2 – log t1 < ![]() .
.
2. If a and b are positive, prove that log(a + b) – log a > ![]() .
.
3. If 1 + x > 0, and x ≠ 0, prove that
![]()
4. If 0 < x < 1, prove that ![]() .
.
5. Prove that ex ≥ l + x.
6. Prove that ex ≤ ![]() if x < 1. What happens if x > 1 ?
if x < 1. What happens if x > 1 ?
7. If p is positive, prove that  .
.
8. Show that ![]() steadily decreases as x increases from e upwards.
steadily decreases as x increases from e upwards.
9. If n > e, prove that nn+1 > (n + l)n.
10. Prove that  .
.
11. Prove that  , where p is positive.
12. Prove that ![]() , where p and x are positive.
, where p and x are positive.
13. Prove that ![]() increases with n, and that it is always less than unity.
increases with n, and that it is always less than unity.
14. Assuming log 2 = ·69…, deduce from No. 13 that γ > ·3.
15. Find, in terms of γ, the limit of ![]() when n → ∞.
when n → ∞.
16. Evaluate  .
.
17. Evaluate  .
.
18. Prove:  .
.
19. Prove that ![]() tends to a limit when n → ∞.
tends to a limit when n → ∞.
20. If p and n – 1 are positive integers, prove that

and deduce that

where q is a given positive integer.
EASY MISCELLANEOUS EXAMPLES
EXERCISE IV. f.
1. Differentiate log {x + ![]() (x2 – a2)} with respect to x.
(x2 – a2)} with respect to x.
2. Show that  .
.
3. Evaluate  .
.
4. Obtain a relation between ![]() and
and ![]() .
.
5. Find the maximum value of ![]() .
.
6. If y = a cos (log x) + b sin (log x), prove that
![]()
7. If y = ekx satisfies ![]() , find k.
, find k.
8. Prove that y = ae–mx sin (nx + a) satisfies
![]()
9. If y = ex sin x, prove that ![]() .
.
10. If y = xx, prove that ![]() .
.
11. Evaluate ![]() .
.
12. Compare the graphs of log x and log (log x).
13. Prove that ![]() where t > 0.
where t > 0.
14. Napier used the approximation  , where
 ![]() is small, for calculating logarithms. Express this as an approximate formula for log (1 + x) if x4 is negligible. [The error
is small, for calculating logarithms. Express this as an approximate formula for log (1 + x) if x4 is negligible. [The error ![]() .]
.]
15. Prove that  .
.
16. Prove that lim xx = l if x → 0 through positive values.
17. What results can be deduced from log t > 1 – ![]() by changing t into t2 and into
by changing t into t2 and into ![]() , where t > 1. Which of the three inequalities gives most information ?
, where t > 1. Which of the three inequalities gives most information ?
18. If x > 1, prove that ![]() .
.
19. Use the relation  to show that if t is positive, log(l + t) lies between

20. Prove that, if x > 1, ![]() .
.
21. Prove that, if t > 0,

22. If p > q, prove that ![]() .
.
23. Integrate x2ex, and prove that
![]()
24. If t > 0, prove that ![]() lies between
lies between ![]() t3 and
t3 and ![]() t(t – 2).
t(t – 2).
25. If p and t – 1 are positive, use the relation

to prove that  . Deduce that if m is positive,
 ![]() when t → ∞.
when t → ∞.
What result is obtained by putting t = ey? Deduce that ![]() when y → ∞, if r > 0.
when y → ∞, if r > 0.
26. Prove that  .
.
HARDER MISCELLANEOUS EXAMPLES
EXERCISE IV. g.
2. If p is positive, show that 1p + 2p + 3p + … + np lies between

3. Prove that ![]() lies between those values of tan–1 n and
lies between those values of tan–1 n and ![]() which are between 0 and
which are between 0 and ![]() .
.
4. Prove that, if x > 1, (x – 1) (x – 3) – 2x (x – 2) log x is negative.
5. Prove that  is independent of t.
6. If 0 < a < b and c < d < 0, determine whether ![]() or
or ![]() is the greater.
is the greater.
7. If x and y are positive and less than unity, prove that

8. If t is positive, prove that  .
.
9. If x > 1, prove that ![]() .
.
10. If x > 1, prove that ![]() .
.
11. If t is positive, prove that ![]() .
.
12. If x > 1, prove that  .
.
13. Prove that ![]() , if 0 < x < 2.
, if 0 < x < 2.
14. Prove that ![]() where t > 0 and t ≠ 1.
where t > 0 and t ≠ 1.
15. Prove that, as t decreases steadily down towards unity, ![]() increases steadily. Also state this result as a geometrical property of the hyperbola xy = 1.
increases steadily. Also state this result as a geometrical property of the hyperbola xy = 1.
16. By putting ![]() for t in the result of No. 15, show that
for t in the result of No. 15, show that ![]() steadily increases as x increases through positive values.
steadily increases as x increases through positive values.
17. Prove that ![]() , if x >0.
, if x >0.
18. Prove that ![]() , if x > – 1, for some value of θ between 0 and 1.
, if x > – 1, for some value of θ between 0 and 1.
19. Prove that ![]() when x → 0 through positive values, and that
when x → 0 through positive values, and that ![]() when x → + ∞.
when x → + ∞.
20. Prove that  lies between
 ![]() log 2 and
log 2 and ![]() . [See also No. 28.] .
. [See also No. 28.] .
21. Prove that  by taking the range of integration in two parts, from 0 to 1 and 1 to ∞. What result is given by the substitution, x = cy?
22. If  , where n is positive and the existence of the integral is assumed, show by integration by parts that
![]()
and deduce that if (m – 1) is a positive integer Γ (m) = (m – 1)!
23. If ![]() , and assuming that this integral exists if n > –1, prove that f(n + 2) =
, and assuming that this integral exists if n > –1, prove that f(n + 2) = ![]() (n + 1) .f(n).
(n + 1) .f(n).
24. If ![]() , and assuming that this integral exists if m and n are positive, prove that
, and assuming that this integral exists if m and n are positive, prove that

Express B (m + 1, n + 1) in terms of B (m, n).
25. If x > 1, prove that ![]() .
.
26. If 0 < θ ![]() , prove that cosec θ <
, prove that cosec θ < ![]() . Also show that the integrals
. Also show that the integrals  tend to limits when ∈ tends to zero through positive values.
27. Prove that  and hence that each equals
  .
.
Prove also that

Deduce from these results that

28. By using the two transformations, x = tan θ and ![]() and equating the results obtained, prove that
and equating the results obtained, prove that
![]()