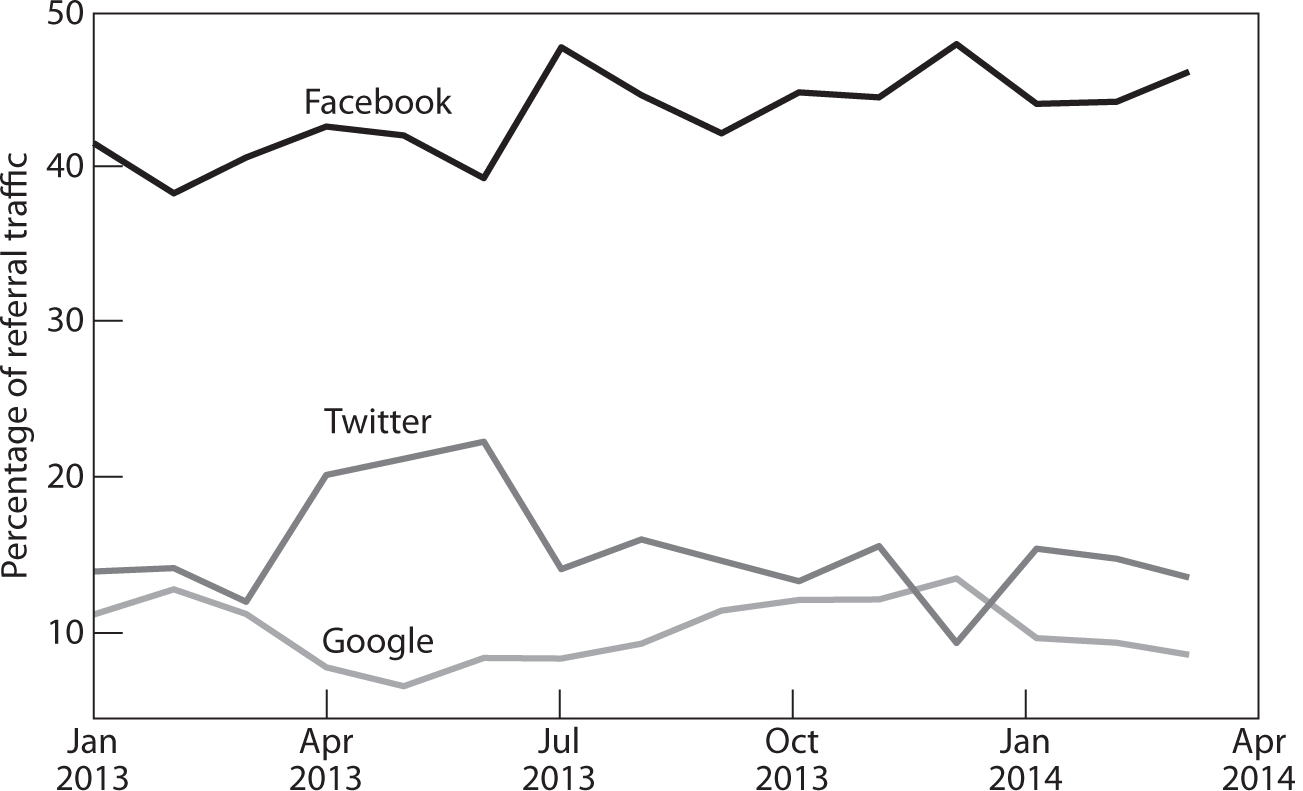
FIGURE 3.1 Sources of traffic to the UK Cabinet Office petition site
Source: Google Analytics data provided by the Government Digital Service.
TURBULENCE
Social media are a source of instability and turbulence in political life. They make possible new forms of political participation, micro-donations of political time and effort that, by the very ease with which they may be undertaken as part of everyday life, draw swathes of new people into the political process. These almost costless acts can scale up to large-scale mobilizations. But because they cost so little, people considering whether to undertake them are likely to be highly susceptible to the influences that social media provide, relative to other influences. They will be at least partially immune to many of the influences that have been shown to sway people’s decision to undertake higher cost acts such as voting, attending a meeting, or participating in a demonstration, such as the weather, lack of time, or transport costs. Online platforms exhibit what other people are doing in real time and make other people aware of what they themselves are doing, creating feedback loops and chain reactions that draw in more people, whose actions in turn are likely to influence others. It seems reasonable to claim that mobilizations formed in this way are vulnerable to the impulses from which they start, which can push them over into critical mass, or cause them to fade and die almost as soon as they appear, making them hard to understand or predict.
As well as creating an environment of instability and uncertainty, social media can also provide the tools with which to understand political mobilization. As citizens increasingly experience and participate in political activities in digital settings, they leave a digital trace of what they have done, which may be collected to generate large datasets. These are large-scale, real-time transactional data of online behaviour, sometimes referred to as big data. This chapter presents some of these data as they relate to collective action. As we discussed in Chapter 1, the recent availability of these kind of data is enabling a shift in social science research, with a move away from the reliance on sample-based survey data (what some people think they did or will do) to transactional data (what people have actually done), often based on whole populations rather than samples. This new source of information offers real potential to understand how people respond to different online platforms. Through the development of computational social science approaches (or social data science), it is possible to analyse the shape of mobilizations over time and to identify the fat-tailed or extreme distributions that tend to characterize human activities in general and particularly Internet-based activity.
In this chapter we test the hypothesis that social media bring instability to political participation. We use data from social media to understand that instability and apply some of the methods used by Salganik et al. to explore inequality and unpredictability in cultural markets for a more political context.1 We analyse data pertaining to Internet-based mobilizations around petitions, generated from three electronic petition platforms in the United Kingdom and the United States: the petition section of the No. 10 Downing Street website (from 2009 to 2011); the current UK petition site, which was developed by the UK Cabinet Office in 2011; and the US petition platform We the People, operated on the main White House website (whitehouse.gov) from 2011. We analyse the growth of petitions and the distinctive characteristics of the mobilization curves of successful and unsuccessful petitions on these three platforms.
First, we provide some background on petitioning as a form of collective action and outline the distinctive features of the three petition platforms we examine here. Second, we outline how we generated data from these platforms. Third, we discuss two key findings from the data: that most petitions fail to take flight and, for the few that do, the number of people who sign the petition on its first day is crucial to ensure it gets airborne. We develop a model of attention decay to understand this rapid decline in signature growth and the overall shape of the mobilizations, finding that they are characterized by short periods of rapid change and long times of stasis, leading to a leptokurtic distribution (i.e., a large number of small changes and a small number of large changes) of the frequency of daily changes, suggesting that online collective activity could contribute to a punctuated pattern of policy change, as defined by Baumgartner and Jones.2 Using a natural experiment from a design change to the UK petitions platform and a range of big data generated from social media and Google analytics, we find that social information exaggerates the success of popular petitions, that this effect is reinforced through social media, and that small changes to the design of the platform can have unanticipated consequences, and we identify a group of aimless petitioners who come to the site looking for petitions to sign. These various sources of instability make it likely that online mobilization around petitions emerges as a driver of turbulence in political systems.
PETITIONING AS TINY ACTS OF POLITICAL PARTICIPATION
Signing petitions has long been one the more popular political activities, leading the field for participatory acts outside voting, and with other social benefits ascribed to it such as the reinforcement of civic mindedness,3 in addition to its potential to bring about policy change. Petitions have a long history, including petitions to sovereigns in medieval times, and petitioning was a popular activity in the United States in the nineteenth century.4 Petitioning online is one of a growing portfolio of Internet-based democratic innovations.5 Both governments and NGOs, such as Avaaz and 38 Degrees, have made widespread use of petitions, for which they have received accolades for their democratic contribution by academic commentators.6 Online petitions that are created and signed on digital platforms are now rapidly replacing paper-based petitions, so although the term ‘e-petitions’ was widely used in the early days of Internet-based petitioning, we use the generic term for the rest of the chapter.
FIGURE 3.1 Sources of traffic to the UK Cabinet Office petition site
Source: Google Analytics data provided by the Government Digital Service.
Petitioning epitomizes the tiny acts of political participation via social media that were discussed in the previous chapter. Although there are start-up costs in getting to know the platform for people who initiate petitions, organizers can find supporters easily, rather than having to canvass them door-to-door or approach people in the street. For those wishing to sign petitions, the search costs are far lower: they may sign a petition instantly on receipt of an email or post on a social networking site, or visit one of the large number of petition platforms and look for a petition to sign, rather than having to wait until they encounter a petition organizer or deliberately look for petition signing activity. Once they have signed a petition, they can share it on almost any social media site with their close ties, their close friends and family, and any number of weaker ties, such as acquaintances met on the Internet, who in turn may disseminate it further. There is clear evidence that petitioners are using social media in this way. Figure 3.1, which is derived from Google analytics data shared with the authors by the UK Government Digital Service, shows that over half of visitors to the UK government petitions site come from Facebook or Twitter, with 45 percent coming from Facebook alone. In this way, petitions are created, disseminated, circulated, and presented online. Although policy makers may discuss responses in offline contexts, their responses are also generated and sent online.
GOVERNMENTS ENTER THE PETITIONS MARKET
The first online petitions platform in the United Kingdom was launched on the No. 10 Downing Street website in November 2006, created by the social enterprise mySociety. Over the course of its lifetime until 4 April 2011, the No. 10 site received more than eight million signatures from over five million unique email addresses.7 Both the No. 10 site and its successor allowed anyone to view petitions, and any user with a valid email address could create a new petition or sign an existing one. For the No. 10 site, prospective petitioners were told that if their petition achieved five hundred signatures, they would receive an official response from the government. There were no other official measures of success, although one petition on road pricing in 2007 did succeed in raising over one million signatures, which research identifies as a possible tipping point for mobilizations; that is, if potential participants know that more than one million people have already participated, they are more likely to participate themselves (as discussed in Chapter 4). The petition was widely regarded as influential in getting the government’s policy reversed. With regard to the visibility of petitioners, this site showed the names of the first five hundred signatories; by default petitions closed twelve months after they first launched.
This No. 10 site was shut down by the incoming Liberal-Conservative coalition government in March 2011. The Cabinet Office launched a new petitions site in August that year, initially on the direct.gov portal (which eventually became the new www.gov.uk portal in the autumn, which has a different format). The new petitions site shows only the name of the petition creator. The site also provides new measures of success of a petition; the point at which the respondents get an official response from government was initially unclear from the site, but the government later clarified that petitions with over ten thousand signatures would receive a response. More importantly, in the early days of the coalition, Prime Minister David Cameron promised that petitions obtaining more than a hundred thousand signatures would generate a parliamentary debate on the issue. In 2012, a change was made to the site to show trending petitions on the homepage—a list of the six most popular petitions in terms of signatures within the past hour, with updates every hour.
The US petition platform We the People is hosted on the main White House website (whitehouse.gov) and allows any citizen to create or sign a petition to ask the Obama administration to take action on a range of issues. The platform operates under a different arrangement, with higher bars to entry than in the United Kingdom and a shorter deadline for all petitions. The entry costs are higher, because petitioners must gain 150 signatures in order for their petition to be publicly searchable on the whitehouse.gov site. They are provided with an automatic email that they can forward to their immediate contacts to get started. After a petition is created, it has only thirty days to gain a hundred thousand signatures, the requirement for a White House response. Although the site does not show the trending petitions on the homepage like the current UK government site, it is easy for any user coming to the site to search for a petition, and then click through to the most popular petitions. In the first year since its launch on 22 September 2011, the platform generated 3.4 million signatures from 2.8 million users. The popularity of the facility was illustrated in its first week, when eight thousand petitions were created, racking up more than 600,000 signatures from 375,000 users.8
Other governments have also launched petitions platforms, of which the German one has received the most extensive analysis by political scientists.9 The UK petition platforms have received rather less attention in recent political science research, with the exception of Wright’s and our own work.10 The US petitions platform is relatively new, having been launched in September 2011, and has not received academic attention to date.
GENERATING DATA FROM PETITION PLATFORMS
In the past, petitions left little record other than the pages of signatories and the record about how they were received by those in power. Although such documents may be scanned and analysed to understand some aspects of petition-signing behaviour,11 they contain no information about petitions that failed. Online petitions are different as they leave a digital imprint—the entire transaction history for both successful and unsuccessful mobilizations around petitions. Data like these represent a big shift for social science research into political behaviour, which has traditionally relied on survey, turnout, or census data. They also present a challenge, in that they do not come with demographics attached, nor do we generally know where people have come from (to any one interaction) or where they are going, and it is difficult to match online activities across different platforms. These data however, make it possible to examine the different patterns of growth in mobilization curves and identify the distinctive characteristics of those mobilizations that succeed and those that fail. Such an analysis, using data that have rarely before been available to political science researchers, tells us something about the nature of collective action itself in a digital world.
TABLE 3.1 List of the most successful petitions in the UK Cabinet Office and US White House petition sites as of January 2015
UK |
Petition title |
Signatures |
1 |
Stop the badger cull |
304,254 |
2 |
SOPHIES CHOICE, smear test lowered to 16 |
327,483 |
3 |
Convicted London rioters should loose all benefits |
258,276 |
4 |
“Drop the Health Bill” |
179,466 |
5 |
Reconsider West Coast Mainline franchise decision |
174,578 |
6 |
Stop Holiday companies charging extra in school holidays |
170,929 |
7 |
Full disclosure of all government documents relating to 1989 Hillsborough disaster |
156,218 |
8 |
Return VAT on Air Ambulance fuel payments |
154,662 |
9 |
Stop mass immigration from Bulgarian and Romanians in 2014, when EU restrictions on immigration are relaxed |
153,827 |
10 |
Put Babar Ahmad on trial in the UK |
149,470 |
US |
Petition title |
Signatures |
1 |
Legally recognize Westboro Baptist Church as a hate group |
367,180 |
2 |
Deport Justin Bieber and revoke his green card |
273,968 |
3 |
Democracy crisis in Malaysia: foreign workers were employed for fraud voting in Malaysian General Election |
223,913 |
4 |
Declare Muslim Brotherhood organization as a terrorist group |
213,146 |
5 |
Immediately address the issue of gun control through the introduction of legislation in Congress |
197,073 |
6 |
Support Hong Kong Democracy and Prevent A Second Tiananmen Massacre in Hong Kong |
197,001 |
7 |
Pardon Edward Snowden |
163,602 |
8 |
Mike Brown Law. Requires all state, county, and local police to wear a camera |
154,747 |
9 |
Invest and deport Jasmine Sun who was the main suspect of a famous Thallium poison murder case (victim:Zhu Lin) in China |
151,250 |
10 |
Stop expanding trade with Vietnam at the expense of human rights |
150,945 |
Source: UK and US petition data.
Note: Titles (including use of capital letters and language errors) are shown as in the actual petitions.
To generate the data we analyse and discuss here, we accessed both the UK and US petition platforms over long time periods. We utilized an automated script to access the UK government’s first petition website (petitions.number10.gov.uk) daily from 2 February 2009 until 4 April 2011, when the site closed and no further signatures could be added. Each day, the number of overall signatures to date on each active petition was recorded. In addition, we collected the name, text, launch date, and category of the petition. Overall, 8,326 unique petitions were tracked, representing all publicly available petitions active at any point during the collection period. Initial analysis of these data after the site closed revealed the importance of the first day in the future success of a petition,12 and suggested that more frequent scraping of the data could deliver a more fine-grained analysis. For this reason, when the new petitions site was launched in August 2011, we set the automatic script to scrape it every hour, recording the same details as for the previous site and leading to a dataset of data points for all the petitions (19,789) submitted to the new site between 5 August 2011 and 22 February 2013. We started collecting data in the same manner for the US petition site, but the US administration later started releasing database dumps of all the anonymous activity on the site that made further scraping unnecessary. In Table 3.1 the titles of the most successful petitions during the data collection period on the direct.gov portal and the US petition website are listed.
MOST PETITIONS FAIL QUICKLY
To identify patterns in how petitions grow, the percentage change in new signatures was calculated each day for the first site. Most petitions showed a long period of inactivity prior to their deadline date. In order to consider only the period during which petitions were still actually growing, the data were truncated after a petition’s final signature, removing any final period of ‘zero signature per day’ growth prior to the petition’s deadline. First, we explored the data collected from the first petitions site on the No. 10 Downing Street website, which produced a set of 8,326 unique petitions. The most immediate finding of interest was that 94 percent of them failed to obtain even the modest five hundred signatures required to elicit an official response, the only measurable success indicator for the earlier site.
Nearly all the petitions that succeeded in obtaining five hundred signatures did so quickly, taking a mean time of 8.4 days to reach the threshold, but a median time of only 2 days. In fact, 230 of the 533 successful petitions succeeded in obtaining five hundred signatures on the day they were launched. Only a few petitions took a much longer time to reach the five hundred signature mark: thirty-one petitions (6 percent) succeeded after taking more than thirty days, and only five petitions in our dataset reached the five hundred signature mark after being active more than four months. A logit regression revealed that the proportion of signatures received by a petition on its first day is the most important factor explaining its success, and a linear regression showed that it was also the most important factor in explaining the total number of signatures received by a petition during its lifetime.13 All other factors tested—the topic of the petition, the day of the week on which the petition was launched (or simply whether it was a weekday or a weekend)—had no significant effect on the growth of a petition once controlling for the number of signatures it received on its first day.
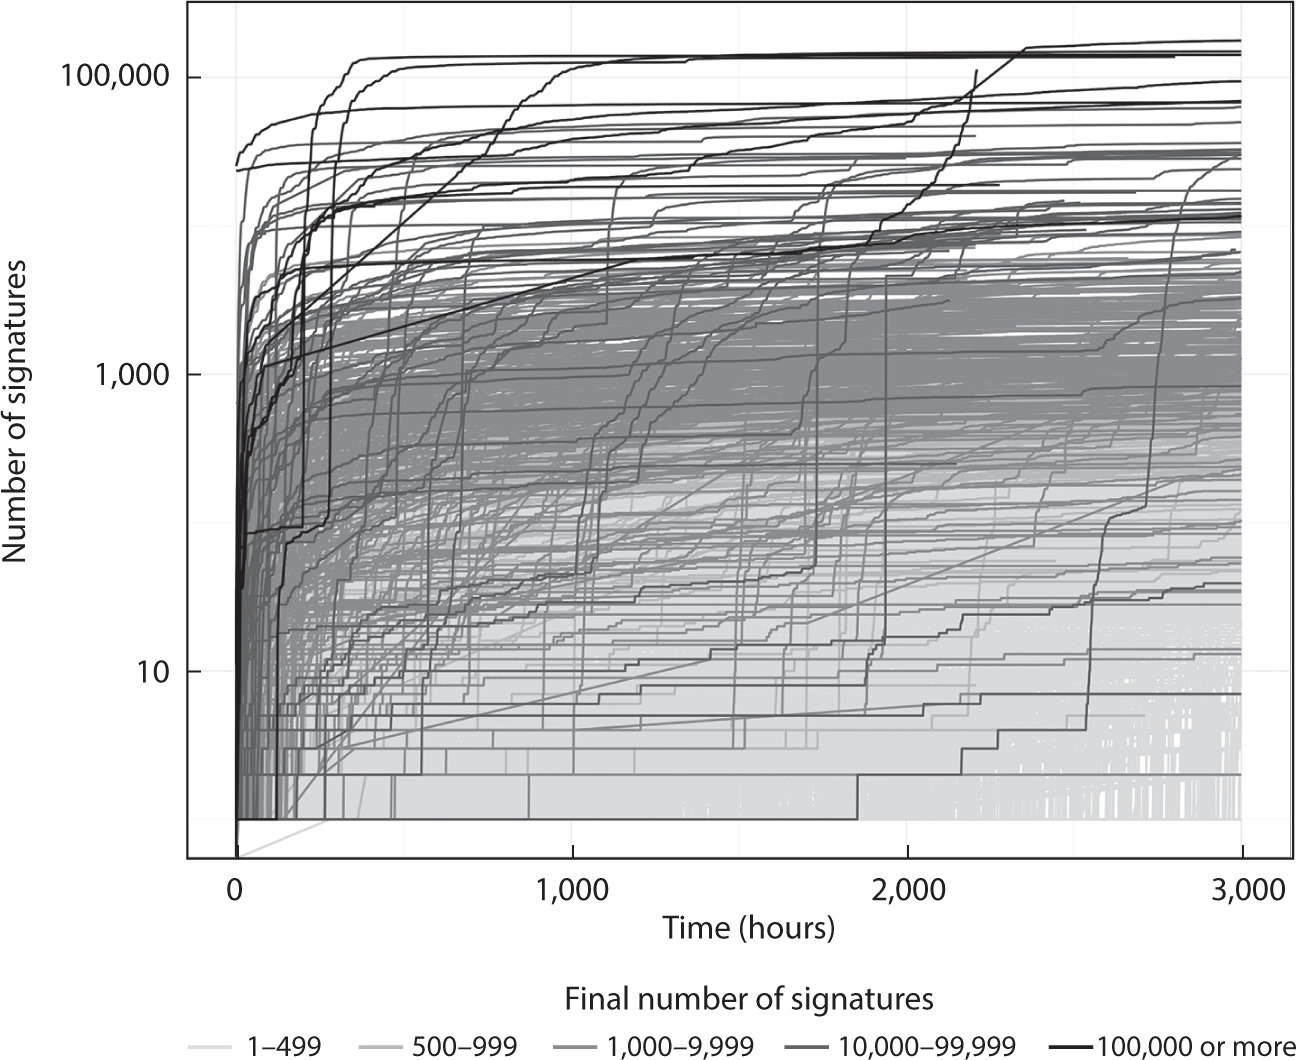
The identification of the first day as crucial for the success of a petition led us to reexamine our data collection techniques as we took the data harvesting and analysis forward with the new site that opened in the summer of 2011. That is, the mobilization on this first day was so rapid that daily scraping of the site could not provide a fine-grained analysis of potential tipping points. Therefore, as noted above, when we collected data from the new site we obtained 19,789 petitions up to February 2013. For these data, Figure 3.2 shows those petitions that attained the first level of success (that is, the ten thousand signatures required for an official response) and those that attained the second level, the hundred thousand signatures required to generate a parliamentary debate.
Once again, it is immediately clear that the vast majority of petitions failed to achieve any measure of success. Only 5 percent of petitions obtained five hundred signatures, which we calculated to compare with the threshold set for the first dataset, and only 4 percent received one thousand. Only 0.7 percent attained the ten thousand signatures required to receive an official response, and 0.1 percent attained the hundred thousand required for a parliamentary debate. As we saw with the first dataset, the first day was crucial to achieving any kind of success. Any petition receiving a hundred thousand signatures after three months needed to have obtained three thousand within the first ten hours on average.
FIGURE 3.2 Petition growth on the UK Cabinet Office petition site, 2011–13
Note: The graph represents 19,789 petitions, created between 5 August 2011 and 22 February 2013. A logarithmic scale is used on the y-axis. The shading indicates the total number of signatures received by each petition at the end of the data collection period. The darkest colour shows the level required for a debate.
The US petitions paint a different picture, in the sense that petitions must pass the 150-signature bar before being eligible to appear on the site, so clearly our data contain no petitions with very few signatures. Of those that remain, then, 89 percent have more than five hundred signatures, suggesting that those that have passed the first bar have enough momentum to proceed. But only 15 percent reach more than ten thousand and only 0.7 percent reach more than one hundred thousand, the official measure of success. The US petitions are shown in Figure 3.3 and demonstrate a much higher density of petitions in the middle range, with a similar number of high successes as for the current UK site, and none of its failures.
FIGURE 3.3 Petition growth on the US petition site, 2011–13
Note: The graph represents 19,789 petitions, created between 5 August 2011 and 22 February 2013. A logarithmic scale is used on the y-axis. The shading indicates the total number of signatures received by each petition at the end of the data collection period.
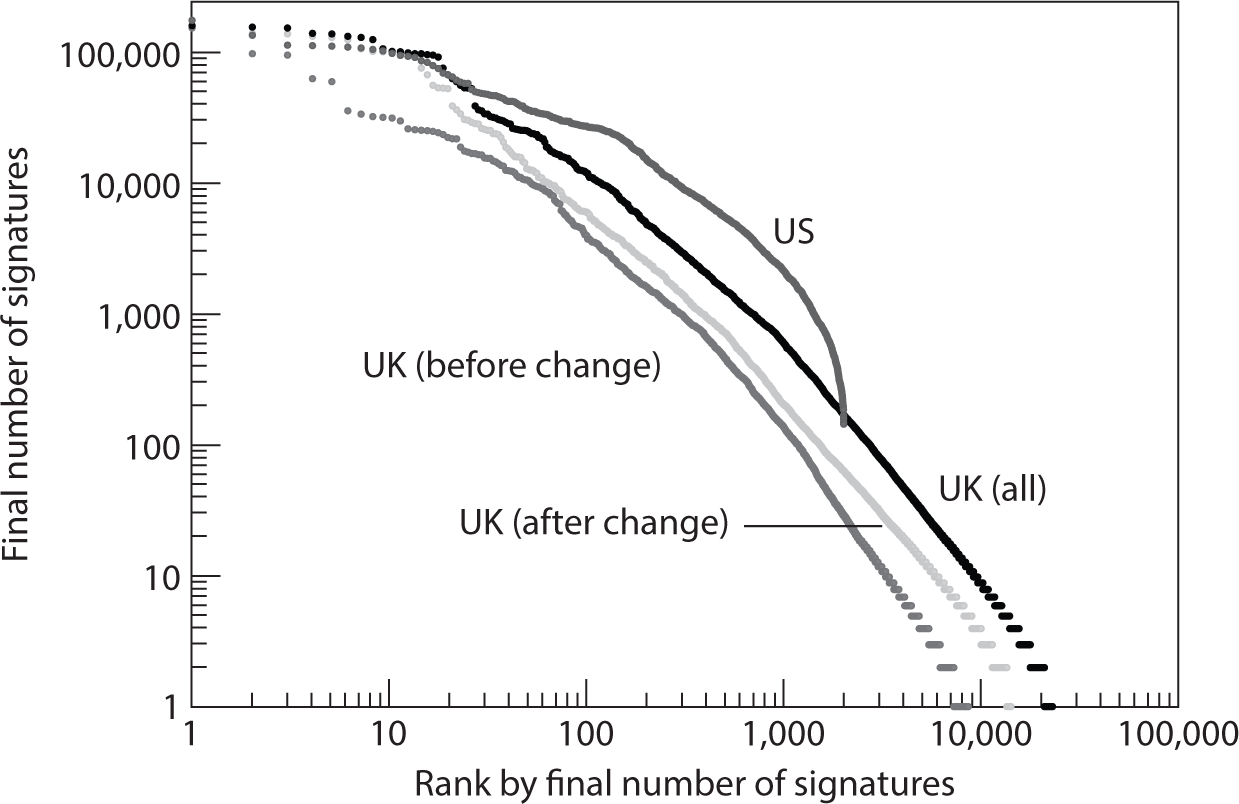
To compare the pattern of petition signatures in the two countries, we removed all the petitions with fewer than 150 signatures from the UK data and calculated the Gini coefficient (a measure of inequality in a distribution) for the two datasets. The Gini coefficient or Gini index for the UK petitions was 0.82, while that for the US distribution was much lower, at 0.70. Basically, by barring the entry of all petitions until they get 150 signatures and imposing a strict deadline on petition life (one month), we have shown that there is less variation between petitions in the US case. Figure 3.4 shows this graphically.
FIGURE 3.4 Comparing the signature distributions of US and UK petitions
Note: The total number of signatures given to each petition is plotted against the rank of the petition among all of them after sorting according to the total number of signatures. The US petitions curve has a slower decrease, indicating that there are more midrange petitions in the US compared to the UK samples.
HOW COLLECTIVE ATTENTION FADES
The results from all three datasets show just how few petitions actually attain success by any measure. For the earlier data from the No. 10 Downing Street site, the five-hundred-signature mark seems at first consideration a very low threshold that should easily be passed. However, by far the majority of petitions (94 percent in this time period) failed to attain even this modest number of signatures, illustrating that in online environments, the low costs of initiating a collective action portend large numbers of unsuccessful mobilizations—though of course we need to be careful making a comparison with the past as we often do not know how many small unsuccessful petitions there were in the period when petitions were done on paper. Petitions are most active when they are first launched, and most petitions (presumably in the lack of support) make no impact after a couple of months despite one-year deadlines on both UK petition sites. Our second UK dataset tells the same story, suggesting that this finding may be generalized to other mobilizations, rather than representing some characteristics of the original No. 10 Downing Street platform. The finding that most mobilizations of this kind fail to take off in any sense chimes well with recent research into the spread or diffusion of initiatives across online networks. As discussed in Chapter 2, Goel et al. analysed the diffusion patterns arising in various online domains, ranging from networked games to micro-blogging services, finding that the vast majority of adoption cascades, whereby attention rises and crosses over to many networks and venues, are small, and are described by a handful of simple ‘tree structures’ that usually terminate within one degree of an initial adopting ‘seed’.14 Even for the few large cascades that they observed, the bulk of adoptions often take place within one connection of a few dominant individuals. Although we have not yet made an attempt to model the network activity behind the petitions studied here, it seems likely that they would reveal a similar pattern.
The pattern of early, rapid growth that we observe consistently across the successful petitions is contrary to what we might expect from formal theoretical analysis of collective action. That is, the function commonly used to describe collective action, mobilization more generally, and other social phenomena such as technology diffusion is an S-shaped curve,15 with a gradual start and buildup, eventually tipping over into critical mass. As with the mobilizations against racist policing in the United States on Twitter and Facebook shown in Chapter 2, we see little sign of this pattern here for those petitions that clearly do attain critical mass.
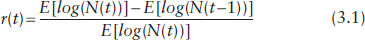
We attempt to capture the characteristic of early rapid growth and decay revealed by the data with a model of collective attention decay, drawing on Wu and Huberman on the novelty of new items in Digg.com, the link-sharing platform.16 In their model, they calculate a novelty parameter relating to the freshness of news items on the platform, but in a more general framework the decay in attention could have reasons other than novelty, for example due to a failure of viral spread. In our model, N agents at time t bring Nμ new agents into the next step on average, with μ being a multiplication factor; in our case, this would mean that every signature brings μ new signatures in the next hour, leading to an exponential growth of rate μ in the number of signatures. This model works quite well at the beginning but decays very quickly as new signatures come at a much lower rate. Therefore we let the multiplication factor decay by introducing a second factor r(t), which atrophies in a way that is intrinsic to each medium; each signature at time t, on average, brings μr(t) new signatures in the next hour. To correct for the early saturation observed in the empirical results, we enter an outreach parameter that can change over time and dampen the fast initial growth. To calculate that empirically, we average over the logarithm of the number of signatures in hourly bins, starting from the launching time, and then calculate the hourly increment at time t and normalize it by the logarithm of the number of signatures up to time t as follows:
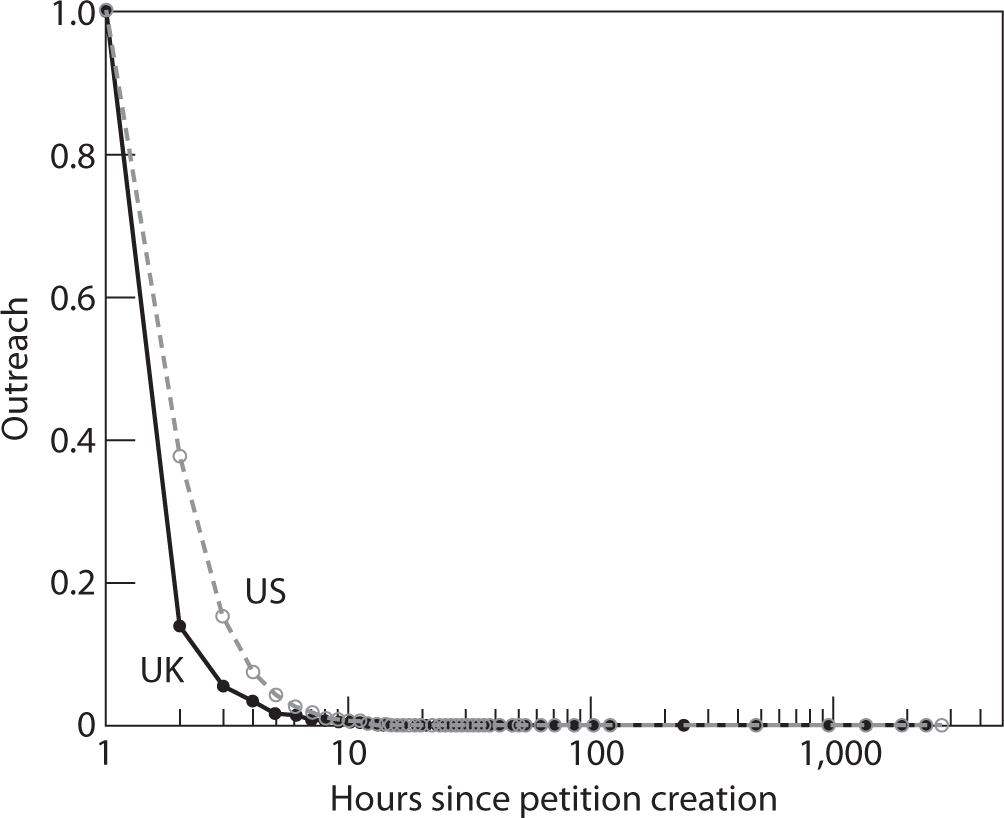
In other words, the outreach factor measures the relative growth of the logarithm of number of signatures within an hour, averaged over the whole sample. This parameter is shown as a function of adjusted time (time from the launch of each petition) in Figure 3.5. This shows that collective attention on petitions decays very fast indeed and that after twenty-four hours a petition’s fate is virtually sealed.
FIGURE 3.5 Time evolution of collective attention paid to petitions
Note: The figure shows how the collective attention to the petitions measured as ‘outreach factor’ based on Equation 3.1 decays in time for the Cabinet Office and the US petition websites. The x-axis uses a logorithmic scale.
PETITIONS AS A SOURCE OF TURBULENCE
Having identified the crucial importance of the early stages of a petition, we went on to examine other factors that affect the shape of mobilization curves. A possible hypothesis may be derived from previous research on agenda setting in political systems. The best-known model of how policy attention develops in a liberal democracy is punctuated equilibrium, developed by the American academics Frank Baumgartner and Bryan Jones (whose work was discussed earlier in this book) and then tested in the Policy Agendas Project (www.policyagendas.org), a research programme on US politics and institutions, and also replicated in the Comparative Policy Agendas Project (www.comparativeagendas.org).
The model implies that policy attention to any issue will be characterized by long periods of stasis during which little change occurs. When issues do eventually hit the policy agenda, it is usually because of positive feedback causing all eyes (including the media, public opinion, interest groups, and politicians concerned) to turn to the issue, resulting in money being spent, institutions being created, and policy change occurring.17 As a result of these processes, political attention punctuates. The punctuated equilibrium model occurs in many contexts and venues, and has been illustrated by a range of empirical data across policy areas and within different dimensions of attention, such as public opinion, budgetary change, and congressional attention,18 and in various countries, including the United Kingdom.19 Baumgartner and Jones do not discuss Internet-related activity to any great degree; however, we might hypothesize that the pattern of mobilizations around a petition would proceed in a similar way. For example, a petition that has languished for months (e.g., repressive laws about child protection) might suddenly become massively popular if something external happens, such as the murder of a child, and then is taken up politically. In this way, Internet mobilizations contribute to or even accelerate the same sort of issue expansion that has been observed many times over in agenda-setting research, such as with focusing events that are associated with a change in attitudes and attention. Such a model would predict that the distribution of daily changes in attention would be leptokurtic, that is, with a small number of large changes in the ‘tails’ of the distribution and a large number of much smaller ones in the central ‘hump’. The model would not be normal with random distribution of changes around a median point.
Such a finding could not show any causal effect, as only the activity of petitioners is being analysed here (though tipping points could suggest the broadcast media are important, although it is extremely unlikely that this could take place before substantive amounts of signatures had amassed). It could, however, point towards a role for online mobilization in policy change analogous to that of the media in the agenda-setting analysis, which are ascribed a lurching effect, due to the capacity of the media to parallel process only a small number of issues; at the point at which a punctuation occurs, media attention will tip over from specialist outlets into the mainstream media.
Leptokurtic distributions have a more acute peak close to the median and longer tails than normal distributions. Several tests in combination help to demonstrate that a distribution is leptokurtic.20 One is a test to show whether or not the distribution is normal. The most rigorous test is the Shapiro-Wilk test, which checks whether the points could possibly be drawn randomly from a normal distribution.21 Leptokurtic distributions should reject the Shapiro-Wilk null hypothesis of normality. The Kolmogorov-Smirnov test establishes whether a set of frequencies is normally distributed by focusing on the skewness and kurtosis (i.e., the degree to which the bands of frequencies cluster at the central and extreme points) of a distribution;22 this null hypothesis should be rejected if a distribution is leptokurtic and therefore non-normal. Visualizing the histogram and plotting a log-log plot, which should be nearly a straight line if changes are leptokurtic, provides further evidence of a leptokurtic distribution.
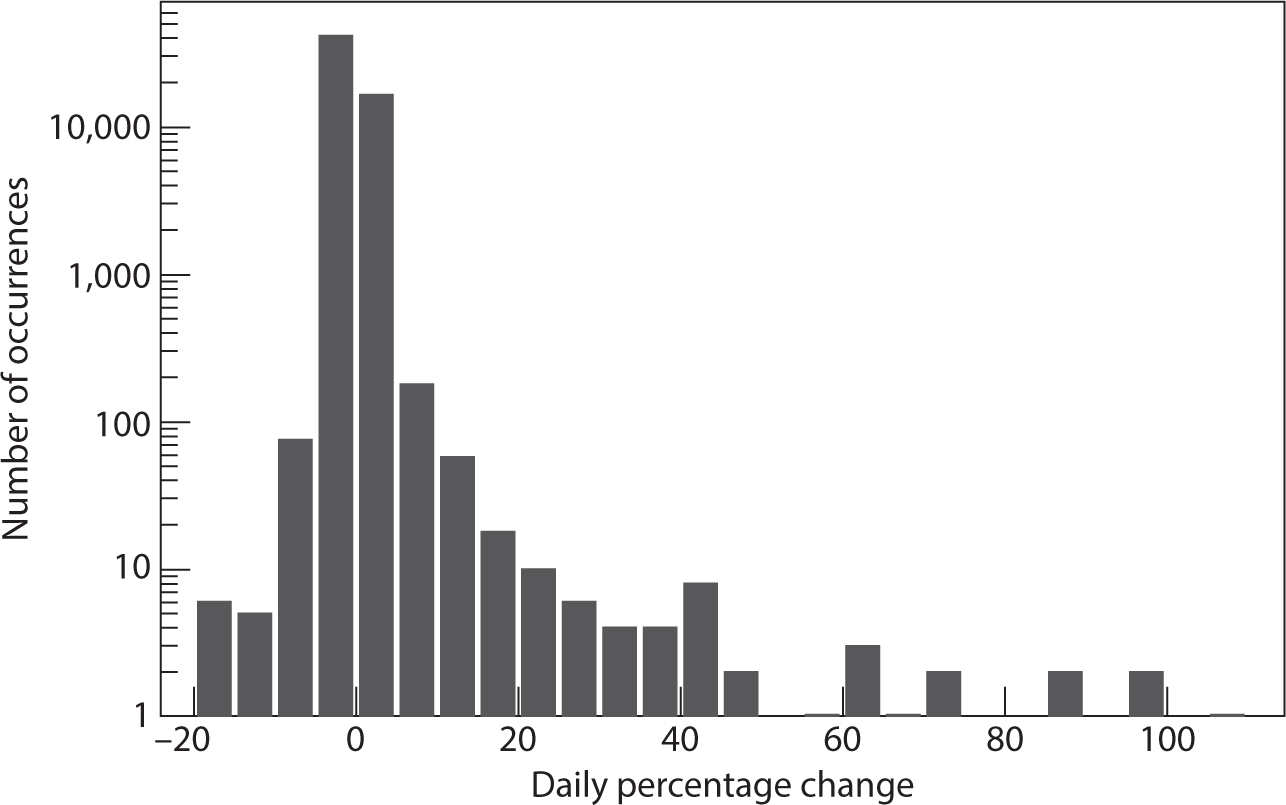
We looked for evidence of leptokurtic distributions in our data harvested from the first UK petitions platform on the No. 10 website, and the results are shown in Figure 3.6. The figure shows the percentage change in new signatures at intervals of 5 percent, adjusted so that the mean growth of each petition lies at zero. While we can see that most daily change is small, petition growth is punctuated by a few large changes. The distribution of growth strongly rejects the Shapiro-Wilk null hypothesis of normality with a w statistic of 0.17, translating to a p-value less than .000001, and also rejects the Kolmogorov-Smirnov test for a normal distribution (p < .0001). The distribution has a kurtosis score of 1,445 (very leptokurtic) and a skewness of 30.53. When we applied the same tests to the population of petitions that were successful in achieving five hundred signatures (that is, when excluding the unsuccessful ones), we found a similar leptokurtic distribution (Shapiro-Wilk w statistic of 0.10, p < .000001).
As we would expect from the earlier section of this chapter, which identified the importance of the first day for the later success of a petition, the largest daily changes happened at the start of petitions’ life cycles. Looking at the distribution of the days on which changes occurred, we see that (for example) all daily changes of more than 80 percent occurred in the first 5 days, and greater than 40 percent in the first 8 days, and even for all changes over 40 percent, the median day is 1, the mean is 2.2, and the third quartile is 1. Petitions tended to grow shortly after their launch and then stop growing. This active period of growth for petitions had a mean length of 57 days and a median length of 27 days.
FIGURE 3.6 Log of daily percentage change in number of signatures, centred around each petition’s mean
Note: Any final periods before the closing dates during which petitions gained no more signatures were removed from the data (i.e., the tallest bars do not include these ‘zero change’ days).
We can see therefore that mobilizations around petitions have a leptokurtic distribution, with short bursts and long periods of stasis. This finding suggests that in online environments, collective action could play a role in a punctuated equilibrium model of policy change. That is, the norm in terms of policy attention is for issues to remain largely dormant or in stasis, with a generally low level of attention. Some issues (by far the minority) that attract attention quickly gain a critical mass of activists and start to vie for policy attention, joining the range of other institutional influences in helping to punctuate the equilibrium. Such an argument would not include the claim that the mechanism by which collective action acts to bring about instability would be the same as the role played by the media, which performs a distinctive lurching function in Jones and Baumgartner’s analysis. In the context studied here, the social media boost would tend to predate media attention, although they could also have a reinforcing effect once a petition did receive media attention.
HOW TWEETS SPUR ON PETITIONS
As shown above, many petitioners arrive at the petitions site via social media, but to what extent does activity on social media fuel petition signing? To investigate the relationship between petition signing and tweeting about petitions, we employ data derived from collecting tweets for two months within the time period in which we collected the UK petition data. For the 481 petitions that were active between April and May 2013, we have 327,430 signatures and 35,540 tweets. We found a fairly clear correlation between these two in terms of attention (the correlation coefficient between the logarithms of the number of signatures to each petition and number of tweets mentioning that petition is 70); the larger the number of signatures, the larger the number of tweets. Of course such data give no indication of causality as it could be that more tweets produce more signatures, or the other way around.
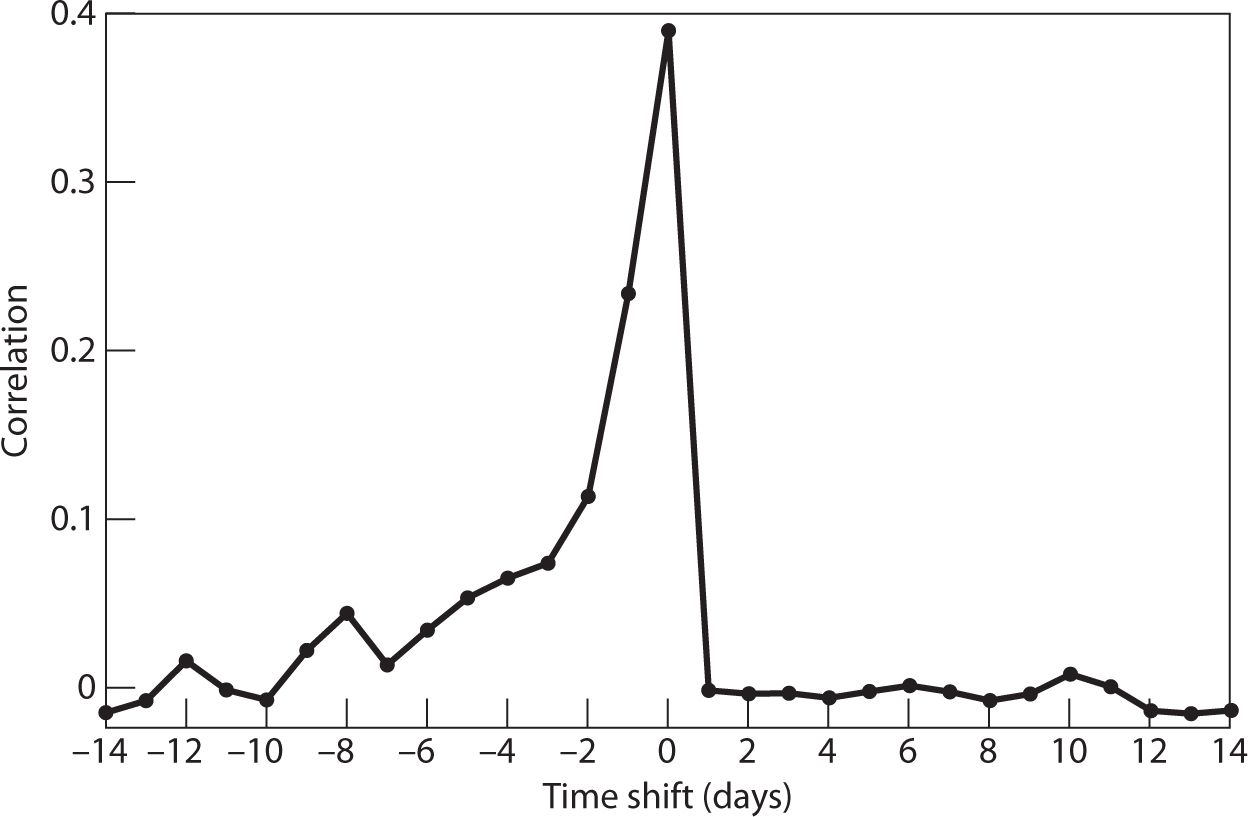
To check the causality, for each petition we created two time series: the number of daily signatures and the number of daily tweets. We carried out a time-shifted cross-correlation analysis, by shifting the tweets time-series by τ days (τ could be positive or negative, resulting in a shifting forwards or backwards in time), and calculated the cross-correlation of the shifted series of tweets to the non-shifted time series of the signatures for each petition. Then we averaged over the whole sample to calculate the correlation, C. Figure 3.7 shows C plotted against τ. The largest value of C happens at τ = 0, meaning that most of the fluctuations in both number of signatures and tweets happened on the same day. However, C drops rapidly for τ > 0 (the tweets series shifted forwards) whereas it drops more slowly for τ < 0 (tweets shifted backwards), meaning that fluctuations in the number of tweets take place before corresponding fluctuations of the number of signatures, suggesting that the tweets are driving signatures and not the other way around. A content analysis of the tweets undertaken by the authors points to the same conclusion, with frequent use of imperative terms and words like ‘please’ and ‘sign’ suggesting the use of twitter for requesting participation rather than simply broadcasting the success of the petition.
FIGURE 3.7 Comparing the timing of signatures and tweets for petitions
Note: The plot shows the value of the time-shifted cross-correlation C against the amount of time shift τ. C decays much slower for negative values of τ, indicating the priority of tweets to signatures in time and possible causalities.
SOCIAL INFORMATION AS A SOURCE OF INSTABILITY
We have shown that most petitions fail, but that those that succeed do so quickly, and that social media seem to reinforce this process. We now turn to other influences on individuals’ decisions to sign petitions. We would expect the strong effect of petitions tending to succeed quickly or not at all to be influenced by the design of the petition website; that is, the outreach factor we have introduced above will vary across platforms, according to the social information that is differentially presented to users about the popularity of petitions. For users starting at the homepage of the earlier No. 10 Downing Street site, it was possible to view petitions overall or within a specific category and to sort petitions by the number of signatures or the date added. It was therefore easiest to look at petitions with the largest or smallest number of signatures and the oldest or newest petitions. On the current Cabinet Office site, petitions can be sorted by signature or closing date, or viewed by government department, but not by topic. On the US We the People site, visitors have always been able to view the most popular petitions, sorted in descending order. In addition, we may expect different behaviours from users who either start from the homepage (who may engage with the available information cues by looking only at the newest or most popular petitions, contributing to the effects we have observed), or who follow links to a specific petition shared via email and social media, which may result in the user encountering different information cues.
These alternative effects on a user’s behaviour due to the differing information environment they encounter can be tested using an experimental approach. As we have already noted, in April 2012, the UK Cabinet Office introduced a change to the petitions site that altered the information environment of prospective petitioners, by introducing a ‘trending petitions’ facility on the homepage, providing potential signatories with a new kind of social information about which petitions were successful and how many other people had signed. We assume that such a change is exogenous to political participation itself, so the time directly before and after the change is as if random. The fact that we captured data from this site both before and after this change provides us with a natural experiment (avoiding ‘bundling’ problems)23 whereby we can test the effect of this change using a variety of methods, including interrupted series and regression discontinuity design.
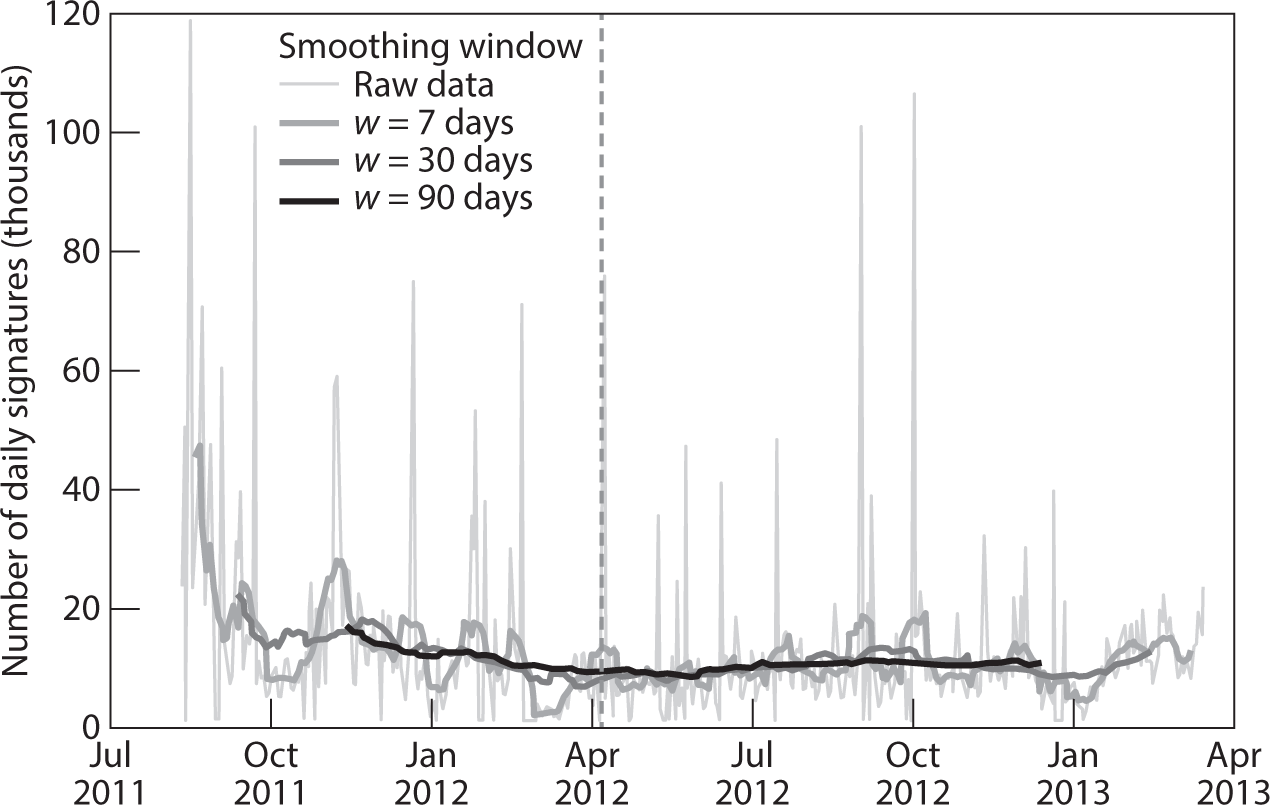
FIGURE 3.8 Aggregate number of daily signatures on the UK Cabinet Office petition platform before and after introduction of the trending petitions facility
Note: Dashed line shows the point of introduction of the trending petitions facility. Data have been smoothed with time windows of widths w.
First of all we tested the hypothesis that the trending facility would increase the overall number of signatures on the site, by attracting visitors to the most popular petitions. We calculated the daily number of signatures to all petitions for a period of twenty-two months, including ten months before the change and twelve months after it (Figure 3.8). We calculated an autoregressive moving-average time series under the null hypothesis that the introduction of trending petitions had no effect on the daily number of signatures, with the smoothing time windows of width w = 7, 30, and 90 days. We found that the change had no significant effect and fail to reject the null hypothesis (Figure 3.8). We can say, therefore, that the introduction of the trending facility on the website had no significant effect at the aggregated level and did not result in higher levels of petition signing overall.
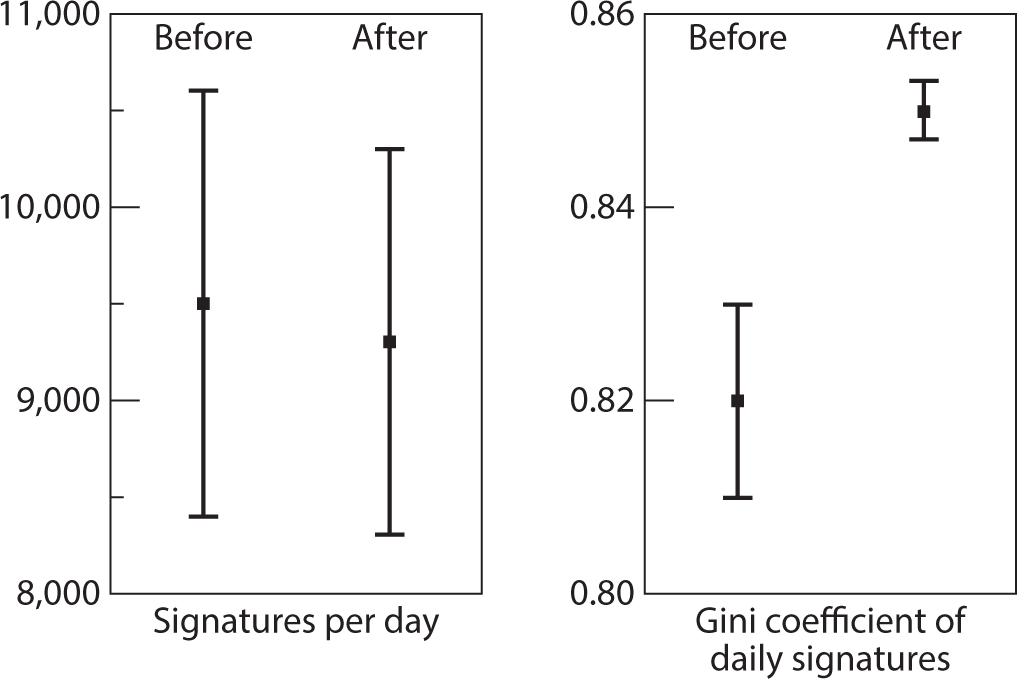
FIGURE 3.9 The effect of a change in design on daily signatures
Note: Left panel: The average number of daily signatures over a three-month period was 9,500 before the addition of the trending petitions facility and 9,300 after the addition, a non-significant difference (p-value = .2). Right panel: After the trending petitions facility was introduced, the Gini coefficient increased significantly from 0.82 to 0.85 (p-value = .002).
If the introduction of the trending petitions facility did not affect the overall number of signatures on the site, did it change the distribution of signatures across petitions? Do the most popular petitions that appear in the trending box become more popular than they would have been had the facility not been introduced? We attempted to answer this question by calculating the Gini coefficient (the measure of inequality in a distribution) for all signatures on all active petitions during a short period, to see whether the distribution had become more unequal. We tested the distribution of signatures over petitions for windows of four days, calculating the Gini coefficient of the distribution within the time window. We then averaged for a period of three months before the change and three months after, and calculated the standard deviations among the four-day windows within each of those two periods. The result of this analysis is shown in Figure 3.9, right panel. It shows clearly that after the trending petitions facility was introduced, the Gini coefficient increased significantly, meaning that there was a different shape to the petition after the change in design (error bars are calculated based on the standard deviation between the Gini coefficients calculated in each time window). The increase in the Gini coefficient indicates that signatures were significantly more concentrated on a small number of petitions after the design change than they were before.
We see that the addition of a trending petitions facility means that trending petitions receive more signatures. Given the fact that the overall number of signatures has not changed significantly, those that do not appear in the trending box receive fewer; that is, the information-rich get richer, and the information-poor get poorer. Such a result provides evidence of the heavy-tailed distributions (sometimes referred to as ‘power laws’) that crop up so often in Internet-based distributions, where social information is available about which online initiatives are popular.
SMALL DESIGN CHANGES HAVE UNINTENDED CONSEQUENCES
We now investigate which petitions benefit most from the ‘rich getting richer’ effect by investigating to what extent petitions in different positions on the homepage were affected. Here there are aspects of the presentation of social information that vary by chance, which have to do with the ordering of when people see how many other people have signed. The UK petition platform shows on its homepage the top six petitions receiving the most signatures in the past hour, with an option to click to see a further six petitions. If there is an impact of social information, there should be a greater impact of petitions at position 6 compared to petitions at position 7, but for all other purposes the differences between those signatures are assumed to be random. The change in the Gini coefficient indicates that the distribution of signatures across petitions has changed. Presumably the trending petitions have captured more signatures at the expense of non-trending petitions. This hypothesis can be tested directly with a regression discontinuity (RD) design, which is where a regression on the outcome using observations around the cut point can estimate the impact of the variable of interest.24
At this point, it is worth saying something in more detail about the design of the petitions site. Trending petitions appear on the homepage in a two-column ranked-ordered list. The petition with the most signatures in the past hour is in the top-left corner of the grid (position 1), while the petition with the second most signatures in the past hour is in the top-right corner of the grid (position 2). Position 3 is in the left column of the second row, position 4 is in the right column of the second row, and so on. The top trending petitions are shown in a two-column, three-row grid with the option to click a link to expose petitions in positions 7 to 12. Each user may sign a petition only once, and users do not know how many others will sign the same petition or another petition. It is therefore not possible for one user to directly control the position at which a petition trends on the homepage (or if it trends at all). The important difference in outcomes is between the ranks, and we can compare the signatures petitions in adjacent positions receive while trending on the homepage.
Our analysis differs from a classic RD design in three ways. First, the number of signatures a petition receives is a discrete variable, so we use the generalization of the RD design for discrete values used in Narayanan et al.25 Second, the position of a petition is determined by the number of signatures in the hour prior to trending, whereas we measure the number of signatures in the hour while trending. We cannot assume complete independence between these values. Finally, we observe trending petitions only once an hour while the list is updated continuously in real time.
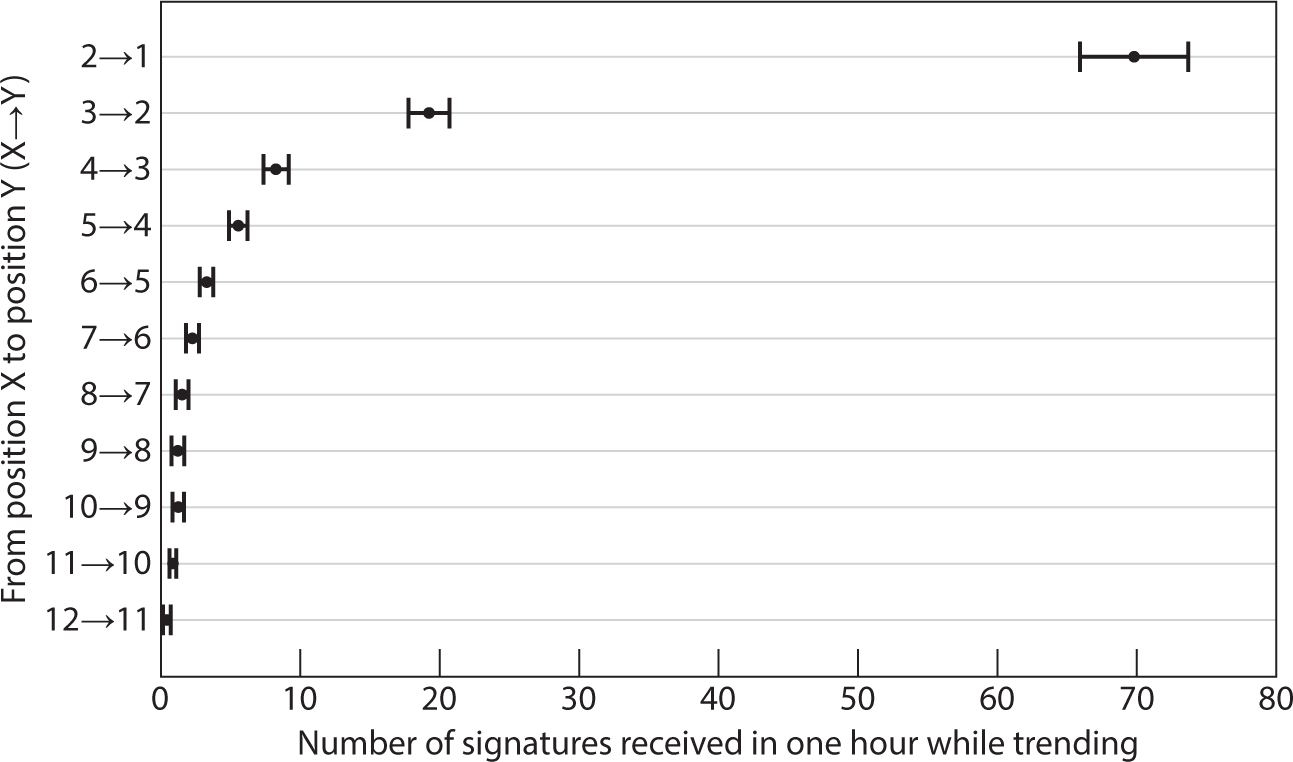
Figure 3.10 shows the difference in the number of signatures petitions in adjacent positions receive while trending. Petitions in position 1, for instance, receive sixty-six to seventy-four more signatures in the hour while trending than petitions trending in position 2. This effect diminishes rapidly for lower positions.
FIGURE 3.10 Comparisons of raw signatures in adjacent positions
Note: The graph shows 95 percent confidence intervals in the difference in the raw number of signatures petitions trending in adjacent positions receive while trending.
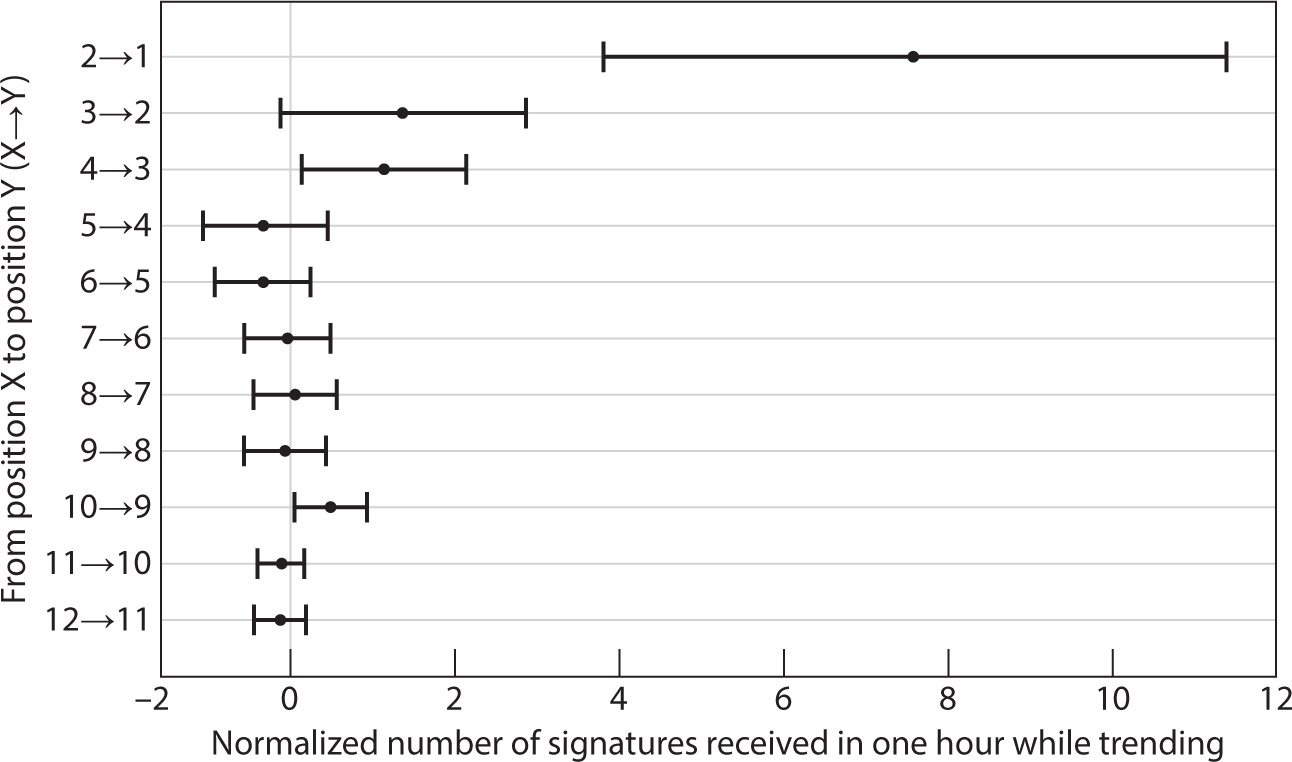
This analysis, however, does not take into account the differences of individual petitions. To control for these differences, we calculate the mean number of signatures for each petition over a number of hours before it trends. Figure 3.11 shows a comparison of the differences from these means for adjacent positions. The means for the figure are calculated over a window of eighteen hours prior to each petition trending. The results are stable for values larger than this.
Within the limitations detailed above, our analysis shows that the trending petitions facility does concentrate attention and signatures on the first few ranked petitions. We find that the petition trending in the first position receives 3.8 to 11.3 more signatures above its mean than the petition trending in the second position. Similarly, a move from position 4 to position 3 is associated with 0.2 to 2.1 more signatures above the petition’s eighteen-hour mean.
FIGURE 3.11 Comparisons of difference from eighteen-hour means in adjacent positions
Note: The graph shows 95 percent confidence intervals in the difference between petitions trending in adjacent positions simultaneously, but first subtracts from each petition its mean number of signatures for the eighteen hours prior to trending in order to control for individual variation of petitions.
The effect quickly dissipates for petitions in lower-ranked positions. So, while the trending facility does concentrate signatures, it does so only for petitions in the first few positions. Strangely, we see significant effects for moving from position 2 to position 1 and from position 4 to position 3, but not for moving from position 2 to position 1. We suspect the two-column layout is responsible for this oddity given the findings of eye-tracking studies with web search results in the field of human-computer interaction.26 Users of search engines usually fixate on the results in the top position and then skim down the left side of the page (at least for users with left-to-right languages). This tendency to skim down the left side of the page means petitions in the left column (positions 1, 3, and 5) may stand out more than petitions in the right column (positions 2, 4, and 6) and likely explains why a move from position 3 to position 2 has no significant effect at a 95 percent confidence level.
Overall, our results provide a unique test for the provision of social information, and we find that the trending petition information concentrates attention to the top few ranked petitions. We expected to find a significant difference between petitions in positions 6 and 7, because position 6 appears in the bottom right of the trending petition information while viewing position 7 requires a further click to ‘see additional trending petitions’. However, attention is so concentrated on the first few positions that we find no significant difference between petitions in positions 6 and 7.
So we have found that the addition of the trending petitions facility causes the most popular trending petitions to receive more signatures, and that these signatures come at the expense of signatures to other petitions on the site. The implications of this result are somewhat surprising. It suggests that some people come to the homepage of the petitions website looking for petitions to sign, or that they come to a specific petition on the site and then move on to the homepage looking for other petitions that interest them. These people have a zero-sum attention capacity: they will sign a certain number of petitions, but this number does not appear to have varied before and after the trending facility was introduced; so, if a particular petition attracts their attention, they will sign that one at the exclusion of another that they otherwise might have signed. It is worth noting that the petitions site lets users sign petitions only one at a time, and users must reenter their details (name, postcode, email address) separately for each petition they wish to sign. This evidence that people are coming to petition sites just to ‘find something to sign’ (rather than coming to sign a petition on a specific issue) suggests a general desire for political engagement—the ‘aimless surfing’ identified by Borge and Cardenal—without a firm view as to what the engagement should be about.27 This group is not completely composed of aimless surfers however, because they know what they want to do, that is, to sign a petition. We might call this group ‘aimless petitioners’, people who want to do a ‘little bit of politics’ and sign a petition, but are not yet sure what about. We investigate their behaviour in more depth in the next section.
FOLLOWING THE ‘AIMLESS PETITIONERS’
In the previous sections, we identified a significant change in the Gini coefficient of signatures per petition, but of a small magnitude (changing from 0.82 to 0.85). The largest possible change in magnitude, however, is limited by the number of visitors to the site exposed to the trending information, which is only on the homepage. In this section, we use site analytics data to understand what percentage of visitors is exposed to the trending information on the homepage. This allows us to compute that the largest possible shift in the Gini coefficient is only 0.04, and thus the 0.03 magnitude shift we observed indicates that a large portion of users exposed to the trending information are affected by it. These are the ‘aimless petitioners’ identified in the previous section.
We cannot match the analytics data (which relate to user visits to the site) with the petitions data (which relate to petition signatories), and in any case do not have the analytics data for the time that the platform was changed (our analytics data are limited to the period of December 2012 to April 2014), but we can use them to examine the behaviour of users of the site who visit the homepage, and therefore see the trending information. To further understand user behaviour on the petitions website, and specifically to characterize the ‘aimless petitioners’, we analysed the behaviour flow of the users through the site, in order to investigate how many users see the trending petitions information on the homepage and from where those users come.28
As noted in Figure 3.1, nearly half of the traffic to the petitions site now comes from Facebook, but these visitors tend to arrive at the site on a page relating to a specific petition. Overall, only about 3.5 percent of all the visits to the website start at the homepage displaying the trending petitions information. If we look at the traffic sources of this 3.5 percent, we observe a very different pattern compared to the overall visits; only 6 percent of this 3.5 percent is sourced from Facebook (equally from mobile and desktop), while Twitter is only responsible for 2 percent of this direct traffic to the front page. About 44 percent of the visits starting at the homepage originated from Google, and 30 percent of them were direct visits (by users who had typed the web address of the petition site directly into their browsers, bookmarked the page, or clicked a link in an email). That many users starting at the homepage come from Google is not surprising, considering that the first search result in Google for the keyword ‘petition’ directs to this page (at least for users in the United Kingdom).
These observations contribute to a picture of aimless petitioners: they either just go to the website directly or look for the petition website in Google, without aiming at a certain petition. Apart from this group who visit the homepage and trending petition information directly, almost 10 percent of all the first clicks within the website (that is, by users who arrived at a page other than the homepage on the site) lead users to the homepage (with the trending petition information). This is followed by 7 percent, 8 percent, and 9 percent of second, third, and fourth interactions of the users with the website. Eventually, a consistent number of site visits at each stage directs to the trending petition information on the homepage. This also includes the users who sign a petition and then visit the homepage. Overall, this led to 2.35 million visits to the homepage (1.40 million unique visitors) out of the 63.6 million page views on the site overall (47.1 million unique page visits) during the period of traffic analysis. There were about 5.9 million visit sessions with at least one interaction with the site content (there were 21.8 million sessions in total, out of which 15.9 million ended without the user clicking on anything), and about 20 percent of all these sessions passed through the homepage at least once during the first ten clicks.
Using these numbers it is possible to estimate the theoretical maximum amount of change in the Gini coefficient of the signatures distribution that we would expect to see due to the social influence. We denote this change Δg, and based on a rough estimation it is straightforward to show that it cannot be larger than 0.04 even if all the visitors who had ever seen the trending petitions were to be affected and signed the top-ranking petitions instead of any other petition that they would have signed otherwise. The amount of actual change in the Gini coefficient that we observed in the signature data is 0.03, indicating that the effects of the local treatment is very strong, although due to the relatively small size of the treatment group (visitors who see the homepage) the overall effect on petitions as a whole is not extremely large (about 3 percent). The maximum value for Δg is limited not only by the relatively small size of the treatment group  , but also by the large starting value of the Gini coefficient even before the introduction of the trending petition information. Since the Gini coefficient was already large even before the trending information was introduced (g0 = 0.82), it is rather unlikely to increase a large amount. If g0 had been smaller before the change in the design, then the effect of the design change could have been even stronger. These results suggest that of the 1.4 million visitors to the homepage during this four-month time period, a significant proportion, around 80 percent, are influenced by the trending information on the site and opt to sign one of the most popular trending petitions. Some of this group may be visitors who had heard about a particular petition and used the trending information to find it quickly, but the high numbers of petitions available on the site at any point suggest that these would be a small proportion. So we can assume that the majority of those who are influenced by the trending information are indeed aimless petitioners, are open to mobilization, and are seeking to be mobilized.
INSTABILITY, AIMLESSNESS, AND UNPREDICTABILITY
We have found a number of sources of instability and turbulence in the process of mobilization around petitions. First, we have found that for petitions, growth tends not to occur, meaning that most mobilizations that are initiated fail. But where success happens, it proceeds in rapid bursts followed by periods of stasis. That is, in terms of this relatively popular collective activity of petition initiation and signing, a vast number of petitions are initiated; most of them fail, and attention tends to die away very quickly indeed. But those that succeed do so rapidly and dramatically, and it would be hard to predict which will succeed. In this way, we argue, online collective action of this kind acts as a source of instability and turbulence on the political environment. As petition platforms become increasingly popular, run not just by national governments but also by civic activism sites at both national and international levels such as the hugely successful petition platform change.org, we can expect the kind of turbulence we observed here to be a common feature of political life. This turbulence is reinforced on social media, where petitioners appeal to other users to sign petitions that they themselves have signed. In the case of Twitter at least, we have found evidence to suggest that these micro-donations on social media do indeed bring other petitioners to sign and spur on the accumulation of signatures for successful petitions.
We have investigated social information as a possible source of this turbulence. Platform designs that show social information about the most popular petitions help them to receive more signatures than one would expect just by virtue of their popularity, and in this zero-sum race for collective attention, those for which there is less evidence of popularity receive fewer signatures than their popularity would indicate, even though their actual signature levels may be very close to those that are shown as trending. In this way we have found the same kind of effects that Salganik et al. observed for cultural markets, where experimental subjects were shown varying information about the popularity of songs and were asked to rank them.29 Subjects were more likely to rate highly those songs for which there was evidence of popularity, meaning that the information injected a source of instability into cultural markets: ‘our results support the hypothesis that social influence, which here is restricted only to information regarding the choices of others, contributes both to inequality and unpredictability in cultural markets’.30 It seems likely that this finding could be generalized to other forms of online collective action, as these kinds of popularity indicators are present in some form by default on most social media. Twitter, for example, displays unique words, phrases, and hashtags that are popular in recent tweets on the main screen of the user, and the ‘Top Tweet’ facility means that the most retweeted tweets produced by the accounts that a user follows are shown at the top of her Twitter feed. On Facebook, any post will show information about the number of likes, shares, and comments it has received, and popular items are shown at the top of the user’s screen; YouTube shows the number of views, likes, and comments for each video, as well as the most popular videos, and so on. All this social information about popularity is likely to have the same kind of reinforcement effect on collective action via social media, reinforcing the popularity of some activities, and detracting from that of others, and increasing the level of instability in political markets for public attention.
The developers of the UK petitions platform did not anticipate that the trending information would significantly influence petition-signing behaviour. In contrast, we have found here that it did indeed have an effect, showing the importance of testing the impact of changes to platform design either in advance or in a natural experiment of this kind. Social information has proved itself influential on how people behave in digital settings, so it is reasonable to assume that if it is changed, then the change will affect behaviour. Our findings with respect to petition positioning on the screen show how quite small design decisions can have a large effect on behaviour, and in this case one that is not encouraging rational behaviour, as people sign petitions based on their positioning on the screen, rather than their popularity. Such findings show the importance of continually monitoring the effect of design alternatives.
For one group, social information seems to have a particularly strong effect. Although the effect size of the natural experiment for the complete population of petition signers was small, we identified a group of ‘aimless petitioners’, who deliberately sought out the homepage of the petitions platform where the information was displayed, knowing that they wanted to sign a petition but uncertain as to which one. For this group, the effect of the information was strong. The finding that some people are keen to participate politically in a generalized (rather than an issue specific) way might be taken as encouraging at a time when so much political commentary bemoans both the time that certain groups (particularly young people) spend online on social media, and growing political disengagement among these groups. We have some modest evidence here that in fact, significant numbers of people are looking for political causes as they go about their lives online. However, their existence also points to a further source of instability in political life, given that they represent a significant group who will be primarily influenced by social information such as peaks in popularity, and may well be influenced by rapidly accelerating trends appearing in social media regardless of issue salience or importance.
We have identified a number of drivers for turbulence in petition signing: the accelerating effect of social information and its reinforcement through social media, the rapid decay of collective attention, the unintended consequences of small design changes, and evidence of aimless petitioners who are particularly influenced by evidence of popularity, or unpopularity. These various sources of instability combine to produce a leptokurtic distribution of daily change in petition signing, with rapid bursts at the start of successful petitions, and long periods of stasis. This finding is no surprise, given the tendency for this type of fat-tailed distribution to emerge in so many areas of Internet-based activity. If online collective action is characterized by punctuations, then such activity could inject more instability into political systems that already have a punctuated pattern of policy making, observed so often in agenda-setting research.31 In the theory of punctuated equilibrium, the media play a key role in encouraging decision makers to shift attention from one issue to another: there is feedback between public opinion and other agenda-setting venues. But the online mobilizations that we have studied here often come about independently of the conventional media, gaining media attention only when they obtain significantly high levels of support. For example, the UK petition on road pricing, which was successful in playing a role in policy change, received a great deal of media attention on reaching one million signatories. Of course, it can work the other way round, whereby attention in the conventional media, such as stories about child abuse or the preservation of sites of natural beauty (e.g., forests), can influence actions taken online. What is important is that these two venues are influencing each other in ways that magnify attention to issues and create large shifts in attention. Research that develops our understanding of the mechanics of this turbulence will be important for scholars and policy makers alike as collective action continues to move into online settings. If mobilizations follow a pattern of very low levels of attention punctuated by occasional spurts that grow rapidly into full-scale mobilizations that merge with other elements of the political system to push policy change on to the agenda and the institutional landscape, then we can expect to see increasing turbulence in contemporary politics, adding to the instability that Baumgartner and Jones and their co-investigators have uncovered so extensively in previous research.32
This chapter has demonstrated the potential for this type of big or large-scale data in political science research. The data we report here were automatically and non-obtrusively scraped to provide a dataset of real-time transactional data of a kind that have rarely before been available to political scientists. Of course, the data we have gathered are not so large in absolute terms and would be considered puny in some natural science disciplines. The point here is that our data represent the whole population of petition signing activity for the two countries in the periods we have studied, rather than a sample thereof, and they are real-time transactional data, rather than a survey of what people think they did or think they might do. The methods we have used here to harvest and analyse the data require skills and expertise and conceptual approaches that span academic disciplines. As large-scale data like these begin to be used more extensively for this kind of research, the ability to work across disciplines in this way will become increasingly important. Big data generated from social media also present possibilities for natural experiments, for example when a change to an online platform is introduced and data are collected before and after the change in order to understand its effects. Research of this kind can be shared with policy makers and inform the design of petition platforms into the future.33
We have identified instability and turbulence in online collective action, and in particular have identified social information about the participation of others as having a reinforcing effect on this turbulence. The natural experiment we describe here presented itself as one way of getting around the inability to make a causal inference in data of this kind. In the chapters that follow, we move on to further experimental work to delve further into the effects of this kind of social information on the propensity of people to participate in mobilizations, analysing the direct effect of different information environments on participation.