4 Austerity’s Role in Economic Performance: The Relationships between Social Reproduction Spending, the Economy, and People1
MARJORIE GRIFFIN COHEN
Introduction
The idea of “expansionary austerity” has had a considerable revival, especially in Canada, since the initial “expansionary” attempts to deal with the Great Recession of 2008–10. The desperation of governments in both Europe and North America, when it almost looked as if the capitalist financial world would collapse, initiated a short-lived inversion of the austerity approach to fiscal policy. In Canada, “austerity” had been widely accepted for the past twenty years as the most sensible approach for government policy in normal times – something that was set aside briefly during the Great Recession of 2008–10.2
Austerity as a permanent feature that would progressively deepen became embedded in public policy in tandem with abandoning the idea that economic crises could or should be prevented. More proactive government policy was based on the idea that when the economy went through periodic crises, the presence of automatic stabilizers could either prevent or mitigate serious economic damage.
This smoothing of economic volatility, as is well known, was associated with Keynesian policy and was originally designed as a counter-cyclical approach to stimulate demand when it was deficient. Over time, the conditions under which Keynesian policy worked relatively well changed, and stagflation soured governments on Keynesian solutions. The most significant change in conditions related to global influences and free trade: as economies became more open, the effectiveness of stimulus spending decreased. The result was that inflationary pressures tended to rise, and these economic factors, combined with the political influence of the corporate sector, shaped a rejection of Keynesian approaches and the popularity of “austerity” – at least for government spending on policies related to social reproduction. Social reproduction includes the activities of both males and females, and the ways that the market, the state, the community, the household, and the individual are involved in meeting the direct needs of people. The state’s role includes activities that directly and universally support the household (medical care, education, pensions, labour regulation, and support), as well as specific programs that are more targeted to meet the needs of specific populations (social assistance, disability aid, employment insurance, pensions, childcare, housing). At various capitalistic stages, each share undertaken by the actors in this process is different, with the state assuming a larger or smaller influence on the social security systems designed to support social reproduction, depending on the time, state of development, and political ideology in ascendance (Cohen 2013, 235).
This chapter examines the impact of austerity policies on economic performance and the effect that reductions in the significance of spending on social reproduction programs have on people and economic outcomes. The question of the impact of austerity on performance arises because of the debate among economists about the economic impacts of “expansionary austerity,” and whether it helps or hinders an economy (Blyth 2013). Generally these studies do not look at the composition of reductions in government spending and instead deal with total spending, even though it would be important to know if the type of government spending and programs that were reduced influenced outcomes. Another influence on understanding the impact of austerity is the recent publication of Capital by Thomas Piketty, and his work on the rise of unequal wealth and income in capitalist countries (Piketty 2014). There is much to say about the significance of this book (a powerful exposé of inequality in capitalism), but in it he does not attempt to correlate any negative economic effects to increasing disparities over time. Rising inequality is bad for people, but he does not show it is bad for the capitalist economy; or rather, he shows that it is bad only because if it becomes bad enough people will rebel.3 That, as we know, is not guaranteed and a very, very long time can lapse before social unrest has economic repercussions.4
This chapter will discuss the shift away from ideas about counter-cyclical social spending as instruments to either prevent or mitigate economic crisis to the sense that “expansionary austerity” can have positive economic consequences. Also explored is whether the inversion of “expansionary austerity” policies will necessarily have positive economic or social results. It seems that there are several possibilities for policy, depending on the findings. One most frequently raised by more progressive economists is that the economic policies of expansionary austerity ultimately are bad for both the economy and people, and that reversing these policies will markedly improve economic performance and help prevent crises in the future. The other is that the neoclassical economists are more or less right and that austerity, especially as it relates to social reproduction, does not have a negative impact on the economy as expressed through long-term performance and ultimately could be beneficial to people as well. Another possibility is that capitalism can tolerate fairly dramatic swings in economic activity so that even if austerity policies are disruptive, there is no need to try to prevent crises – instead, we should manage them as they arise.
The question to test is whether the relative deterioration of public institutions supporting social reproduction has a negative effect on the domestic economies. Clearly there are important immediate implications for people when institutions of social reproduction are cut or minimized, and these cannot be ignored, although the supporters of “austerity” argue that people will be better off in the long run. In contrast, the argument generally from the progressive political spectrum is that austerity is bad policy for people and the economy and is precisely the wrong policy to pursue when there is an economic crisis. Usually when the effect of austerity policy is examined, the focus is on total government spending. This chapter will focus on whether the composition of that spending (such as spending through tax reductions or from social programs) has an impact on economic performance and will use the experiences in Canada to analyse the issue.
Policy/Crisis Nexus
Economic failure prevention was prominent in ideas about the role of the state in the United States and other countries, especially during and after the Second World War. This has changed since the shift towards austerity. Now, the major understanding of the policy/crisis nexus is to devise tools to manage the crisis once it has occurred (Panitch and Gindin 2012). That is, failure containment rather than failure prevention is now consciously the key and the policies – even when expansionary policies are distinctly different and, except for tax cuts, temporary.
In the post–Second World War period, Canada and the United States worked specifically at avoiding the kind of economic disaster that had occurred during the 1930s, which was all-too-painfully familiar and recent. Even more significant was government interest in preventing the long-term problems similar to those that accompanied demilitarization after the First World War. The recession that followed the First World War was widely understood in later years to have been preventable by having an active labour policy that would ensure that returning soldiers were integrated into an expanding economy and by managing fiscal policy prudently, mainly through not demanding budget surpluses too rapidly (Vernon 1919). The almost inevitable rise in unemployment could be lessened, and demand could be stimulated if governments acted to steer the economy.
Attempts to prevent or mitigate the severity of potential crises would require planning, and Canada and the United States gained considerable experience at planning the economy during the Second World War, an exercise that was not abandoned as soon as the war was over. The planning was substantial and extended beyond war work to include activities ranging from industrial to social reproduction aspects of the economy. The planning for social reproduction was new to capitalist economies, at least to the extent that was undertaken during the war itself, but it did become a permanent feature of the system in the immediate post-war period.
Going into the war, capital was about as weak as it had ever been, and this relatively weak capitalist class, which had almost destroyed the system during the Great Depression, strengthened the ability of the institutionalists and Keynesians within governments to shape a new system. These governments recognized that ongoing institutions dealing with a variety of aspects of social reproduction were crucial to economic and political stability and could be engines of growth itself.5 These were powerful tools that made it seem as though the dramatic depressions of the past would be confined to the past and that, with the proper instruments, governments could prevent economic disaster in the future.
In Canada, the significance of government activity on issues related to social reproduction began early in the war itself. As early as December 1939, the government established a Committee on Demobilization and Re-Establishment. The minister of pensions and national health, Ian Mackenzie, led this, indicating the significance of social reproduction to the concept of avoiding economic instability. He was also instrumental in establishing a national unemployment insurance program in 1940 (Canada War Museum n.d.). While a variety of factors led to development of a national social security protection in the post-war period, economic stability was understood to be a major outcome of these developments.
The significance of policy instruments in the neoliberal period is distinct from that associated with the period of Keynesian influence. They are usually confined to two main types of approaches: one relates to the idea of “expansionary austerity” and the other to temporary stimulus to be undertaken primarily when markets fail. This is certainly how “expansion” has been interpreted by both Canada’s Action Plan, and the Obama administration’s 2009 American Recovery and Investment Act. These programs were designed to be typically short-term activities, focusing mainly on so-called shovel-ready projects that do not get embedded into the economic functioning of the system (as would, for example, a national disability, drug, housing, or childcare scheme). In this sense, they have little ability to temper the onset of economic crises in the ways that were characteristic of social institutions that are integral to the system.
Institutions of social reproduction in the past appear to have had important functions for the economy in tempering economic crisis in counter-cyclical ways. Recent analysis of OECD countries indicates that the current focus on unemployment compensation and tax reductions as the primary automatic stabilizers should be expanded. Although usually dismissed as significant aspects of automatic stabilization, other kinds of government spending often respond to business cycles and move together with employment insurance when there is an economic downturn (Darby and Melitz 2007). The most often-discussed expenditures that operate in this way appear to be pension benefits (people tend to retire early during economic downturns), health benefits (sick benefits may be used rather than unemployment benefits), and payments for disability (which tends to increase during economic downturns) (Darby and Melitz 2011). Similarly, government funding for education and housing could also be used to track economic downturns if, as is true in Canada, more people tend to pursue post-secondary education and more people need social housing during an economic crisis. Increasingly, social expenditures have become important for the economy itself, particularly with regard to levels of employment, although public expenditures related to social reproduction are often characterized by neoliberal governments as just items of consumption that are only “paid for” by resource and manufacturing economic activity. However, it is precisely these kinds of activities that tend not to be supported during economic downturns and are increasingly whittled away when the economy is in relative health.
Expansionary Austerity
There is something decidedly contradictory about the term expansionary austerity, and intuitively seems wrong. Yet the argument for “austerity” in government policy, despite its frequent historical failures, has experienced a revival among neoliberal governments since the 1980s.6 This is partially because it is a natural complement to the arguments in favour of free trade and has similar intellectual origins. The underlying idea is that the private corporate sector is best situated to determine the direction of production and distribution of goods and services worldwide – and the less that governments are involved in restricting or competing with these activities, the healthier will be all of the economies of the world.
Deliberately depressing wages and restricting the size and output of the public sector in order to reduce government debt and taxes were theorized to ultimately stimulate growth for two main reasons. One was that the export-oriented economies where this occurred, characterized by low taxes and low government debt, would be seen as more competitive in world markets, and an inflow of investment funding would ensue. This would increase exports and in turn stimulate long-term growth. The other reason for seeing austerity as a stimulus for growth is based on the assumption that people and corporations will think differently about the future when government spending and taxes fall. People will expect to retain a larger proportion of their income in anticipation of lower taxes in the future, so will revise their current and future spending habits, whereas corporations will no longer experience the “crowding-out” that government activity engenders and will increasingly step into the void left by government cuts and expand their production spending. Associated with these actions is the argument that these types of expansions will actually lead to larger government revenues through more taxes as a result of increased economic activity. Generally the theory is that there would be a small contraction period initially, but this is expected to be short-lived, and thus both austerity and economic expansion can be a permanent feature of an economy.
The evidence-based justification that spurred governments towards more aggressive austerity politics in the 1990s came largely from a paper written by Francesco Giavazzi and Marco Pagano, wherein they compared the experiences of Ireland and Denmark and found that “fiscal consolidations” in the 1980s did improve economic performance (Giavazzi and Pagano 1990). This was the first study to critically look at the empirical evidence of whether the Keynesian or German view of fiscal contraction was more appropriate.7 The Keynesian view posited that fiscal contraction would reduce domestic demand, and unemployment would rise and have a dampening effect on the economy. The German view was that fiscal contraction, rather than raising taxes in order to control debt, would have a benign effect on demand and would inspire confidence. Giavazzi and Pagano used the cases of Ireland and the Denmark, primarily because of their very contradictory contexts, to understand the conditions under which fiscal contractions can be expansionary. Their findings were convincing, at least for the short term. Ireland had tried fiscal contraction with disastrous results earlier in the 1980s (supporting the Keynesian conclusion), but on the second attempt it appears to have been successful and turned around the downward spiral. In Ireland, the critical difference in the two time periods was the use of monetary policy and the exchange rate to stimulate domestic demand. In Denmark, cuts to government spending and an increase in taxes did not lead to a decrease in demand, primarily because a dramatic deflation meant households holding the public debt increased their wealth dramatically. Apparently this kept domestic demand from falling, and highlights “the importance of monetary and exchange rate policies that accompanies the fiscal stabilization” (82). What is very clear in this article is that the authors are not arguing that fiscal contractions inevitably can be expansionary, as their example of Ireland in the early 1980s makes clear, but can be expansionary when other policy makes the conditions amenable to this approach. They certainly did not argue that fiscal contraction could be a long-term project for capitalist governments.
A great deal has been written about the success or failure of expansionary austerity and the intent here is not to show the permutations of the arguments of the debate. But one recent example of the case against the positive effects of expansionary austerity is an IMF paper that compares the short-term effects of fiscal consolidation on economic activity in OECD economies (Guajardo, Leigh, Pescatori 2011). The findings from the collective experience of these countries are that the methods used by others to prove that fiscal contraction stimulates demand in the short run (because it relies on cyclically adjusted data) overstated the expansionary effects. Their evidence did not support the expansionary hypothesis and found that fiscal consolidation reduces both real private consumption and GDP within two years. They also found that the decline in both GDP and private consumption is mitigated by a fall in the value of the domestic currency, which gives a rise in net exports. This analysis is in line with that of Giavazzi and Pagano, who see that the economic context, particularly with regard to monetary and exchange rate policies, can offset the austerity measures.
It should be recognized that the justification Giavazzi and Pagano gave for government program cuts was not the tipping point for countries like Canada: the economic directions associated with free trade agreements and the ideological perspectives of the political parties in power certainly supported the downsizing of government, particularly as it relates to reduced taxes on corporations and relative lower spending on social reproduction. These were things, once the trade agreements (CUFTA and NAFTA) were signed, that became the consensus of the corporate sector, government, and media.8
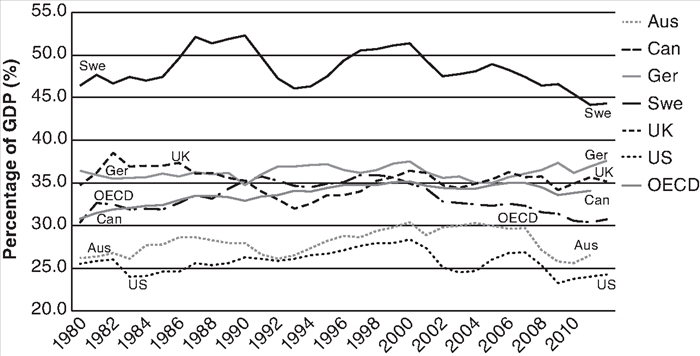
Canada was reported to have performed well under a regime of budget cuts and balanced budgets, restrictive monetary policy focusing solely on inflation, and various wage suppression tactics9 (Blyth 2013b). And most recently, during the 2008–10 economic crisis, its austerity regime was credited for the relative ease with which the country weathered the economic crisis (Barro 2014). But government and business acknowledged the good news about the success of austerity even earlier, in response to Canada’s austerity measures related to the recession of the early 1980s. This was the period when the major tax changes were put into motion, including reductions in the income tax brackets from ten to three; reductions in corporate taxes; tying program financing to 2 per cent below GDP increases; the beginnings of massive privatization initiatives; and the complete withdrawal of the federal government in the shared funding of the Unemployment Insurance program (Cohen 1997). Nevertheless, as figure 4.1 shows, total spending on social programs continued to rise until the early 1990s, something that may have accounted for the success of the “fiscal consolidations” so applauded at the time.
Figure 4.1. Public Social Expenditures as Percentage of GDP (Select Countries)
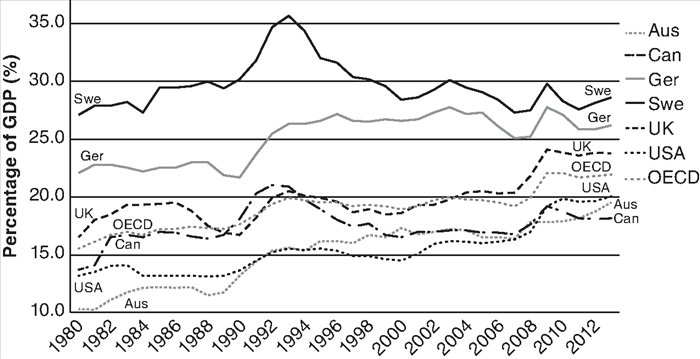
Source:OECD.Stat (2017).
Canada’s Experience with Austerity
As most of the studies examining austerity acknowledge, getting a clear picture of the effect of austerity policies on economic growth is not straightforward. It is rare when austerity policies are taken in isolation from other policies (such as currency devaluation), and the general economic conditions of both the country and the world economy have an impact as well. This means that for very open economies, like Canada and Germany, the impact of currency changes will be large, and for a resource and commodity export–dependent country like Canada the state of international demand will be very significant.
What follows will examine what has happened in Canada since austerity was instituted in a major way in the 1990s. The primary concern is to see if there is a relationship between a relative reduction in government spending, and spending specifically on social reproduction on economic performance. I will also look at the impact of tax reduction on long-term government revenues and on the significance of reductions in compensation to labour and rising inequality.
Public Spending Record
Figure 4.1 shows the standing of six OECD countries and the OECD average from 1980 to 2013 in public social expenditures relative to national income.10 The pattern for most countries is similar, although Canada stands out for the most dramatic changes. In 1980, Canada’s standing was third from the bottom with 13.7 per cent of GDP accounted for by social spending, but this increased dramatically until 1992 when social spending accounted for 21 per cent of the GDP. At this point Canada was third, after Sweden and Germany, in the proportion of national income spent on social programs, and for the first time, Canada’s spending was above the OECD average, a distinction that did not last long. It should be noted that Germany has one of the highest social expenditures to GDP of any country, something that contradicts the idea that Germany is a good example of austerity’s success, since its “austerity” is light compared with other countries. On the other hand, Germany’s total government expenditures are lower than in other countries. Together, these might give an indication of the significance of social expenditures to successfully mitigating economic crises and altogether producing more healthy economic growth.
The decline in social spending for Canada during the 1990s was steep – the steepest of any country. Some of the dramatic decline was a result of structural changes in the way social programs were funded. Most significant was the change from direct spending by the federal government on specific areas within provinces (health, education, social assistance) to transferring programs to provinces that did not specify the nature of program expenditure and that actually amounted to total cuts to dollar amounts (Rice and Prince 2000, 126). But also significant were total federal government program cuts, such as the abolishing of the federal monthly family allowance, the confiscation of Unemployment Insurance surpluses to pay down the debt and the subsequent reduction in insurance coverage for the unemployed, and the provincial roll-back of wages for workers in the public sector, especially in Ontario, the most populous province in the country.
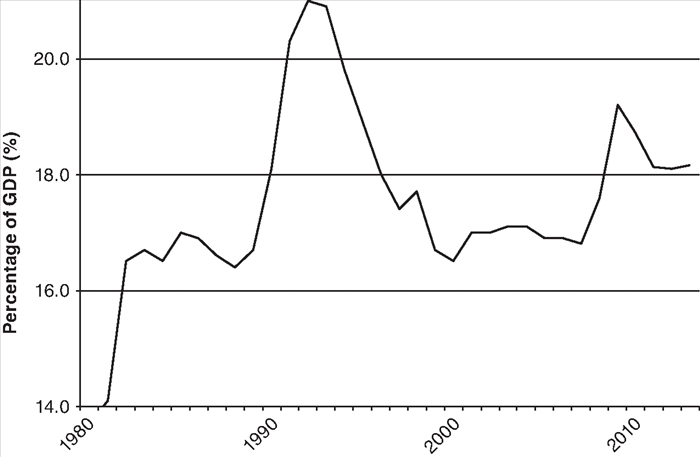
By the end of the Canadian Action Plan, designed to help the country recover from the 2008–10 recession, Canada fell from being third-highest to the bottom of the ranking in social spending as a proportion of GDP for these six OECD countries and was considerably below the OECD average.11Figure 4.2 shows Canada’s record of social expenditures as a percentage of GDP without the comparisons. As a result of the one-off stimulus spending, Canada’s record on social spending did improve after sinking to 16.8 per cent of GDP in 2007, but the spike in the 2008–9 period has levelled off at considerably less (18.1 per cent) than the high point in 1992 at 21 per cent.
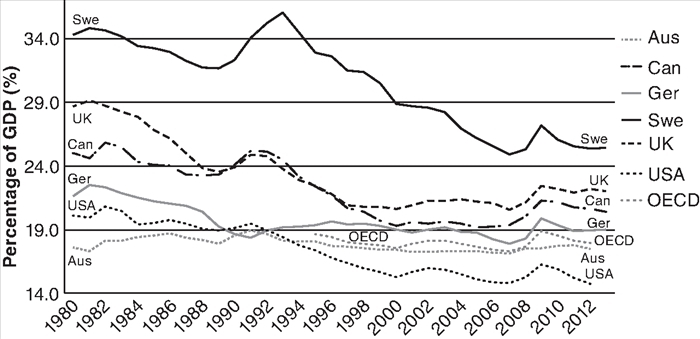
Canada’s record on total government spending is slightly different from its record on social spending, at least relative to that of other countries, in that it has more or less retained its ranking as third-highest among the six OECD countries and considerably higher than the OECD average (see figure 4.3). Like all other countries, total spending as a proportion of GDP in Canada has dropped considerably since the high points in the early 1980 and 1990s. The difference after the effect of the 2009–10 stimulus efforts, in comparison with other countries, shows Canada to be on a downward trajectory again as the federal and provincial governments resume their efforts towards balanced budgets.
The Multiplier Effect
There is a strong likelihood that the decline in social expenditures could affect economic performance. This was indicated as a possibility by the government itself through the published multiplier effect of government stimulus policies during the 2008–10 recession. The multiplier is the reference to the total increase in income from a particular type of increase in spending. A dollar of spending can have fairly little impact if it is spent outside the country (such as buying fighter jets), but a dollar spent within the country related to populations who tend to spend all they earn will have a magnified impact.
The report on the activities of Canada’s Action Plan lists the multiplier effect of various types of stimulus activities, as shown in table 4.1.
Table 4.1. Canadian Expenditure and Tax Multipliers
2009 |
2010 |
|
|---|---|---|
Infrastructure investment |
1.0 |
1.5 |
Housing investment |
1.0 |
1.4 |
Other spending |
0.8 |
1.3 |
Measures for low-income households and the unemployed |
0.8 |
1.5 |
EI premiums |
0.4 |
0.5 |
Personal income tax measures |
0.4 |
0.9 |
Business tax measure |
0.1 |
0.2 |
Source: Department of Finance (2011, table A.1).
These figures are instructive, because it is clear that there are significant differences between money that is foregone because of tax cuts, and money spent on low-income households and the unemployed. The actions having no stimulus effect (and in fact, are actions that withdraw money from the economy) are tax reductions for business, reductions in EI premiums, and personal income tax cuts.
The government explains the very low impact of business tax cuts by saying that while they had little impact on demand over the period under review, over the long run they would have the highest multiplier effects, because they would increase the incentive to invest and accumulate capital, which would lead to greater capacity in the ability to produce goods and services (Canada 2011). This is particularly interesting in the case of Canada’s stimulus program because the largest single item of the program was devoted to tax cuts. The government, in its report on the Action Plan, includes $200 billion in tax reductions on individuals, families, and business from various budgets that give tax relief from 2008 to 2013, in addition to the $46 billion in federal government stimulus that in itself included tax cuts (33).
Tax cuts were the only items in the stimulus plans that were retained as permanent features: all other programs ended in 2011, when the economy was assumed to be on the road to recovery. It should also be noted that at this time the recovery was deemed sufficient so that some of the money on infrastructure was not spent. The expenditures actually having a stimulus effect (increased money for the unemployed and those with limited income, infrastructure spending, and increased housing subsidies) were all short-term measures designed only to deal with the crisis itself. In the case of Employment Insurance benefits, the stimulus package expanded coverage for those unemployed only during the recession, and many of those who would have been eligible for benefits during the recession were not eligible when it was declared over.
Impact of Economic Change through Austerity
Austerity measures in Canada, represented as a percentage of both total social spending and total government spending to GDP, have decreased steadily since the early 1990s and are interrupted only occasionally by stimulus programs (figures 4.1 and 4.3). The stimulus programs are short-term initiatives designed to counter the most devastating effects of economic crisis. The relationship between the effects of declining relative government expenditures is not entirely clear, in that a wide variety of factors contribute to Canada’s declining growth rates. But one major claim of “austerity” theory is that, over time, economic growth will be affected in a positive way. This does not appear to be the trend in Canada.
As figure 4.4 indicates, Canada’s growth rates fluctuate considerably in relatively short periods of time. Figure 4.5 shows the changes a little differently, and while the changes look less dramatic than in figure 4.4, it demonstrates a way to understand trends in volatility. This measures the difference in growth by year. Aside from the dramatic recession in the early 1980s, one can see in figure 4.5 that the changes from year to year appear to be increasing, with the negative changes becoming larger since the 1990s. Certainly nothing definitive about the effects of specific government spending over a long period can be taken from these correlations. But one thing is certain: Canada’s growth rate has been decreasing, especially since 2000, and recovered only in the post-2008–10 recession because of extraordinary government spending on special short-term programs.
Figure 4.4. GDP Growth Rate – Canada
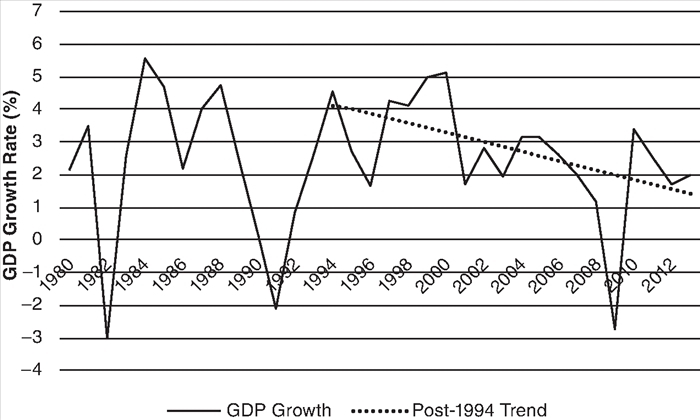
Source: OECD.Stat. National Accounts > Main Aggregates > Gross Domestic Product. Filters: Transaction: GDP (Expenditure Approach); Measure: Growth Rate; Time: 1980–Latest Available.
Figure 4.5. Canadian Growth Volatility
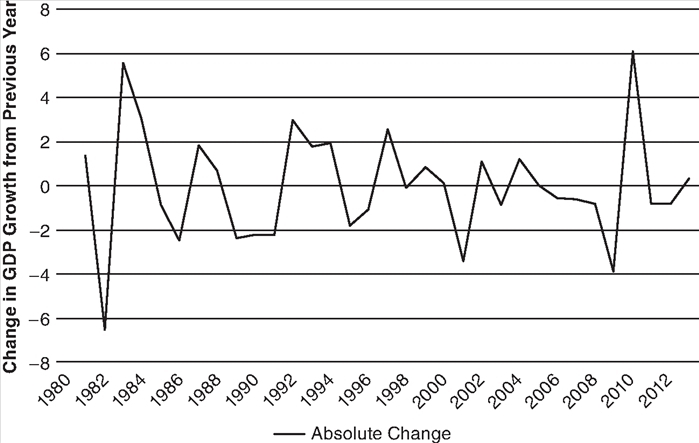
Source: OECD.Stat. Volatility = Change in growth in absolute difference by year. Filters: Transaction: GDP (Expenditure Approach); Measure: Growth Rate; Time: 1980–Latest Available.
Government Social Spending and Inequality
The effect of relative decreases in government spending on social programs appears to be closely related to an increase in gross levels of inequality in Canada. As can be seen in figure 4.6, Canada had relatively low levels of inequality when government social spending relative to GDP was high. This figure measures inequality by using Canada’s Gini coefficient, where 0 indicates a state where everyone would have the same income and 1 is a state when total inequality exists and one person has all income. This figure shows that government social spending is fairly closely correlated to levels of inequality and that inequality decreases only when government social expenditures rise. This did occur during the increased temporary spending in the course of the 2008–10 economic crisis, a period where the level of inequality dropped somewhat. But since this was a temporary occurrence, it is unlikely to be a sustained trend.
Figure 4.6. Canadian Social Expenditure as a Percentage of GDP Compared to Gini Coefficient
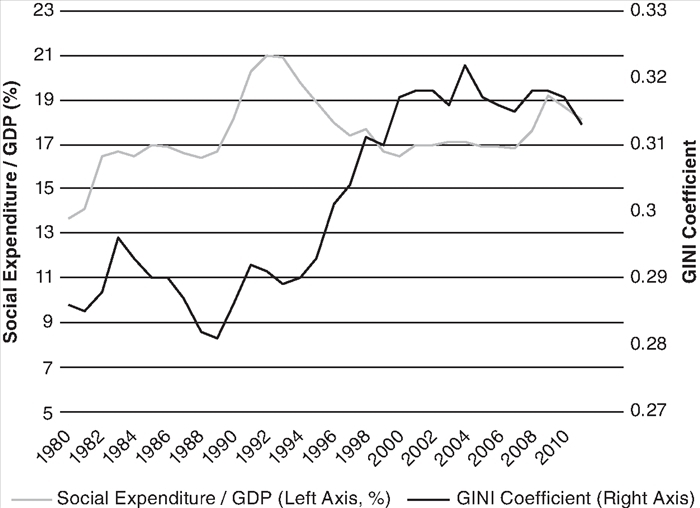
Source:OECD.Stat (2017a); Statistics Canada (2013).
Income inequality increased in Canada considerably between 1995 and 2011. It coincided with the change in provision of social programming with the federal government’s shift of major funding to the provinces. The resulting inequality was primarily because the after-tax income of the top income group rose much more than that of other groups. A rise in inequality is clearly not beneficial for most people, but it may also be harmful for economic performance. In the past, the common economic wisdom was that inequality was necessary in a capitalist economy, because there is a trade-off between economic efficiency and inequality. However, more recently, as a result of an expanded understanding of the nature and effects of inequality, there is a growing sense even among institutions such as the International Monetary Fund that greater levels of equality is important for sustaining growth over a long period. Two reasons in particular relate to Canada’s growth record. One is that inequality itself can accentuate financial crisis, because people at the bottom end of the income scale are forced to borrow more, and that increases over-all financial risk; and the second is that growth can be diminished if people’s skills are not being adequately employed (Berg and Ostry 2011). In Canada, the rate of household borrowing has increased at rapid rates since austerity measures accelerated in the mid-1990s. Also, the rise of low-wage and non-standard employment, despite high education levels, indicates the rise in underemployment.
The rise of inequality that has accompanied austerity in social spending is a clear indication that austerity cannot lead to prosperity for a substantial proportion of the population.
Revenue Effects of Tax Cuts
One significant claim of those advocating government cutbacks and tax reductions is that austerity can eventually lead to not only expansion of the economy, but also increased revenues to government. The argument is that when individuals have more money in their pockets they will spend more, which will have a stimulating effect on the economy. Also, it is assumed that when corporate taxes are cut, corporations will use the money to increase investment. Both actions would increase the national income, and that in turn will result in greater total tax returns.
Tax cuts in Canada have been considerable, and the result can be seen in figure 4.7, which shows tax revenues as a percentage of GDP for select OECD countries. In the 1990s, Canada’s tax revenues were slightly above the OECD average, but the decline was clearly correlated with the tax cuts that occurred since 1996. In 1997 and 1998, revenues from taxes were 36 per cent of GDP and dropped steadily so that in 2012 total taxes were 30.7 per cent of GDP. Canada is now considerably below the OECD average in tax revenues as a percentage of GDP.12
Figure 4.7. Tax Revenue as Percentage of GDP
Source: OEC2017-05-01.Stat. Public Sector, Taxation and Market Regulation > Taxation > Revenue Stats - OECD Members > Comparative Tables.
The tax cuts to businesses in Canada have been particularly dramatic and, according to the accounting firm PricewaterhouseCoopers, Canada now has one of the lowest business tax rates in the world (Canadian Press 2012). Altogether, the assumption that tax decreases could, over a long term, increase revenues because of higher economic activity is not born out in the case of Canada. As figure 4.7 shows, the revenue to GDP has decreased steadily since 1997. Although governments have assiduously pursued balanced budgets and total debt reduction, the reduction in the tax share seems oddly immune to policy considerations. In fact, when balanced budgets are achieved, as seems to be the case for Canada for 2014, the government then proceeds with a new round of tax cuts.
Labour
The decline in labour’s share of the national income since the early 1990s is well-known in Canada. Government policy to reduce wages for all except senior management has been successful through government cutbacks in the public sector, but also through changes in legislation related to employment standards and the labour code within provinces (Fairey 2012; Mackenzie 2012; Peters 2012; Ross and Savage 2012). As can be seen in figure 4.8, there has been a fairly steady decline in labour compensation to GDP since the high point of 1991–2, with an increase during the government’s stimulus policies associated with the 2008–10 recession.
Figure 4.8. Employee Compensation in Canada (% of GDP)
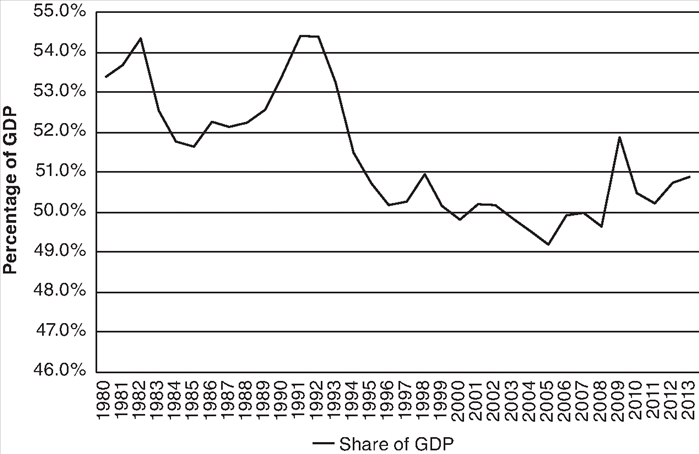
Source: National Accounts, Main Aggregates, GDP; Compensation of Employees, Current prices, Millions. OECD.Stat.
The comparison with other countries shows that Canada has always lagged behind most other countries (all except Australia) in the proportion of the national income that goes to labour. The largest proportion to labour was in 1991 and 1992, when it accounted for 54.4 per cent of the national income. The low point over the past three decades was in the twenty-first century, where it dipped as low as 49.2 per cent. This improved when government specifically targeted the auto, housing, and resource sectors in the stimulus package associated with the 2008–10 recession. But also significant was the increased use of Employment Insurance so that a greater proportion of people who became unemployed received insurance benefits.
Conclusion
Since 1990, Canadian governments have consistently avoided expanding or creating new social programs, and have cut the importance of most of them. This includes relative cuts to those that are most often considered counter-cyclical stabilizers, such as pension benefits, housing programs, social assistance, and employment insurance. They have also downsized employment in the public sectors, instituted a range of policies that have suppressed wages, and have embarked on radical reductions to taxes. Altogether government social spending as a percentage of GDP has declined steadily since the early 1990s, then increased briefly during the attempts to stimulate the economy over the recent recession, and subsequently seems to be resuming the downward trend.
The obvious observation from this chapter is that these approaches to “expansionary austerity” have not improved the performance of the economy, particularly in its growth and the volatility of growth. The increases in spending to countermand the recession were confined to permanent tax cuts, very short-term expansions of social programs, and support for specific industries. The economy did improve during the short period that Canada’s stimulus program was in effect. This was not related to tax cuts (which have a poor multiplier effect), but to other initiatives that had a greater impact. Government spending can have a positive effect on growth rates, as the government obviously anticipated and that occurred in response to the recession. But the experience of the recession was very short-lived, and confirms the tendency for Canadian governments to focus on short-term crisis management, rather than on long-term stability.
The assumption associated with a Keynesian analysis would be that reductions to government social spending and tax cuts should, under normal circumstances, have increased economic volatility, and there is evidence that economic volatility has increased in Canada. But it also needs to be noted that other kinds of economic policy affected the impact of social and total public spending on volatility. For a considerable length of time, the expansionary austerity of both program and tax cuts was accompanied by either massive currency devaluation (as during the 1990s) or expansionary monetary policy (as in recent years). That is, the use of monetary policy and the value of the dollar may offset the effect of fiscal policy – specifically the reductions in government social spending – on growth rates.
These findings do contradict the assertions that expansionary austerity through the approach Canada has used (tax reductions and smaller government social spending/GDP) will both create more government revenues and improve growth rates. Higher taxes have not stimulated investment as claimed would happen, and growth rates not only are decreasing but also are more volatile.
My final observation would be that it seems entirely possible that expansionary austerity could continue for a very long time, as long as governments and people are willing to tolerate substantial uncertainty in the economy and the deterioration of services that people need. The automatic stabilizers that could temper the volatility and its consequences for people are decreasingly significant as a proportion of the total economy. This means that governments will continue to focus on containing crises as they arise for short periods of time and resume austerity measures once the economy is more stable.
References
Barro, Josh. 2014. “Conservatives Fall in Love with Canada.” New York Times, 21 September.
Berg, Andrew G., and Jonathan D. Ostry. 2011. “Equality and Efficiency.” (International Monetary Fund)Finance & Development 48 (3): 1–15.
Blyth, Mark. 2013. Austerity: The History of a Dangerous Idea. Oxford: Oxford University Press.
– 2013b. “The Austerity Delusion.” Foreign Affairs 92 (3): 41–56.
Canada. 2011. Canada’s Economic Action Plan Year 2: A Seventh Report to Canadians.http://www.actionplan.gc.ca.
Canada War Museum. n.d. “Canada at War: Post-war Planning.” http://www.warmuseum.ca/cwm/exhibitions/newspapers/canadawar/postwar_e.shtml.
Canadian Foreign Exchange Services. “Yearly Average Exchange Rates for Currencies.” http://www.canadianforex.ca/forex-tools/historical-rate-tools/yearly-average-rates.
Canadian Press. 2012. “Canadian Business Tax Rate among the World’s Lowest,” 3 December. http://www.cbc.ca/news/business/canadian-business-tax-rate-among-world-s-lowest-1.1173662.
Causa, Orsetta, Alain de Serres, and Nicolas Ruiz. 2014. “Can Growth-Enhancing Policies Lift All Boats? An Analysis Based on Household Disposable Incomes.” OECD Economics Department Working Papers, OECD Publishing, Paris.
Cohen, Marjorie. 2016. “How Useful Is Picketty’s Analysis for Political Action?” Social Studies 11 (1): 212–15.
Cohen, Marjorie Griffin. 1997. “From the Welfare State to Vampire Capitalism.” In Women and the Canadian Welfare State, ed. Patrica M. Evans and Gerda R. Wekerle, 28–67. Toronto: University of Toronto Press. http://dx.doi.org/10.3138/9781442683549-005.
– 2013. “Neo-Liberal Crisis/Social Reproduction/Gender Implications.” University of New Brunswick Law Journal 64:234–52.
Darby, J., and J. Melitz. 2007. “Labour Market Adjustment, Social Spending and the Automatic Stabilizers in the OECD.” 47th Panel Meeting of Economic Policy, 18–19 April, Ljubljana. www.econpapers.repec.org/RePEc:cpr:ceprdp:6230.
– 2011. “Joint Estimates of Automatic and Discretionary Fiscal Policy: The OECD, 1981–2003.” Paris: Centre d’Études Prospectives et d’informations Internationales.
Department of Finance. 2011. “Canada’s Economic Action Plan: A Seventh Report to Canadians.” http://www.fin.gc.ca/pub/report-rapport/2011-7/ceap-paec-a-eng.asp.
Fairey, David. 2012. Why BC’s Lower-Wage Workers Are Struggling: The Case for Stronger Employment Standards. Vancouver: Canadian Centre for Policy Alternatives.
Giavazzi, Fransesco, and Marco Pagano. 1990. “Can Severe Fiscal Contractions Be Expansionary? Tales of Two Small European Countries.” NBER Macroeconomics Annual 5:75–111. http://dx.doi.org/10.1086/654131.
Guajardo, Jamie, Daniel Leigh, and Andrea Pescatori. 2011. Expansionary Austerity: New International Evidence. IMF working Paper, July.
Joël, Cariolle. 2012. Measuring Macroeconomic Volatility: Applications to Export Revenue Data, 1970–2005. Auvergne: Fondation pour les Études et Reserches sur le Development International. http://www.ferdi.fr/sites/www.ferdi.fr/files/idi/I14_eng.pdf.
Lee, Marc, Iglika Ivanova, and Seth Klein. 2011. “BC’s Regressive Tax Shift.” In Behind the Numbers. Vancouver: Canadian Centre for Policy Alternatives, June.
Lucke, Bernd. 1997. “Non-Keynesian Effects of Fiscal Contractions: Theory and Applications for Germany.” ResearchGate. https://www.researchgate.net/publication/228637644_Non-Keynesian_effects_of_fiscal_contractions_theory_and_applications_for_Germany.
Mackenzie, Hugh. 2012. Canada’s CEO Elite 100. Ottawa: Canadian Centre for Policy Alternatives.
OECD. 2016. “Social Expenditure Database (SOCX).” http://www.oecd.org/social/expenditure.htm.
OECD.Stat. 2017a. “Social Expenditure: Aggregated Data.” OECD. http://stats.oecd.org/Index.aspx?datasetcode=SOCX_AGG#.
– 2017b. “Welcome to OECD.Stat.” http://stats.oecd.org.
Panitch, Leo, and Sam Gindin. 2012. The Making of Global Capitalism: The Political Economy of American Empire. London: Verso.
Papadimitriou, Dimitri B., Michais Nikiforos, Gennaro Zezza, and Greg Hannsgen. 2014. Is Rising Inequality a Hindrance to the US Economic Recovery?Annandale-on-Hudson, NY: Levy Economics Institute.
Peters, John. 2012. Boom, Bust and Crisis: Labour, Corporate Power and Politics in Canada. Halifax: Fernwood.
Piketty, Thomas. 2014. Capital in the Twenty-First Century. Cambridge, MA: Belknap. http://dx.doi.org/10.4159/9780674369542.
Rice, James J., and Michael J. Prince. 2000. Changing Politics of Canadian Social Policy.Toronto: University of Toronto Press.
Ross, Stephanie, and Larry Savage, eds. 2012. Rethinking the Politics of Labour in Canada. Halifax: Fernwood.
Statistics Canada. 2013. “Table 202-0709: Gini Coefficients of Market, Total and After-Tax Income of Individuals, Where Each Individual Is Represented by Their Adjusted Household Income, by Economic Type.” http://www5.statcan.gc.ca/cansim/a26?id=2020709&retrLang=eng&lang=eng.
Vernon, J.R. 1919. “The 1920–21 Deflation: The Role of Aggregate Supply.” Economic Inquiry 29 (3): 572–80.
Footnotes
1 I would like specifically to thank Mike Kim for his extremely helpful research assistance.
2 It is usually set aside during election years as well.
3 For a discussion of this aspect of Piketty’s analysis, see Cohen (2016).
4 This does not mean that others have not tried to deal with the relationship between economic inequality and the rise of financial instability in recent periods. See, for example, Papadimitriou et al. (2014); Causa, de Serres, and Ruiz (2014).
5 The distinction between Keynesian and institutionalist economic approaches was important in this period. The Keynesians tended to focus on aggregate employment and macroeconomic issues, and while these were significant also for the institutionalists, they tended to be more cognizant of the issues related to social spending, specific sectors of the economy, and relationships between these sectors.
6 Others in this volume discuss the production, resilience, and power of the idea of “expansionary austerity.” See Evans, chapter 10; Plehwe, chapter 9; and McBride, chapter 8.
7 The “German” view was termed by Giavazzi and Pagano to describe the most prominent non-Keynesian effect of fiscal contraction. For a discussion, see Lucke (1997).
8 Before the free trade deals were signed, the promise was that under the conditions of free trade, more revenue would come to governments and, as a result, social programs could be strengthened and expanded. Arguments prominent in Canada during the free trade debates to show how social reproduction needs could be reconciled with the macroeconomic objectives in Canada – i.e., that free trade would bring greater wealth that would allow for expanded social programs – disappeared once the agreements were signed.
9 Note that part of the period considered a success during the 1990s was a time of very serious currency devaluation, in an attempt to recover from the disastrous first years of the Canada-US Free Trade Agreement. The value of the Canadian dollar went from US$0.872 in 1991 to US$0.645 in 2001. See Canadian Foreign Exchange Services.
10 This includes expenditures for all levels of government. The comparison between countries is always difficult, and even among OECD nations the data have problems. In this case expenditures on education, other than through the federal transfers to the provinces, do not seem to be included, nor are they included for other nations. (For notes on the OECD database by country on social expenditure, see OECD 2016.)
11 Jim Stanford convincingly shows that while Canada is often applauded for having weathered the 2009 economic crisis relatively well, this basically is not true (Stanford 2013).
12 The tax cuts have occurred at the federal and provincial levels. For an indication of the impact of shift in tax fairness in one province, see Lee, Ivanova, Klein (2011).