3
Mechanical properties of the hardened concrete
3.1 General
Owing to its dense microstructure, ultra high performance concrete (UHPC) has both a high strength and also a greater stiffness (expressed by the modulus of elasticity) when compared with normal- and high-strength concretes. It is well known that the behaviour of concrete becomes more brittle as its strength increases. This effect is particularly evident with UHPC. However, this disadvantage can be countered effectively by adding fibres, e.g. high-strength steel fibres, which bring about a considerable improvement in the post-peak behaviour in compression and tension, and that in turn means a more favourable response generally and better warnings when failure is pending. Further, the utilizable strength can be increased, especially for tension actions. Compared with the brittle matrix, activating the fibres (basically a form of reinforcement) can also help UHPC handle tension more reliably. Various mechanical properties of the hardened concrete are discussed below in so far as they are relevant, also with respect to the influence of adding fibres. However, the local distribution of the fibres and their orientation must always be considered, see Section 2.7.2. Some of the information below is drawn from the state of the art report on UHPC [22].
3.2 Behaviour in Compression
3.2.1 UHPC without Fibres
UHPC, compared with normal- and high-strength concrete, is characterized by the fact that, in a uniaxial compression test, it exhibits an essentially linear elastic behaviour for a relatively long time – until shortly before reaching its compressive strength and before the formation of microcracks signal the transition to failure. This effect has been observed essentially irrespective of the maximum grain size. The modulus of elasticity generally lies in the range 45–55 GPa. Adding bauxite can increase this figure significantly, to approx. 70 GPa. Without fibres, brittle failure is the result (see Figure 3.1), which in compression tests – as described in Section 2.7.2 – is very often in the form of a sudden, explosive failure. A similar effect has been observed in UHPC from values as low as about 90 N/mm2.
Fig. 3.1 Stress–strain diagram for UHPC without fibres in a uniaxial compression test
The addition of fibres has very little influence on the ascending portion of the stress–strain diagram. The increase in strength with typical fibre contents of up to approx. 2.5% by vol. is of minor importance, likewise the influence on the modulus of elasticity. However, this and the strain upon reaching the strength clearly depend on the grading of the aggregate. In the case of fine-grained concretes with max. 2 mm particle size, we can typically expect 4.0–4.4‰ [57,58], whereas in coarse-grained concretes, figures in the region of 3.5‰ have been observed.
Generally, the value of the modulus of elasticity of UHPC is underestimated by the equations given in DIN 1045-1 and CEB-FIP Model Code 90 [59]. Following tests carried out at the University of Leipzig [58], the following relationships between the modulus of elasticity Ec and the cylinder compressive strength fc have been proposed for fine- and coarse-grained UHPC (see Figure 3.2):
Fig. 3.2 Relationship between modulus of elasticity and cylinder compressive strength [22]


with Ec and fc in N/mm2.
As in EN 1992 [61,62] and DIN 1045-1,
can be assumed.
Poisson's ratio ν was found to lie between 0.18 and 0.19 for fine-grained UHPC in the elastic zone [60] and to be approx. 0.21 for coarse-grained UHPC (basalt chippings with max. 5–8 mm particle size). It is therefore very similar to the figure of 0.2 typically assumed for normal-strength concrete. As can be seen from the stress–strain diagram, a departure from the linear elastic response takes place fairly late due to the formation of microcracks, which is reflected in the late rise in Poisson's ratio (see Figure 3.3). At failure, ν = 0.3 can be assumed unless more accurate data is available for the respective mix.
Fig. 3.3 Development of Poisson's ratio ν as the compressive stress increases [22]
3.2.2 UHPC with Steel Fibres
The addition of high-strength steel fibres can bring about a distinct improvement in the post-peak structural behaviour. However, this has hardly any effect on the ascending portion of the stress–strain curve. By contrast, the descending portion of the curve is influenced to a great extent by the following parameters:
- – Fibre content
- – Fibre geometry (length, diameter), also when compared with the maximum particle size
- – Fibre orientation
- – Bond between fibre and matrix (surface properties, any profiling, etc.)
- – Stiffness of the fibres, specifically in combinations of different fibres.
It is, however, hardly possible to predict the course of the descending portion of the stress–strain curve by means of simple relationships. Therefore, appropriate laboratory studies are generally necessary for a certain UHPC. It should also be remembered that the fibre content and fibre orientation in a component can vary locally and be influenced by concreting activities. During concreting, the large majority of the fibres is aligned with the direction of flow, primarily parallel with any nearby formwork surface. As an example, Figure 3.4 shows a number of measured stress–strain curves for Ductal® [63] (measured on 200 × 100 × 100 mm prisms) and according to [11] (measured on 300 × 150 × 150 mm cylinders). The figure clearly shows how the post-peak behaviour can be considerably improved and controlled by adding fibres. However, the measured stress–strain curves for the post-peak range (descending portion of curve) exhibit much more scatter than the ascending portion. This is illustrated schematically in Figure 3.5.
Fig. 3.4 Compression stress–strain relationships for UHPC with fibres [22,63]
Fig. 3.5 Compression stress–strain diagram (schematic) for UHPC with variation in the behaviour in the descending portion depending on fibre content, fibre type and fibre orientation [22]
Up to about 2% by vol. fibres, no significant influence on the compressive strength was observed. According to [11], a rise in the compressive strength amounting to approx. 15%, compared with an otherwise identical mix without fibres, was noted at a content of 2.5% by vol.
3.2.3 Further Factors Affecting the Compressive Strength
3.2.3.1 Geometry of Test Specimen and Test Setup
The results available regarding the influences of the test specimen geometry are inconsistent. From the mechanics of materials viewpoint, it is the way the loading platens restrict the lateral strain that is responsible for this. Normally, cylindrical specimens with a slenderness ratio (height/diameter) of 2 should be used to determine the compressive strength. The diameter should be at least 100 mm. The French guideline [64] recommends cylinders with dimensions of 70 mm dia. × 140 mm high or 110 mm dia. × 220 mm high.
Quite often, the high strength of UHPC means that the test specimen dimensions have to be chosen to suit the capacity of the testing machine. In the case of UHPC without fibres in particular, it is especially important that the surfaces of the specimen are exactly parallel and that stress concentrations due to misalignment or deformation of the loading platens are avoided.
3.2.3.2 Heat Treatment
Curing with the help of heat can increase the strength of UHPC and accelerate the strength development. Temperatures of approx. 80–90 °C are typical, which are applied for 1–2 days. According to [11,25,65], heating at only 90 °C for just 48 h leads to higher strengths than storing in water for 28 days at 20 °C. Heat treatment at 250 °C influences not only the reaction rate of the setting process, but also leads to the formation of other mineral phases and hence to a change to the microstructure that results in much higher strengths being reached.
3.3 Behaviour in Tension
3.3.1 Axial (Concentric) Tension Loads
Axial tension tests represent a direct way of shedding light on how UHPC behaves in tension. Tests on unnotched specimens are suitable for determining the tensile strength, whereas tests on notched specimens are more appropriate for determining the stress–crack width relationship of fibre-reinforced UHPC. The latter is regarded as characteristic for the response of brittle materials or materials with a softening post-peak behaviour. Typical tensile strength values for UHPC lie in the range 7–11 N/mm2. Fehling et al. [11] and Tue/Dehn [60] did not observe any significant differences between fine- and coarse-grained concretes without fibres. However, the tensile strength is mainly influenced by the addition of silica fume to the mix.
Without fibres, very brittle failure can be expected in tension. It is therefore very difficult to measure any stable descending portion in the force–deformation diagram, or stress–crack width diagram. Owing to the high strength of the matrix, cracks typically run through the grains of aggregate as well, and the edges to cracks are very smooth, which means that the interlocking effects typical of normal-strength concrete are virtually absent in UHPC. Therefore, up until complete separation of the crack edges, the specific fracture energy per unit area GF required is only in the order of magnitude of 50 N/m (fine-grained UHPC) to 100 N/m (coarse-grained UHPC) [66].
However, the addition of fibres results in a higher tensile strength on the one hand and the ability to transfer forces across much wider cracks on the other. The fibres bridge over the cracks in this situation and are able to transfer some of the tensile strength of the matrix, or even higher stresses in favourable conditions. This situation occurs when sufficient numbers of high-strength fibres with a favourable orientation are available. An increase in strength is then possible with respect to the first crack in the matrix, i.e. a strain hardening behaviour is observed (see Figure 3.6). Figure 3.7 shows the development of the stress as the crack widens for cases with a softening behaviour. The dependence of the post-cracking behaviour on the addition of fibres is illustrated in Figure 3.8. In principle, it involves the same parameters as those that determine the post-peak response for compression actions (see above).
Fig. 3.6 Stress–strain diagram for axial tension for UHPC containing fibres with an initially strain hardening behaviour (Ductal®, fibre content 2% by vol., after [63]); (a) dimensions, (b) Stress-strain diagram, (c) crack pattern. (Note:  = 1‰ corresponds to approx. 0.2 mm elongation)
Fig. 3.7 Stress–crack width relationships for fibre contents of 0.5% by vol. without strain hardening behaviour and 1.5% by vol. with an initially strain hardening behaviour; test data for 20 mm long fibres and derived theoretical curve according to Equation 3.5 [67]
Fig. 3.8 Typical stress–crack width behaviour of UHPC in a tensile test
Leutbecher [68] has described and carried out further studies of the load-carrying mechanism in cracked fibre-reinforced UHPC. Figure 3.9 shows the results of tests in which the crack widths in notched prisms were measured very accurately. It can be seen that after the matrix cracks, there is initially a drop in the force (concrete stress at crack, for cracks <50 µm wide) followed by a rise as the steel fibres are activated. Following full activation of the load-carrying effect of the fibres, pull-out of the fibres begins beyond a certain crack width w0 (from approx. 0.15 mm in this case), with a decrease in the force carried by the fibres.
Fig. 3.9 Phases of the load-carrying behaviour: following matrix softening, fibre activation followed by fibre pull-out, illustrated for two different fibre efficiency values [68]
As long as the force, or stress, possible at full fibre activation exceeds the tensile strength of the matrix (outside the region where the fibres transfer the load), so further cracks can form and strain hardening behaviour is possible. As the crack width increases, so the fibres are pulled out more and more and their embedment length is reduced, which leads to a drop in the force that can be carried by the fibres. What typically happens in an axial tensile test is that one crack opens wide and the stress that can be accommodated drops so that other points along the bar are relieved. Localized deformations are the result. This can limit the ductility considerably in the case of long components.
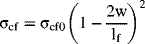
The crack opening behaviour observed experimentally is explained further in Figure 3.10 and by means of the model described in the following. As the concrete matrix softens (in the figure assumed, for simplicity, to be linear with the concrete stress decreasing as the crack widens), so the load-carrying effect of the fibres is mobilized more and more. If we assume that the bond between the fibre and the matrix has already been overcome, then slip starts to occur over a successively longer length of the fibre and frictional bond stresses are mobilized. This results in a rise in the force carried by the fibres in accordance with a root function up until the maximum possible embedment length is activated:
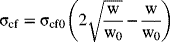
where
- σcf0 fibre efficiency
- w current crack width
- w0 crack width upon reaching fibre efficiency.
Fig. 3.10 Example of the superposition of matrix softening and fibre activation [68] (1) Fibre-reinforced UHPC with hardening behaviour following formation of first crack ( ) (2) Fibre-reinforced UHPC with softening behaviour following formation of first crack. (
 )
)
A constant frictional bond stress is presumed here (rigid-plastic bond). The gross concrete stress currently transferred by the fibres is σcf, and σcf0 is the fibre efficiency, i.e. the maximum gross concrete compressive stress made possible by the fibres. This expression is based on the work of Pfyl [69] on the modelling of fibre-reinforced concrete. The term ‘post-cracking strength’ is also common, which originally comes from fibre-reinforced normal-strength concrete, where the effect of fibres added in typical amounts is generally insufficient to keep the stress at the level of the tensile strength of the matrix. Figure 3.10 also shows that by superposing matrix softening and fibre activation, which results in a severe increase in stresses for small crack widths, a maximum stress  can exist. Similar behaviour was observed by Holmberg [70,71], who was able to establish a more severe rise in the cracking force in heavily reinforced concrete tension members than can be explained by the ratio between the ideal and the net cross-sectional areas.
For a fibre that crosses the crack at a right-angle at half its length, the maximum available embedment length is equal to half the length of the fibre lf. This is called the model fibre in the following. As a crack opens further, so the model fibre begins to be pulled out of the matrix. The consequence of this is a linear decrease in the fibre stress over the remaining pull-out distance (slip), with the bond stress on the fibre surface presumed to be constant. If we assume that the embedment length on one side is minimally smaller than that on the other, so the fibre will pull out from the shorter side, while remaining anchored in the matrix on the somewhat longer side. So the limit case, the point at which the fibre no longer has any effect, is for a crack width equal to half the length of a fibre, i.e. σcf (w = lf/2) = 0.
However, in the case of fibre-reinforced concrete it is not just the behaviour of the model fibre that is decisive, but rather the behaviour of all the fibres that cross the crack at various angles and with various embedment lengths on both sides of the crack. Therefore, as the fibres begin to be pulled out, there is a considerable drop in force as the crack widens, whereas at large crack widths, many fibres have already been fully pulled out from one side of the crack. So at large crack widths, no great changes to σcf are to be expected. This can be expressed by a quadratic decrease in the gross concrete stress σcf as the crack widens, which is attributed to the fibre efficiency:
Equations 3.4 and 3.5 are found in the studies of Li [72], Pfyl [69], Behloul [73,74], Jungwirth [75] and Leutbecher [68], and are valid for fibre-reinforced concrete in general but fibre-reinforced UHPC in particular. It has been shown that the stress–crack width relationship originally derived for fibres exclusively aligned in the tension direction, and hence the form of the curve shown in Figure 3.10, also applies, in principle, to the effect of all the fibres crossing the crack at any angle. However, the value of the fibre efficiency σcf0 must be adjusted accordingly, which is best carried out on the basis of test results.
Test results from Delft [76] and Kassel [68,77] prove that the fibre efficiency changes little in the range of a 0–60° deviation from a normal to the crack. This can be explained by the fact that the fibres in the crack become aligned in the deformation direction as the crack widens and are bent at the edges of the crack. The additional friction as a result of the contact pressure between the surface of the fibre and the matrix in the region of the bend can even result in a higher stress being possible provided the matrix has not been damaged by local spalling. The latter also seems to play a role with respect to the disproportionate increase in the fibre efficiency as fibre content increases (see Figure 3.11).
Fig. 3.11 Fibre efficiency plotted against fibre content measured using optical analysis (fibres lf/df = 20/0.25 mm) [67]
3.3.2 Flexural Tensile Strength
Flexural tensile tests are often preferred for determining the tensile strength properties because they are also easily carried out with a compression testing machine and do not require any elaborate arrangements to introduce the load. Section 2.7.2 contains advice on the production of test specimens and testing.
Tests carried out in Kassel [25] with unnotched specimens made from UHPC without fibres established that the flexural tensile strength for prisms measuring 160 × 40 ×40 mm can reach 13–17 N/mm2, whereas the same mix only reached values of 7–10 N/mm2 for beams in bending measuring 700 × 150 × 150 mm [11,78]. A significant scale effect can therefore be observed, which in the first place can be attributed to fracture mechanics effects.
When fibres are added, the behaviour after crack formation is on the whole less brittle, almost plastic, which leads to a more favourable distribution of flexural stresses. A higher measured flexural tensile strength fct,fl = Mu/W is the result. Depending on the mix, values in the range 15–40 N/mm2 have been measured. Here, the influence of the fibre orientation due to the proximity of formwork surfaces, which can have a noticeable effect on test specimens with small dimensions, is superposed on the scale effect due to fracture mechanics.
For prisms with a square cross-section, Equation 3.6 expresses this relationship for the results on which Figure 3.12 is based:
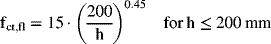
where
- h thickness of test specimen (square cross-section) [mm]
- fct,fl flexural tensile strength [N/mm2].
Fig. 3.12 Relationship between flexural tensile strength and component thickness for UHPC with 2% by vol. fibre content, fck = 160–180 N/mm2 (after [79])
Also conceivable in principle is transferring this relationship to other fibre-reinforced UHPCs provided the tensile strength is scaled to suit the particular component thickness.
Determining the flexural tensile strength is best carried out with unnotched test specimens; notched specimens are suitable for determining the stress–crack width relationship. The French guideline [64] recommends the following when determining the tensile strength properties of UHPC:
- – Four-point bending tests on unnotched specimens for determining the flexural tensile strength. The axial (concentric) tensile strength can be determined with the help of a correction factor to take account of the scale effect.
- – Three-point bending tests on notched specimens for determining the contribution of the fibres in a cracked cross-section. The French guideline also specifies a method for backward identification in order to back-calculate to a stress–crack width relationship.
Prisms with a square cross-section are recommended in the French guideline, with a length equal to four times the cross-section thickness a (L = 4a). The span should be 3a. The thickness of the zone with the fibre orientation preferably parallel with the edge increases with the fibre length lf, so the choice of specimen thickness depends on this, and the recommendations are:
| – | 280 × 70 × 70 mm prisms | for lf ≤ 15 mm |
| – | 400 × 100 × 100 mm prisms | for 15 < lf ≤ 20 mm |
| – | 560 × 140 × 140 mm prisms | for 20 < lf ≤ 25 mm |
| – | Prisms with width and height a > 5 lf | for lf > 25 mm |
The DAfStb guideline for steel fibre-reinforced concrete [51] uses a four-point bending test with beam dimensions of 700 × 150 × 150 mm (L × W × D) (see Figure 3.13).
Fig. 3.13 Standard test according to DAfStb guideline for steel fibre-reinforced concrete [51]
When it comes to the residual tensile strength, the evaluation of the tests according to the DAfStb guideline is based on conversion factors that permit the concentric post-cracking tensile strength to be estimated from the post-cracking flexural tensile strength. As cross-section thicknesses much smaller than 15 cm are very common for UHPC, the use of correspondingly thinner test specimens is sensible in these cases. The influence of the fibre orientation parallel with the formwork in the perimeter zones is very important for the flexural tensile strength in particular.
The interaction of fibres with different geometries or made from different materials (e.g. PVA instead of steel) in ‘fibre cocktails’ can have advantages when it comes to the flexural tensile strength and the fracture energy. Fibres that are activated in different deformation ranges can usefully complement each other [43,76,78,80]. For example, PVA fibres with their lower strain stiffness are effective at greater crack widths, whereas steel fibres are already active at small crack widths (Figure 3.14), see also Section 3.10.
Fig. 3.14 How steel and PVA fibres interact and influence the post-cracking behaviour [78]
3.3.3 Derivation of Axial Tensile Strength from Compressive Strength
EN 1992 specifies more cautious relationships for concretes with a higher strength (C50/60 and higher) than for normal-strength concretes. However, the results obtained for UHPC so far justify the use of the following relationships:
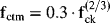
and
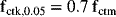
as for normal-strength concrete. The tensile strength determined in this way is related to the tensile strength of the matrix. In fibre-reinforced concrete with a sufficiently large fibre content, however, the fibre efficiency can lie well above the tensile strength of the matrix.
3.3.4 Derivation of Axial Tensile Strength from Bending Tests
The French guideline [64] uses a slightly modified relationship taken from Model Code 90 to derive the axial tensile strength from the flexural tensile strength:
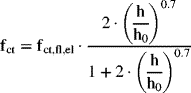
where
- h0 = 100 mm
- h0 height of prism [mm]
- fct,fl,el extreme fibre stress upon formation of flexural crack (elastic limit) [N/mm2].
Equation 3.9 uses the extreme fibre stress upon formation of the first crack, or rather the elastic limit. It is therefore based on the capacity of the concrete matrix, but was originally derived for the flexural tensile strength, i.e. the nominal bending stress upon reaching the maximum bending moment.
In UHPC with sufficiently strong fibre reinforcement, the effect of the fibres can determine the flexural tensile strength. However, the same fracture mechanics scale effect is not to be expected; other conversion factors should be applied. The DAfStb guideline for fibre-reinforced concrete can be used here. A conversion factor of 0.37 is specified in that guideline, and the post-cracking flexural tensile strength should be multiplied by that figure.
3.3.5 Splitting Tensile Strength
Cylinders with a slenderness λ = d/h = 2 and min. 100 mm diameter should be used for determining the tensile strength from tensile splitting tests.
In the light of the results obtained hitherto, it can be said that the splitting tensile strength of UHPC without fibres roughly corresponds to the axial tensile strength. Only a few results are available so far for UHPC with fibres [81].
3.3.6 How Fibre Geometry and Orientation Influence the Behaviour of UHPC in Tension
As already discussed, the post-cracking behaviour of UHPC depends on fibre content, fibre geometry and fibre orientation. The fibre content and orientation can vary locally within a component, which in the first place is connected with the concreting procedure (concreting direction and progress, the flow of the concrete within the formwork). The proper choice of formwork and concreting procedures also provides a chance to influence the fibre distribution and orientation in the component in such a way that the fibres make an optimum contribution to carrying the loads, see also Section 2.7.2.
Flexural tensile tests carried out at the Institute of Construction Materials, Concrete Construction & Fire Protection in Braunschweig [82] included studies comparing the behaviour of UHPC with long fibres (30 mm) and short fibres (approx. 13 mm). A coarse-grained concrete with max. 8 mm particle size and fibre contents between 80 and 120 kg/m3 was used in the tests (see Figure 3.15). Whereas in the range of small deformations, similar, good values for both types of fibre were obtained, the tensile capacity of short fibres decreased faster as the deformations (and hence the crack widths) increased.
Fig. 3.15 Stress–deflection diagram for UHPC beam in bending with short and long fibres
Bernier and Behloul [83] investigated the influence of fibre orientation on the flexural tensile strength and post-cracking behaviour of UHPC by forcing the concrete to flow through screens during casting and thus achieving the preferred fibre orientation. It is clear from the results shown in Figure 3.16 that the maximum flexural tensile strength is reached when θ = 90° (practically all the fibres aligned in the tension direction), whereas in the most unfavourable case of θ = 0° (fibres perpendicular to tension direction), the fibres even had a separating effect. In the latter case, the flexural tensile strength was even below that of a plain concrete matrix.
Fig. 3.16 How fibre orientation influences flexural tensile strength and ductility (after [83])
The effect of fibre orientation after passing the fibre-reinforced concrete through screens can explain the preferred orientation parallel with the formwork in the proximity of the formwork. Another consequence is that, on the whole, a preferred orientation parallel with the formwork can ensue with small test specimen thicknesses/widths.
Table 3.1 shows the results of tests [11] on UHPC with almost self-compacting properties. The fibres align themselves mostly horizontally in such concretes. The orientation of the test specimens during concreting was varied in this series of tests. Considerable differences for the different positions during concreting can be seen in Table 3.1 because in the specimens concreted vertically, the fibres were primarily aligned perpendicular to the forces during loading. As shown above, a lower (flexural) tensile strength is to be expected when loads are applied perpendicular to the prevailing fibre orientation than when the fibres are mainly aligned in the loading direction. Besides the tensile strength, the specific fracture energy Gf,10% was also ascertained. For this parameter, the area beneath the stress–crack width curve was evaluated up to a residual strength of 10%.
Table 3.1 Tensile strength and fracture energy depending on specimen orientation during concreting [11].
| Age of specimen | Uniaxial tension | Flexural tension | |||||
| Test specimen |  |
Prism 160 × 40 × 40 mm  |
Beam 700 × 150 × 150 mm  |
||||
| Curing | 90° | 90° | 90° | ||||
| Concreting direction | horizontal | vertical | horizontal | vertical | horizontal | vertical | |
| Fracture energy GF,10% [N/m]b) | 7d 28d 28da) |
16 757 14 555 17 014 |
9993 | 20 100 18 052 19 820 |
15 097 | 20 355 19 892 |
14 543 |
| Tensile strength fct [N/mm2] |
7d 28d 56d |
14.2 13.3 17.7 |
7.86 | 34.0 35.7 36.3 |
22.51 | 22.1 22.2 22.1 |
17.6 |
| a) Specimens with 25 days of heat treatment at 90 °C | |||||||
| b) Fracture energy for integration up to reaching a residual load-carrying capacity equal to 10% of the maximum capacity | |||||||
So apart from the geometry of the test specimen, or component, the orientation of the component during concreting and the complete production process are always important, especially with respect to the direction of flow during concreting. This information should therefore always be specified because otherwise there is no chance of reproducing results and making comparisons.
3.3.7 Converting the Stress–Crack Width Relationship into a Stress–Strain Diagram
With softening behaviour, the stress–strain line for axial tension is no longer obvious owing to the localization of the deformations taking place at a severely widening crack. For example, for the same fibre-reinforced concrete, or generally the same material, the line would depend on the reference length. The longer the component, the less a local deformation (elongation) can determine the overall behaviour. Consequently, it is not possible to specify a clear stress–strain line for fibre-reinforced concretes with a softening behaviour. For materials with a strain hardening behaviour, a clear stress–strain line only exists up to the onset of softening.
Nevertheless, in order to be able to define UHPC, and especially fibre-reinforced UHPC, it is possible to specify a stress–crack width relationship. By providing a reference to the length lst relevant to the particular case, however, this relationship can be converted to a stress–strain line. Apart from the crack width, the strains that exist within the length lst, but outside the crack, are also included. The strains at the edge of the crack can be determined from the stress as a result of the fibre effect σcf in the crack and at the end of distance lst, and a mean strain can be estimated:
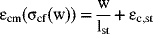
where
- cm mean equivalent strain in fibre-reinforced concrete within length lst
- c,st mean equivalent strain in fibre-reinforced concrete within length lst but outside the crack
(3.11)
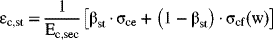
- σcf (w) nominal (concrete) stress as a result of the force transfer by the fibre effect in the crack σcf (w) depending on crack width w
- lst relevant structural length
- Ec,sec secant modulus (from relief after tension loading)
- βst solidity coefficient of stress distribution over the length, which may normally be taken to be βst = 0.6 (see Figure 3.17)
- σce stress at end of relevant length lst or at a distance of lst/2 from the crack.
Fig. 3.17 Schematic view of the progress of concrete stresses at the extreme fibres in the vicinity of a crack in fibre-reinforced concrete, based on the example of a beam in bending
In the case of a beam in bending, the change in stress between the value at the crack σcf and that at the end of the discontinuity region follows from the in-plane stress state adjacent to the crack. When using a combination of steel bars and fibres as the reinforcement, the rebars also transfer stresses, although this requires a certain short transfer length in the millimetre range for UHPC.
Different lengths should be assumed for lst depending on the situation. For components without reinforcing bars, the total length of the discontinuity regions on both sides of the crack can be based on the principle of Saint-Venant:

where
- h thickness of cross-section.
For components with a combination of reinforcing bars and fibres, the mean crack spacing governs:

where
- srm mean crack spacing.
When it is necessary to consider localization of deformations at a crack after the onset of yielding of the reinforcement, the structural length lst can be chosen depending on the modelling used (discrete or smeared cracks).
Where there is a constant distribution of the stresses in the longitudinal direction, then it follows that σce = σcf (w), i.e.

3.3.8 Interaction of Fibres and Bar Reinforcement
Provided the thickness of the component permits it, combining reinforcing bars and fibre reinforcement is interesting from the economic and ecological viewpoints because the energy and drawing plant needed to produce thin fibres are considerable. Leutbecher [68] has shown that this approach with a limited fibre content (≤1% by vol.) and moderate use of steel reinforcing bars can achieve favourable behaviour in tension members and limit crack widths to <0.1 mm.
A mechanical model [68] based on compatibility and equilibrium at the cracked cross-section permits a reliable determination of the crack widths and the forces that can be accommodated with combined reinforcement in UHPC cross-sections. The load–deformation behaviour exhibits a practically constant contribution of the fibre-reinforced concrete over large ranges and this contribution is more distinct than that of the known contribution of the concrete between the cracks in reinforced concrete without fibres (see Figure 3.18).
Fig. 3.18 Load–deformation behaviour of UHPC tension members reinforced with high-strength steel bars (grade St 1470/1620, ds = 12 mm) and 17 mm long fibres (fibre contents: 0.9, 1.45 and 2.0% by vol.): a) steel stress–strain relationship, b) contribution of fibre-reinforced concrete
Components with combined bar/fibre reinforcement therefore exhibit ‘plastic’ behaviour to a certain extent although the steel reinforcing bars have not yet begun to yield. Owing to the smaller crack widths, a pronounced localization of deformations at a crack is not normally to be expected. Up to the yield point, which in the case of high-strength steels can be way over 5‰, this type of behaviour is observed virtually every time. The unavoidable scatter with respect to fibre distribution and orientation are therefore far less noticeable in long components in particular than in fibre-reinforced concrete without steel reinforcing bars, where a local weakness could very quickly limit the extensibility of a long component.
After the onset of yield in the steel rebars, localization of deformation at a single crack can take place more easily if the negative tangent stiffness of the fibre-reinforced concrete as the fibres are pulled out (descending portion of stress–crack width diagram) can no longer be compensated for by a sufficiently large stiffness of the – now plastic – steel reinforcement.
3.4 Shrinkage
The shrinkage of the reference concretes M2Q (fine-grained) and B5Q (coarse-grained) from the German research programme (see Table 2.1) was compared with that of conserved specimens and specimens that were able to dry out naturally in a climate chamber at 20 °C and 65% RH The results are shown Figure 3.19. Measuring started one day after production.
Fig. 3.19 Shrinkage of the a) coarse-grained UHPC B5Q mix [84], and b) fine-grained UHPC M2Q mix [85], measured on conserved specimens and specimens able to dry out naturally at 20 °C/65% r.h
For the fine-grained UHPC with a w/c ratio of 0.20 and a w/b ratio (equivalent w/c ratio) of 0.17, the shrinkage progression and the total shrinkage strain for the two differently stored series were identical (about 0.35 mm/m). This means that the measured deformation for this w/b ratio was due exclusively to the hydration-related autogenous shrinkage.
The shrinkage progression and the shrinkage strain of the conserved coarse-grained UHPC were similar to those of the fine-grained M2Q mix up to an age of 200 days. If the specimens were able to dry out, so a significant proportion of drying shrinkage was added to the autogenous shrinkage. This may well be due to the higher w/c ratio of this mix (0.24). This also confirms that the silica fume primarily acts only physically as a filler in the case of storage in water. In addition, the results indicate that the first capillary pores already start to form at this w/c ratio and hence reduce a key feature of UHPC – its very high diffusion resistance.
The foregoing measurements began one day after producing the test specimens. This is usual with normal-strength concrete because the hydration proceeds much more slowly. But with UHPC a compressive strength of 50–60 N/mm2 has already been reached after this time, i.e. the reaction and hence the correlating autogenous shrinkage proceed much faster. The shrinkage from the start of hydration was followed in [84] in a ‘shrinkage ring test’. As an example, Figure 3.20 shows the shrinkage progression and shrinkage stresses measured over the first 24 h. A shrinkage contraction of approx. 0.7 mm/m was measured on mix M2Q (mix 1A in Figure 3.20) after just one day.
Fig. 3.20 Shrinkage progression and shrinkage stresses over the first 24 h established in a shrinkage ring test carried out on a fine-grained UHPC (after [84])
Depending on cement content and mix design, a total shrinkage strain of about 0.6–0.9 mm/m can be assumed for the design of components made from non-heat-treated, low-capillaries UHPC (w/c ratio ≤ 0.25).
3.5 Creep
In a similar way to shrinkage, creep can be significantly reduced through prior heat treatment. As a first rough approximation, the following orders of magnitude can be specified:
| – | Final creep coefficient for UHPC without heat treatment: |  |
| – | Final creep coefficient for UHPC with heat treatment (approx. 70–90 °C): |  |
Studies carried out in Leipzig [86] and Karlsruhe [85] demonstrated that UHPC without heat treatment had much higher creep values than those that might be expected according to acknowledged creep theories. On the other hand, the creep of UHPC is much lower than that of high-strength concrete. Figure 3.21 compares the results obtained with unsealed 100 mm dia. test cylinders (standard climate, loading level equal to 30% of the short-term strength, onset of loading at various concrete ages) with the predictions according to DIN 1045-1.
Fig. 3.21 Creep figures for UHPC depending on concrete age at start of loading compared with predictions according to DIN 1045-1
According to [86], the drying creep proportion is low when compared with concrete with a lower strength, which is probably due to the fact that the dense microstructure represents a considerable obstruction to the transport of capillary water. Another reason could be the pronounced self-drying-out effect of UHPC.
Linear creep up to approx. 60% of the short-term strength (concrete 28 days old at onset of loading) was observed in [85], whereas distinct non-linearity has already been noted at this stress utilization when the onset of loading was earlier. Apparently, however, this can be attributed to the fact that the concrete strength is not yet fully developed in these early phases.
3.6 Multi-Axial Stresses
Interesting tests were carried out in a multi-axial test rig to determine the biaxial and triaxial strengths (Figure 3.22). The loading was applied via brushes in order to minimize the obstruction to lateral strain. The test results show that the increase in strength for biaxial compression is less pronounced than with normal-strength concrete. Consequently, the approaches customarily used for normal-strength concrete, which are based on an increase in strength for multi-axial loading, may not be used automatically for UHPC (see Figure 3.23a). In the case of triaxial loading, as compression increases in the third direction (from about 6–9%), so there is a transition from brittle to ductile behaviour, as Figure 3.23b shows [87].
Fig. 3.22 Behaviour of various concretes in the compression-compression zone [87]
Fig. 3.23 a) Triaxial testing machine, b) fracture values in the Rendulic plane and stress–strain behaviour on the compressive meridian [87]
3.7 Fatigue Behaviour
Extensive results from various sources regarding fatigue behaviour are now available. The studies carried out on fibre-reinforced UHPC by Bunje [11,57] are shown in Figure 3.24 and compared with the results of Klausen [88] for normal-strength concrete. The outcome was no significant difference between UHPC and normal-strength concrete when it came to the admissible, standardized stress ranges (related to the short-term strength). Although further tests on UHPC without fibres did reveal a similar behaviour, there was greater scatter.
Fig. 3.24 S-N curve for coarse-grained UHPC with fibres [11,57]
More recent investigations by Wefer [89] in Hannover involving approx. 200 single-stage S-N tests resulted in similar yet slightly more favourable results. No significant difference between UHPC with fibres (2.5% by vol., 9 mm long, l/d = 60) and without fibres could be established. Some 88 tests were evaluated for a lower stress level Su = 0.05, as Figure 3.25 shows. Instead of a direct regression of the means of the tests, Wefer suggests using a linear approximation passing through the relative upper stress level So = 1.0 at log Nf = 0 and through the value of the regression line for So(Nf > 107) for a reasonable value of number of cycles to failure Nf exceeding 107. The reason for this is that, on the one hand, no indications for a deviation from the linear progression could be observed up to Nf = 108. On the other, such an approach lies on the safe side for smaller numbers of cycles to failure. With respect to the question as to whether there is a limit to the fatigue strength, Wefer argues that taking the logarithm of the increase in damage log II does not show any deviation from linear behaviour up to 106, and has a very good coefficient of determination for the regression (see Figures 3.26 and 3.27). The log II value describes the gradient of the line of the strains for the upper stress level in the secondary range of the development of the axial strain up to the number of cycles to failure (see Figure 3.26) and could possibly serve as a good forecast for the range Nf > 108. Accordingly, it could be suspected that there is no distinct fatigue strength. The linear progression then lies on the safe side for high numbers of cycles to failure as well. These deliberations can be used as a starting point for a design approach, which is discussed in Chapter 5.
Fig. 3.25 Approximation of test results for the range log Nf < 8 and log Nf < 9 using the example of the regression line for a relative lower stress level Su = 0.05 (after [89])
Fig. 3.26 Typical example of development of strains at upper stress level σo plotted against number of load cycles
Fig. 3.27 a) Interpretation of relationship between increase in damage log II and taking the logarithm of the number of load cycles to failure log N, and b) in relation to the course of the S-N curve (after Wefer [89])
For reversed and compressive fluctuating loads, fatigue tests were carried out on dog-bone specimens and test cylinders in Munich and Hannover. A summary of the results is given in Figure 3.28 in the form of a modified Goodman diagram.
Fig. 3.28 Summary of tests from Munich (squares) and Hannover (triangles) for 107 load cycles in a modified Goodman diagram [90,175]
For multi-axial loading, the results must be modified according to the failure envelopes in the principal stress space: see Figure 3.29 for compressive fluctuating loads with rotationally symmetric transverse compression, and Figure 3.30 for transverse tension. The latter were obtained using cone-shaped specimens. Detailed information on this can be found in [90–92].
Fig. 3.29 Triaxial and uniaxial S-N curves for UHPC (with transverse compression, after [90])
Fig. 3.30 Triaxial and uniaxial S-N curves for UHPC (with transverse compression, after [92])
Figure 3.31 shows an overview of the results obtained at various universities for general triaxial loading.
Fig. 3.31 Overview of fatigue tests carried out so far in the meridian intersection and the deviatoric plane [90]
A research project to investigate the fatigue behaviour of UHPC was also carried out at Delft University of Technology [93]. Three different concrete mixes were compared (Figure 3.32). The concrete with the highest strength was a BSI/Ceracem. This concrete had a relatively large maximum grain size (7 mm) and contained 2.5% by vol. steel fibres (200 kg/m3, 20/0.3 mm). The mean compressive strength was 220 N/mm2.
Fig. 3.32 Flow table measurements for three UHPC mixes tested for fatigue: a) BSI/Ceracem, compressive strength = 220 N/mm2, Vf = 2.5% by vol. b) HSFRC, compressive strength = 145 N/mm2, Vf = 1.6% by vol. c) Hybrid HSFRC, compressive strength = 130 N/mm2
Another mix, denoted ‘HSFRC’, had been developed previously at the university by Grünewald [94]. This mix contained 1.6% by vol. 13/0.16 mm steel fibres; the mean compressive strength was 145 N/mm2. The third mix was a hybrid UHPC (denoted ‘hybrid HSFRC’) and contained 0.5% by vol. short fibres (l = 13 mm, df = 0.2 mm) and 1% by vol. long fibres with hooked ends (l = 60 mm, df = 0.75 mm) after Markovic [76]; the compressive strength was about 120 N/mm2. Beams measuring 1000 × 125 × 125 mm were cast from all three mixes and then tested in four-point bending tests. Both static and fatigue tests were carried out. Figure 3.33 shows the relationship between the calculated flexural tensile stress and the deflection under static loading. The strain hardening part, an indicator of a good mix, is readily apparent.
Fig. 3.33 Relationship between flexural tensile stress and deflection for three different UHPC mixes under static loading (after Lappa [93])
Figure 3.34 shows the results of the fatigue tests. The HSFRC mix exhibited the best behaviour. It turned out that, on the one hand, the scatter of the results decreased when the workability improved and that, on the other, the S-N relationships for UHPC agree well with the relationships for concrete without fibres.
Fig. 3.34 Results of fatigue tests on beams in bending made from various UHPC mixes (after Lappa [93])
3.8 Dynamic Actions
At high strain rates, i.e. with a very fast increase in strain over time, an increase in the tensile and compressive strengths has been observed for concrete in general. Millon and Nöldgen [95] investigated UHPC under an extremely fast tension loading rate within the scope of tests on the split Hopkinson bar. With values 5–6 at strain rate of 100 [1/s], the dynamic increase factors (DIF) observed for UHPC (see Figure 3.35) are slightly below those that are observed for normal-strength concrete.
Fig. 3.35 Dynamic increase factors for UHPC (after [95])
According to the test results obtained so far, this increase in strength should be assigned to the matrix, whereas after crack formation, the effectiveness of the fibres upon pull-out exhibits no comparable increase in stress (see Figure 3.36). Nevertheless, fibre reinforcement has proved to be very effective in slab impact tests [96]. Moreover, the very high compressive strength of UHPC is particularly important when it comes to impact loads. A good overview of the behaviour of UHPC under highly dynamic loads, its modelling and the application to building design to resist impact loads can be found in [96].
Fig. 3.36 Scheme for increasing the strength of UHPC in the case of highly dynamic tension loads
3.9 Fire Resistance
As already known from high-strength concrete, spalling can begin even during the early stages of a fire because the dense microstructure prevents the dissipation of vapour pressure caused by the elevated temperature. It was this that motivated investigations of the behaviour of UHPC under high thermal loads, i.e. in fire (see Table 3.2). The positive effect of adding polypropylene (PP) fibres is very clear. Likewise, the use of basalt sand instead of quartz sand prevented the damage due to the volume increase as a result of the quartz inversion above 573 °C, which had a positive effect.
Table 3.2 Overview of the results of fire tests [97].
| Mix | Unit | M1Q | M3Q | B1Q | B4B Basalt sand |
||||
| Steel fibres | % by vol. | 4.0 | 2.5 | 2.5 | 2.5 | 2.5 | 4.0 | 2.5 | |
| PP fibres | % by vol. | without | without | 0.30 | 0.60 | 0.60 | without | 0.30 | |
| Storage | 28d W | 28d W | 28d W | 28d W | 90 °C | 28d W | 90 °C | ||
| Load | STT 90 min |
STT 90 min |
STT 90 min |
STT 90 min |
STT 45 min |
STT 90 min |
STT 45 min | ||
| Degree of damage | − − | − − | + | + + | + | −/+ | + + | ||
| Compressive strength after loading | N/mm2 | could not be tested | could not be tested | could not be tested | 126 | 102/144 (108) | 59 | 147/149 (148) | |
| Proportion of starting value | ∼96% | ∼60% | ∼30% | ∼77% | |||||
| – – very severe damage; – severe damage; + light damage; + + no damage; W stored in water; HT heat treatment; STT standard time–temperature curve. | |||||||||
More recent investigations by Hosser et al. [98] confirm the results and add the fundamental material characteristics to our knowledge of UHPC's behaviour in fire. Such characteristics are needed for modelling and assessing behaviour in fire. Figure 3.37 shows the state of test specimens after 90 min exposure to fire (standard time–temperature curve).
Fig. 3.37 Tests to establish the spalling behaviour of 60 × 20 × 20 cm prisms with different PP fibre contents for the UHPC mixes M3Q (top) and B5Q (bottom), after [98]
The tests also established that the test specimens made from UHPC heat up faster than would be expected when performing calculations with the thermal conductivity and specific heat capacity values for normal-strength concrete. Figure 3.38 compares the thermal conductivity values for UHPC with those for high-strength concrete and the Eurocode 2 figures.
Fig. 3.38 Temperature-dependent development of thermal conductivity of B5Q and M3Q mixes with PP fibre contents of 0.75 kg/m3 (0.08% by vol.) compared with the upper bound for normal-strength concrete to EC 2-1-2 and measured results (SP Fire Technology) for high-strength concrete
Also interesting is the strength reduction for UHPC, which is much lower at high temperatures although initially a temporary drop is observed below 200 °C (see Figure 3.39).
Fig. 3.39 Temperature-dependent compressive strength of UHPC (after [98])
Further parameters can be found in [98], others are still being determined. This represents a good starting point for developing material models for use in finite element modelling to simulate the behaviour in fire. According to appropriate calculations, fire tests should be carried out in order to validate the models or gain further knowledge.
3.10 UHPC with Combinations of Fibres (‘Fibre Cocktails’)
Generally, there exist different opinions regarding the role of fibres in fibre-reinforced concrete. In conventional fibre-reinforced concrete, the fibres are relatively large compared with the grains of aggregate. When a macrocrack forms in the concrete, the fibres are activated, i.e. they bridge over the crack and resist the further opening and propagation of the crack. Seen in this way, they function similarly to classic steel reinforcing bars. But the fibres used in UHPC are much finer, which is why they are activated as early as the microcrack formation phase. So the question is whether they should be considered as reinforcement or as part of the composite material. Markovic [76] combined short and long fibres (Figure 3.40). The short fibres react as soon as microcracks start to form in the concrete, with the development of the cracks being halted immediately by the fibres. The concrete therefore behaves quasi elastically. If as a result of a further increase in load macrocracks eventually form, then the long fibres are activated.
Fig. 3.40 Combination of short and long steel fibres, where a) the short fibres already react to the formation of microcracks, and b) the long fibres do not react until macrocracks start to form [76]
Figure 3.41 shows the results of bending tests on beams made from UHPC with combinations of fibres. The tests were carried out as three-point bending tests on notched beams according to the RILEM method [53]. The beams measured 600 × 150 × 150 mm and spanned 500 mm; they had a 25 mm deep sawcut in the middle of the tension side. Various combinations of long fibres with hooked ends (l = 40 mm with df = 0.5 mm, or l = 60 mm with df = 0.7 mm) and short straight steel fibres (l = 13 mm, df = 0.20 mm) were used. The flexural tensile strength reached values of up to 45 N/mm2. The compressive strength of the concrete was approx. 120 N/mm2. It turned out that there are considerable differences between concretes reinforced with just one type of fibre and concretes reinforced with a combination of short and long fibres. Figure 3.41 shows the flexural tensile strength calculated from the test results as a function of the fibre volume for different fibre combinations. The diagram shows that a mix with 2% by vol. fibres (155 kg/m3) of length l = 13 mm has a flexural tensile strength of 25 N/mm2, whereas a mix with 1% by vol. fibres of length l = 13 mm plus 1% by vol. fibres of length l = 40 mm reaches a flexural tensile strength of 40 N/mm2. The diagram also shows that 1% by vol. short fibres (13 mm) combined with 0.5% by vol. long fibres (40 mm) leads to the same flexural tensile strength as 2% by vol. short fibres. In other words, the mechanical properties can be optimized by combining different types and quantities of fibres.
Fig. 3.41 Flexural tensile strength as a function of fibre content and fibre type for concrete with combinations of fibres (‘fibre cocktails’) [76]