Chapter Nine
Macroeconomic Effects of the Industrial Transition
9.1 Introduction
The consequences of demographic change often bring about major shifts in the structure of an economy and thus aggregate economic behavior. In this chapter we focus on the key features of these shifts. Historical economic development, as noted in Chapter Two, is distinguished from simple economic growth by including fundamental changes in the way the economy functions. Economic growth normally accounts for, and perhaps models, the changes in income and income per capita. Historically, economic development means more than economic growth; it is a wider concept. Structural shifts such as the transition from primary production to manufacturing and then to service production are among the concerns of economic development.1 In this chapter the focus is on the shifts in economic history which had macroeconomic effects that significantly affected the population and its well-being.
First is the major macroeconomic issue of our time: the demographic shock of the baby-boom of the post-World War II years and the stresses it places on the economy. There is no historical precedent for this. Next, but related, is the shift in the aggregate saving of developed economies. This is a topic much beloved of economists and, unfortunately, pretty much ignored by historians and the rest of the world despite its vital importance. This raises the further issue of how society funds an increasingly aging population. The increased dependency of the aged in the face of falling fertility and the reduced dependency of the young create a unique historical problem. The resolution of that problem is made even more critical because of the baby-boom shock. In the long run, greater saving is a sign of greater disposable income. Yet it appears that in most societies individuals use their increased income for greater control of their own time. Time allocation is the way people spend their personal time and how they make trade-offs between work (income-earning time) and personal (non-work time). This has varied both in the workplace and the home. Finally, we examine the fundamental shift in the level of human capital formation associated with the emergence of modern developed economies.
9.2 Shocks and Echoes – the Baby Boom
Whenever there is a shock or a bulge in a vital statistic, a sudden departure from the trend in birth, death, marriage, or immigration rates, there is a demographic consequence. For instance, a decrease in the marriage rate leads to a fall in the fertility rate. Subsequently, there is an echo of the original shock some time in the future. But such a shock will return with diminished amplitude. And there will be further echoes, again with further diminished amplitude, until all the effects of the original are dissipated as illustrated in Figure 9.1. The reason for the dampening effect is simply that the subsequent events are more spread out or diffuse. Take, for instance, a shock in the form of a sudden decline in the birth rate due to some exogenous factor such as war (as was discussed in Chapter Three). There should be a one-year decline in the marriage rate about 26 years on, then a one-year decline in the birth rate some time later. This accounts for the echo, but not its dissipation through time. For that we must appeal to the distribution of individual fertility; events are not exactly synchronized. In addition, there may be a declining trend as depicted in Figure 9.1.
The greatest shock of recent times is the post-war baby-boom.2 As discussed earlier, a combination of forces led to an extraordinary burst of births in the post-1945 years, especially in the immigrant-receiving countries. The postponement of children due to the depression of the 1930s, then the war with its rise in female employment and income, led to a catch-up effect. To this was added a major flow of immigrants that began once peace had been restored (to the US, Canada, Argentina, Australia, New Zealand and others). This meant that the age-structure of the immigrant-receiving countries shifted towards the young, since the migrants themselves were overwhelmingly young. The rise in the proportion of the population aged 20–40 years of age caused the rise in the CBR which persisted at a high level for about two decades. The consequence was a rise in the number of births and a consequent rise in the dependency ratio. Notice there was no rise in the net fertility rate; it continued its long-run downward trend. Because of the immigrant effect, the baby-boom lasted much longer in North America than in Western Europe. The post-war baby-boom did not peak in Canada and the United States until 1958 and 1961 respectively.
Figure 9.1 Shock and Echo Effects.
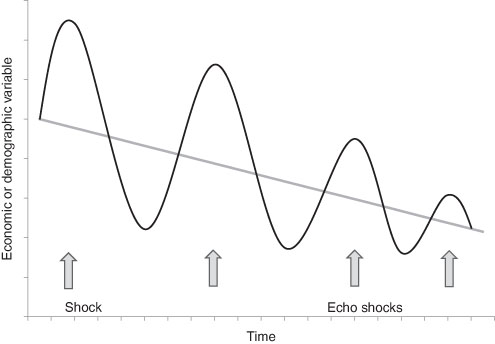
Note: Each peak and each trough is closer to the trend (mean) than the previous peak and trough as the shock spreads but dissipates.
Figure 9.2 shows the population pyramid that mimics the baby-boom. A population pyramid maps the age and sex structures of the population for any moment in time. In normal circumstances, the same number of births is repeated and the age-specific mortality does not change hence the pyramid shape. If age related mortality is low the pyramid will have steep sides; if it is high the sides will be sharply angled. By the first decade of the 21st century, that original shock of the baby-boom has worked its way through the age range, and the leading edge of that group of babies, now referred to as the boomers, is approaching retirement, ages 45 to 65. The echo phenomenon is indeed present, but weak or not so pronounced. The population pyramid also captures the low fertility of the modern era with its sharply contracted number of young children (0 to 5 in the figure).
The baby boom of the post-war period has led to several major macroeconomic stresses. New public and private investment had to be undertaken i) in the form of building the social infrastructure such as schools and universities and ii) privately to provide the housing to accommodate the boom as it grew. Maternity hospitals have to be converted to palliative care. Decommissioning the social infrastructure as the boomer demand, or its echo, passes is another problem. By far the greatest of these problems is paying for the eventual retirement of the “babies” and filling the gaps in the labor force that will be created. It is to this issue that we now turn.
9.3 Children and the Saving Shift
The dramatic rise in the economy-wide savings rates beginning in the middle of the 19th century was made possible by increasing incomes. An increase in saving relative to aggregate income meant that more investment could be financed. This freed up resources for more machinery and equipment, more social infrastructure, more manufacturing plants (and houses) along with greater inventories. These all contribute to the growth of the economy’s capital stock, that is, its productive capability.3 Historically, as aggregate income grew, saving continued to increase and contribute to yet further economic income growth and development. The rise in the saving rate tended to be slower in those countries which had experienced their industrial transition earlier in history and more rapid in those economies which followed. The follower economies were also able to access the saving of the countries that had transformed earlier in the form of capital imports which supplemented domestic saving. In the late 19th century countries such as the United States, Canada, Argentina and Australia, among others, all benefited from capital imports originating in Europe, mostly Great Britain.4 The lower saving rate in these countries in the 19th century was itself a result of higher dependency rates than those of Europe.5 (Earlier, when discussing immigration, it was seen that the countries of large net immigration had a younger age structure.) However, in the opinion of Jeffrey Williamson, the rapidity of the shift in the US saving rate at mid-19th century was accelerated due to the method of financing, and then retiring, the war-debt from its Civil War.6 Saving is made up of personal saving and the (net) saving of business and government. The financing of the war by debt issues can be thought of as a government device to force the private sector to save.
Figure 9.2 Population Pyramids, Representations.
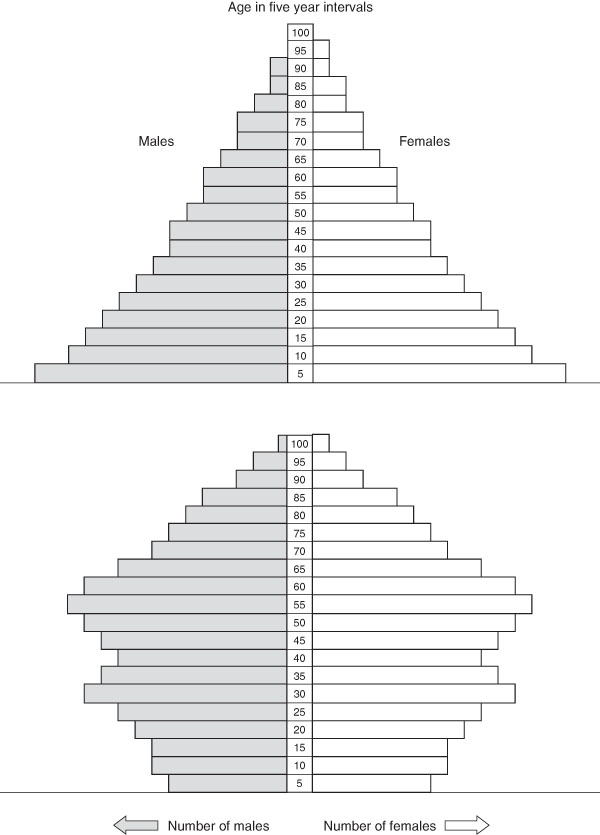
Note: The above are representative population pyramids for the early modern era with its high mortality and for the modern era in OECD and many less developed countries. The latter captures the “baby boom” of the post-1945 era.
Saving is what is left over after all expenditures are deducted from all income and is given by the following:
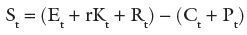
where St is saving, and income is made up of labor earnings (Et), returns at (r) rate on capital (Kt) and repayments and income from children (Rt), and expenditures are consumption (Ct ) and the rearing costs of children (Pt) where t is time.
For each individual family, child-rearing costs rise as child mortality rates drop. However, this is not a straightforward relationship. As the number of children in a family rises, they may not all attract the same rearing costs. Hand-me-down clothes, older children supervising the younger ones and other such family economies make the extra cost of the next child less than the previous one. Some claim that historians have underestimated the economies of scale of the family.7 But, it is also evident that, with the drop in child mortality, children live longer, and they incur more in rearing-costs as teenagers than they did as infants, so that costs are dependent on the age-structure of the children in the family. The net result is that, when there are fewer children, a family’s rearing costs go down but by how much is an open question. As the children age, there will be an offset in that older children cost more.8
The fall in fertility and the lowering of child mortality meant that children now survived with greater frequency. This resulted in a greater repayment contribution to family income. The prevalence of child labor suggests that some recapture of rearing costs was made quite early in the child’s life. So the Pt term falls and the Rt term rises. Although the fall in rearing costs is greater, both effects result in a rise of saving. This means the family now owns more accumulated savings, which we call capital resources Kt. This, in turn, further adds to income through the return on past savings. And, because income has now risen, more current saving is induced. This is the familiar loop that all starts with the decline in age-specific mortality – particularly among the young.9
All historical economies that passed through the demographic transition experienced a rise in the saving rate that in some part was due solely to the adaptability of the family. There was no historical norm since the elements that created the saving (rearing costs, number of children, repayments by children and accumulated savings and their rate of return) varied. Frank Lewis has estimated that about one quarter of the saving shift in the 19th century US was directly attributable to these fundamental changes in demographic behavior. For the United States, the domestic saving rate (S/GDP) rose by approximately six percentage points in the mid- to late-19th century. In the predominantly agricultural economy, thirty years prior to the US Civil War, it was about 16 % of national income. By the late 19th century the savings rate stood at about 22 % of national income and, given the relationship between savings and investment, so did the investment rate.10
Figure 9.3 Shift in the Saving Rate and Dependency in the 19th Century United States.
Sources: Gallman, 1966; Haines, 2006, US Historical Statistics, Table Ab315–346.
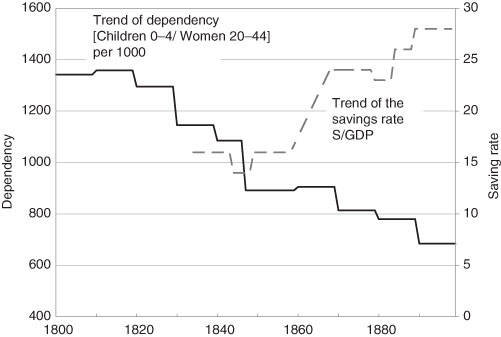
The greatest single economic action of individuals causing the aggregate saving rate to increase was, not surprisingly, the movement from rural to urban places. Opportunities in urban areas in the form of higher wages offered the possibility of a higher income than could be earned by remaining in a rural area. At the start, specialization in the farm-service sector (e.g., meatpacking) and the demand for urban goods and services (e.g., transport) accelerated the trend. Incentives to have fewer children, as has been noted, came to predominate. Figure 9.3 shows the decline in child dependency and the rise in the saving rate in the US in the 19th century.
9.4 Intergenerational Contracts or Life Cycles: Pensions
The industrial transition, the growth in income and the increase in life expectancy gave rise to a large, older, non-working population. This led to a problem: how does society fund the growing aged dependency ratio? It is a modern problem not only because of the unprecedented extension of life expectancy in recent years, but also the rapid decline in the net reproduction rate and the baby-boom generation that is fast approaching retirement. A perfect storm of old-age!
In a simple steady-state world, without demographic change, the model of peasants and pensions in Chapter Four suggests a method of funding pensions through the extended family. At the family level, the current generation has less consumption in order that the older generation has some. At the same time provision must be made for the children; they are the pension givers to the next generation of the elderly – their parents. We can think of this as a tax on the current working generation to finance the dependent young and old.
Figure 9.4 Percentage of Inactive Population Aged 65 and Over to the Total Labor Force.
Source: data from OECD (2008) Factbook 2007 .
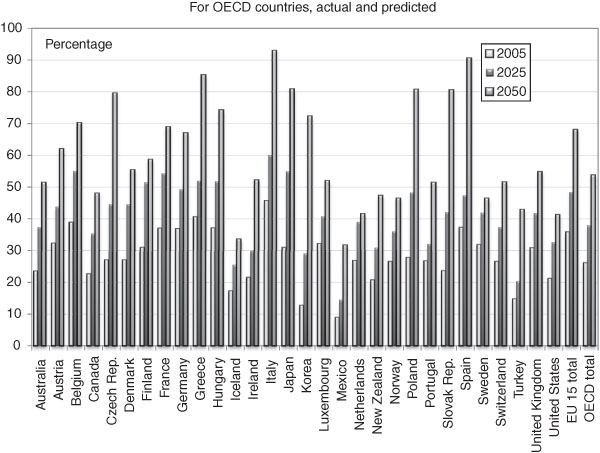
In theory, a state can act much as the simple family economy. In reality, many states do not. For those who do, at the aggregate level, the state acts as the re-distributor of income among generations. It taxes people during their working lives and pays out during their old age. In a steady state, it does both simultaneously knowing that the revenues will always occur in about the same amount as the payouts required. In so acting, the state is both an inter-generational transfer device and an insurer– offering insurance against the risk of ungrateful offspring or grateful but impecunious children, no children, or no surviving male children. This can only be sustained, however, if the proportion of the dependent aged is not increasing. But the proportions are changing and are projected to do so for some time as illustrated for the OECD countries in Figure 9.4.
But most governments are more than a simple transfer device. They are also mandated to achieve income redistribution goals, some more and some less. Theoretically, nobody is left to starve and die on the streets, although some still do even in the most prosperous of countries. These two roles, however, are in conflict and lead to several basic problems with the inter-generational transfer of retirement funding. They are:
i) What should the state do with the elderly who have never worked and therefore never been taxed? The list is surprisingly long: many married women, the injured, the mentally and physically disabled and the feckless who have never worked.11
ii) Should the state provide everyone with the same retirement benefit regardless of their contribution to taxes or should the benefits be proportional to their tax contributions?
There is a trade-off between equity considerations and the willingness of the current working generation to be taxed.
In practice, the state has encouraged part of this function of funding retirement to be assumed by private pension plans through the use of tax incentives – what economists call a tax expenditure. But the principle is the same; tax the current workers to fund the retirement of the former workers. This introduces discrimination based on pay that leads to higher pensions for the higher income earners since such pensions usually promise a percentage of salary on retirement. But this strategy leads to yet further problems. If no funds are set aside for future pensions, the corporation, firm or even government agency (including legislators) has assumed a potentially huge unfunded liability. Of course, if a firm carries such unfunded pension liabilities, it can go out of business, and those contributing to its private pension scheme are left empty-handed. For this reason, the courts in most jurisdictions have accorded the pension plan the first right to the firm’s surviving assets. So, most firms actually amass a fund of the excess of payments into and out of the plan. When this is done in conjunction with the employees (who also pay in) or their representatives (such as a union) and a neutral agent manages the fund, the plan is outside of the company control. The result is that it reduces the unfunded liabilities and gives some security of funding for future pensioners. If, however, the company simply amasses the fund on its own account, it accomplishes the former but leaves the employees exposed to the risks of corporate use of the fund (and possible loss) and corporate failure.
The only other method of providing for retirement is the life cycle approach. Each working generation finances its own retirement through savings set aside for that purpose. Contributions are made to private plans, typically by both the employer and the employee, and these savings are then invested and secured against default. They are not available until a fixed age or retirement date. If a plan experiences excess gains, earnings greater than accountants estimate are necessary for future pensions, those gains are accumulated by the firm and either kept by it or passed on to the members as reduced premiums. Such pensions are defined benefit schemes. Typically a defined benefit scheme promises a percentage of salary per year or percentage of some average salary. Often such schemes are portable so there is no, or little, pension benefit loss when moving employment. An alternative scheme which is increasingly popular is the defined contribution one. In this case, the employer and employee make regular contributions, say 5 % of salary each, and the funds are vested, solely for the use of the employee upon retirement. Defined benefit and defined contribution are different in one important regard: any gains in the defined contribution pension fund from the investment by the fund manager accrue only to the worker. Upon retirement the employee is entitled to a lump-sum payment which typically must be used to purchase an annuity or committed to some other approved financial plan. Most jurisdictions offer some tax-sheltering to the pension fund (tax is paid not when the funds are first received, but when they are received as pension) thus increasing its value. Not unreasonably, the fund, at retirement, must be used for the intended purpose.
Pension Terms and Issues
Life Annuity: a financial instrument which makes regular (e.g. monthly) payments to individuals for the rest of their lives. It is purchased from an insurance company (usually) and the payments are determined by the purchase price, average life expectancy of the group and the rate of return on the funds not yet disbursed. Various types of life annuities can be purchased: fixed for a certain number of years, joint and last survivor (for spouses), inflation indexed, and so on.
Defined Benefit Plan: a plan which defines a retirement benefit such as, the average salary over the best five years’ employment (usually the last five years) × some fraction (0.65 is common). Typically both the employer and employee contribute. There may be other benefits such as continued health insurance or life insurance.
Defined Contribution Plan: a plan that defines the contributions of the employer and the employee to the pension plan. Such a plan is usually administered by a third party trust. On retirement the individual is given a lump-sum which is the accumulated total contributions and the compound earnings on these contributions over time. Typically, this lump-sum is used to purchase a life annuity although other investment options are available in some jurisdictions.
Tax Subsidized Retirement Plans: a plan where the state permits payments into the scheme to be non-taxable benefits. There are limits to how much one can contribute in any year – usually some percentage of income such as 7.5 %. Accumulated earnings of the plan are also free of tax. However, when withdrawals are made (through an annuity, for instance) they are taxed as income. In order to avoid using such schemes as a method of estate building and avoiding tax altogether a minimum amount of withdrawal is usually required each year. Some of the schemes below are on this general type.
For an international comparison of various state pensions see: Wakeham (2003). A thorough review of social security schemes is: United States (2009).
Pensions are not equal in amount if they provide a payment stream that is based on (or are proportional to) salary or income contributions. As such they discriminate on the basis of the acquired labor market characteristics (education, initiative, aptitude, periods of employment and so on) that determine wages and salaries. However, let’s consider a case of what the labor market might consider non-discrimination. A male and female of exactly the same age had identical educations and employment histories. Each received the same salary at similar points in their careers and has made similar contributions to a pension fund which earned an identical rate of return on investments. Both decided to retire at age 65 and had identical sums for the purchase of an annuity. So far these individuals are identical in all vital respects, and each has ended their working lives with the same pension endowment. They have been treated equitably. But life expectancy at age 65 is greater for women than for men. The lump-sum pension endowment, and its subsequent earnings, has to be spread over more years for the woman and, hence, her monthly pension income in retirement would be lower than that of the man. So a non-discriminating society ends up treating the woman differently by the standard of monthly, or annual, pension payments. How did we end up here?
On the presumption that society does not wish to discriminate among individuals based on arbitrary personal characteristics which are those assigned simply by being born (ethnicity, race, gender and so on), but does wish to discriminate among acquired labor market characteristics, there is only one possible solution to this ethical dilemma. Even if it were possible, we cannot pay women more simply because they are women in order to give them a large enough pension endowment at age 65 to provide the same monthly income as a man. (A corollary is that woman should not be paid less than men based only on gender.) So the ethical solution is to average the male and female life expectancy tables to reflect unisex life expectancy values. The identical woman and man receive the same compensation throughout their lives and end up with similar pension payments.12 Many national, state and provincial governments and public institutions have adopted unisex life tables for calculating pension payouts. Few jurisdictions, however, have mandated the use of the unisex life table for pension payments.
Public pensions for the elderly do not follow a common pattern country to country. Yet, most are based on contributions deducted from income or wages as a tax, usually at the source of employment – and remitted from tax revenue. However, individual eligibility varies as does the adequacy of funding with respect to the actuarial goals. Social Security in the US, the State Pension in the UK and the Canada Pension Plan, for instance, are all funded in a different manner. Only the last of these three is actuarially sound. However, all of these countries and most of Western Europe and Canada offer additional plans that are based on funding out of current tax revenues – old age security schemes and income supplements. Herein lie important demographic issues. The population changes that have taken place in the past fifty years or so, increasing dependency and falling fertility, guarantee an increasing need for tax revenue. Indeed, the future tax burden well could be unsupportable. In recognizing this, some measures already have been taken. For instance, the UK Government has announced an increased eligibility age for the State Pension which will be raised to age 68 for both men and women over the course of the next few years. Current eligibility is 65 years of age for men and 60 for women. France, Germany and the US have done the same. While these changes violate the implicit contract with workers, they may be tolerated by them so long as the changes are small. This is politically dangerous territory: anger the taxpayer or anger those receiving or expecting a certain level of retirement funding. Most governments have also begun the transition from an inter-generational mode of funding to that based on a life cycle approach.
In the late 19th century the “age of retirement” was declared to be 70 years of age by the autocratic Prussian Chancellor Otto von Bismarck. Paternalistic in nature, his social policy had the laudable aim of providing a comfortable end to the few final years of life otherwise spent in drudgery. A modest state pension financed the individual’s retirement from the workplace. In a rush of similar late Victorian sentiment, many nations copied this policy. Retirement was later reduced to 65 years of age. The cost was not great as the pensions were small and the pensioners did not live much beyond age 65. Private pension plans followed suit, and the mandatory retirement age soon became the norm for members of these plans. These pension plans ran into the actuarial problem of increasing life expectancies of the elderly. This placed additional financial pressure on them. In recent years, the economic and financial burden bumped into another concern, the civil or human rights one. The heart of the issue was a particular view of contesting “rights.”
Discrimination on the basis of age was explicit in most of the public and private pension arrangements. Yet, many nations have a prohibition against age-related discrimination in their constitutions, bills, charters and declarations of rights, and by legislation supporting and clarifying human rights.13 Australia, Canada and the United States, for instance, have more or less abandoned mandatory retirement as required by their courts interpreting domestic law (they still have a minimum age eligibility for age-related benefits). Other nations have prohibitions on age related discrimination, but they do not extend that beyond “retirement age.” The United Kingdom, to note one country, has laws against age discrimination in the workplace but also has a national default retirement age of 65 (soon to be raised as noted above). Although a worker can request continued employment beyond their normal retirement date, this is only a right “to be considered.”14 Both the UN and European human rights charters are hopelessly vague on age discrimination, although they are quite forthright on other forms of discrimination.15 The Court of Justice of the European Communities has recently upheld compulsory retirement policies if they produce a national social benefit. Individual rights and social rights are put in conflict. For instance, age discrimination is permitted in the UK and justified because a national employment strategy exists – although one is hard pressed to find out what it is.16 In general, there is no certainty that such policies as employment strategies make economic sense despite government claims. As in the British case, to claim that workers must exit the labor market in order to create room for new entrants is a short-run (static) argument, at best short-sighted and wrong in any other time-frame with flexible factors of production and an open immigration policy.
The European so-called solution to the graying of the labor force is to rely on a steady inflow of immigrants, with the appropriate levels of human capital, to forestall market shortages. Of course, many non-European countries also have adopted this policy. The immigrants lower the average age of those being taxed. But, such policy alternatives are, by themselves, doomed to fail eventually. Only if impossibly large immigration flows took place (and they were continued in the future) could such a policy succeed. The only reasonable solution is the extension of the working life and the introduction of greater flexibility about the age of retirement. This makes sense given the greater life expectancy and heightened awareness of the equity issues.17 The underlying and immediate issue is the demographic bulge that has been working its way through most economies since the end of World War II by raising the dependency ratio.
9.5 The Work-Leisure Choice
The choice between work and non-work, called leisure time, if made voluntarily is another choice with macroeconomic consequences. The choice is one of the affluent and resulted from the long-term rise in workers’ per capita income. By revealed preference, workers historically have altered their desired time-pattern of daily work, especially in the manufacturing and service sectors. Workers chose to work less. That is, they chose to take more leisure. (In this context leisure is defined as any time not at work.) In the US, before the Civil War, the workday was from sunup to sundown. Between the Civil War and the World War I, the average hours per day spent in manufacturing occupations dropped steadily, slowly at first and then more rapidly – see Table 9.1. The gain of leisure came from both the reduction of hours spent working each day and the reduction of the number of days worked. The practice of only working a half day on Saturdays became more common. This change in the amount of social time or leisure came about because workers could afford it. The rise in real wages and the fact that proportionately more workers were in the high-wage sector (a result of the industrial shift) meant workers earned more discretionary income. In addition, in some decades, the relative decline in immigration meant that greater attention had to be paid to the demands of domestic workers – for instance, the decades of the 1860s, 70s, and 90s.18 The increasing pressure to reduce the hours of work was evident through labor unions, government legislation at the state and federal level, and the popular sentiment for social reform. This gain in leisure time was not restricted to manufacturing. Indeed the US federal government’s first major intervention to control the hours of work was in the government (service) and later transportation services. Twenty years before the US Civil War a ten-hour day was mandated in the federal civil service.19 However, it was not until the 20th century that similar legislation was passed which regulated the hours of work of non-federal employees.
Table 9.1 Estimates of the Average Hours Worked Per Day in US Manufacturing, 1850–1919.
Source: adapted from Cain and Paterson (1981).
| Year | Average Hours Worked Per Day |
| 1850 | 11.0 |
| 1860 | 11.0 |
| 1880 | 10.5 |
| 1890 | 10.3 |
| 1900 | 9.8 |
| 1909 | 9.5 |
| 1919 | 8.7 |
In all European countries that record statistics on the hours of work, an increase in leisure time similar to that in the US and Canada occurred during the first half of the 20th century. The British gain of leisure time was slightly earlier than that in most other European countries. Reduction of the hours of work often took the form of defining a Saturday as a half day of work. The British Factory Act of 1874 became the model by dictating early Saturday closing in the textile industry. By 1920 the tendency was to demand the elimination of some or all Saturday employment. While in countries such as the US, Canada, and the UK, some gains were made in the late 19th century, the major reduction in the hours of work came in the first half of the 20th century. Unfortunately international comparisons are inconsistent in data coverage and definition so ranking the gains is not possible. Nevertheless, the gains in France may have been as high as 28 % (1900–1952).20 At mid-20th century Europeans tended to work slightly longer (44 hours per week) than Americans and Canadians (approximately 40 hours a week). But Europeans tended to have more holidays (which are not part of the computation). Today they are essentially the same, below 40 hours – apart from the longer holidays.21 Of course, there were variations in the short-run. In the inter-war period some of the reduction in the hours of work was a social response to unemployment as a method of work-sharing (unions), and, as in the British coal mining industry, some additions to hours worked were a demand from employers. However, despite the variation, the long-run trend was for a reduction in the hours worked.
The demand for leisure can be thought of in the continuum of time. Time, say an hour, may be used for either work or leisure but clearly not both at the same time. (This is not to argue that some jobs do have a pleasurable component.) If we value the opportunity cost of time, as the wage rate increases the price of non-working – leisure time becomes more expensive. That is, a worker has to forgo an hour of work, an hour’s income, to purchase an hour of leisure time. Normally we would expect an increase in the price to reduce consumption of the good in question. But, as we have seen, there was an absolute decline in the working week. Leisure is a normal good, one which is consumed in greater quantities the more income rises. As the price of leisure rose, the effect of increased income (more consumption of leisure) overcame the effect of the increased relative price of leisure (less consumption of leisure).22 A recent study in the UK found that, at the existing wage rate, British workers would prefer about 4.3 hours per week more leisure than they are currently consuming.23 The actual hours of work are greater than the desired hours of work. We suspect that the results of this large-scale British survey are perfectly general in the high income per capita countries.
Modern studies of leisure time use show that we increasingly absorb our free time with socializing with friends, arts and culture, watching television (more for men and less for women), sports (watching), and active leisure activities including sports participation. Even those engaged in active sports and similar activities spend more time watching television and for the population as a whole it is more than twice as much than active pursuits.24 Clearly our passivity is a cause of the obesity crisis of recent years (see Chapter Eight). But how did the demand for more leisure time manifest itself in the mid-19th century when it first became evident in the decline of time at work?
Popular entertainment, including sport, flourished as the working week shrank in the mid-19th century. Additional leisure time created opportunities for both players and spectators. For example, in England, informal games resembling football (soccer) trace back millennia, but interscholastic competition between English schools were common by 1848.25 After graduation, former students formed clubs in their home cities. Eventually all-star elevens began to compete. The Football Association was formed in 1863. Eight years later, the year that baseball’s National Association was formed in the United States, the association established the FA Cup, an open-entry tournament still in existence.
The Gymnacyclidium: All the Rage in 1869
With growing disposable income, individuals regaled themselves of many new entertainments during the second half of the 19th century: the music halls, vaudeville, spectator and participation sports amongst others. The gymnacyclidium was clearly not for the faint-hearted and catered to a younger set.
Source: Library of Congress, Prints and Photographs Division, Washington.

During the last quarter of the century, working-class English men increasingly played football and imitated the club structure. Oxbridge graduates, over-represented both in the Football Association administration and the football-playing population in and around London, refused to play against anyone who was paid to play. Industrial worker-players from the Midlands and the north of England, however, could ill afford trips to distant games as the majority continued to be held outside employment.26 Given England’s compactness, football teams and their fans could leave for most away games Saturday at noon (the end of the British working week until the 1950s), play a game against a closely-matched opponent in the late afternoon, and return home Saturday evening.27
In a similar fashion, a few years later in the Northeastern United States, baseball evolved from rounders, a popular children’s game. Young men formed social clubs that made arrangements for fields where members could play. The game spread rapidly among the troops during the US Civil War and among the population at large when the troops returned home.28 In 1862 William Cammeyer made his Brooklyn property available free to local clubs that agreed to let him charge spectators admission.29 His innovation spread quickly, but soon the teams began to collect the revenues. When receipts surpassed operational expenses, the surplus was used to entice “crack” players away from other teams, though players of more modest talent expected no compensation.30 Eventually club all-star “first nines” began to travel to play other clubs’ all-stars, but there was no consolidated schedule or championship until the formation of the National Association. The greater distances in the United States meant that quality baseball teams had to travel so far that no player could maintain outside employment during the season. Similarly, few supporters could travel to away games, so attendance was almost exclusively local fans. The entire roster of a top American baseball team became fully professional of necessity. Sport had become entertainment, the opportunity to witness the spectacle of professional sport.
Workers also had more leisure time to take an active part in sport. Many factories sponsored work teams both in Europe and North America. Many of these date to the later part of the 19th century. For families, more time was available for entertainment which was supported by the rising incomes. Pianos became a popular purchase for the more affluent families. Sing-songs around the piano became a feature of family life.31 For the less affluent, and outside the home, minstrel shows were popular events in North America prior the Civil War to be replaced by vaudeville later in the 19th century. In Britain music halls thrived.32 Usually for men alone, bars and public houses absorbed some of the growing income and expanding leisure hours in alcohol consumption. Since it led to the inevitable social problems and over-spending, thus taking away some of the families’ core income, it spawned an active temperance movement that was especially virulent in the US.
To summarize, as incomes rose, as economic growth and development took place working hours began to decrease as a result of a general demand for more leisure. The increase in leisure time led to increased participation in activities that spawned entirely new industries.
A Football (Soccer) Team
Immigrant communities often centered their social activities in clubs. Here the Vancouver Chinese Student Football team in 1926 provided both a sports outlet for these strapping young men and a source of pride for their fellow citizens, especially as they were cup winners.
Source: The Wallace B. Chung and Madeline H. Chung Collection, University of British Columbia.

9.6 Time Spent in Household Work
The drop in aggregate work hours, the increase in leisure time, is often assumed to have led to a dramatic decrease in the time devoted to household work over the first two-thirds of the 20th century. The usual support proffered for this assumption focuses on the diffusion of household appliances that contributed to a reduction in the time required for household production and a reduced cost of having children. The former increased the labor force participation of women; the latter contributed to the baby boom.33 However, there is no consensus on whether the facts confirm the assumption.
Economists who argue that the facts are in agreement with the assumption generally follow the work of Stanley Lebergott who made rough estimates of the time housewives spent on home production.34 Valerie Ramey has argued that Lebergott based his estimates, inadvertently, on “the wrong table in a key dissertation and on the assumptions of a social activist (Charlotte Gilman) who conducted no study.”35 Other economists, following on the work of Ruth Schwartz Cowan (1983), maintain that, while technology has reduced the drudgery of home production, it did not reduce the time. Cowan notes:
modern technology enabled the American housewife of 1950 to produce single-handedly what her counterpart of 1850 needed a staff of three or four to produce: a middle-class standard of health and cleanliness …
Cowan (1983).
By the 1950s the new household technologies and their spread had broken down the older social indicators that marked different levels of personal cleanliness and domestic hygiene.
During the first half of the 20th century, while electricity, gas, and water were being diffused, knowledge was being diffused to housewives that maintaining a clean house and preparing nutritious meals could improve the health of their families. Joel Mokyr (2000), attempting to explain what he termed “the Cowan Paradox,” argued that standards of cleanliness and nutrition were increasing at the same time, so that the output of household production rose substantially.
Ramey, focusing exclusively on US data, calculated that, rather than a reduction of the approximately 42 hours per week that Lebergott reported for the period 1900 to 1966, it fell by only six hours for prime age women, and “all of that change could be accounted for by the number and age of children and the increased education levels of housewives.”36 Further, the time spent in home production by prime age men increased by seven hours over the same period. Over the next ten years, women continued to devote less time to home production, a reduction of nine additional hours, while the time spent by men only increased by an hour. The time spent by prime age individuals on average rose a little between 1900 and 1965, then fell by four hours from 1965 to 1975. Over the last quarter of the 20th century, Ramey estimates that hours for prime age individuals fell slightly and then recovered. If the contributions of children and older adults are included in the calculation, time spent in home production per capita, increased by about two hours over the century.
Data from a large number of countries assembled by the Multinational Time Use Study (MTUS) tell a similar story for a more recent period. In the MTUS coding, household work comprises seven major activities: Cooking/Washing Up, Housework, Odd Jobs, Gardening, Shopping, Child Care, and Domestic Travel.37 Most of these involve several individual activities that may have been reported individually in a national study. For example, Domestic Travel is defined to include such activities as accompanying an adult or child (e.g., taking them to a doctor or to school), travel to and from shopping, and travel to take care of someone else. The MTUS currently has 39 such studies that are coded in a consistent format. Table 9.2 reports the average hours per week women and men each report they expend on household work. Average hours are calculated here only for individuals 18–64 years of age who report that they are not a student. The studies are identified by the country and the year they began. Four did not report numbers for all seven activities, and those are duly noted by an asterisk in the table. The first study was done in 1961; the last, in 2003. The statistical relationship of hours of household work by sex versus year, with controls for the countries with multiple studies (Canada, Netherlands, Norway, UK, and US) suggests women annually reduced the amount of time they spent on household work by 9.5 minutes over those years. Men annually increased the amount of household work they did by 13.0 minutes over the same period. This means that over this 42-year period, the total time men and women spent doing household work annually increased by 3.5 minutes per year, or just under 2.5 hours in total.
Table 9.3 looks at the seven categories for the US individually to better understand what underlies these changes. A simple comparison of the results for 1965 with those for 2003 suggests that the reduction in women’s time is largely attributable to Cooking/Washing up and Housework; the other five categories all involved an increase in time. The amount of time men spent in household work increased in every category. While men cook and wash up 0.8 hours more than they once did, the reduction of 6.7 hours for women is the biggest single change observed. Once again this suggests the microwave oven played an important role, as did dishwashing machines and the sale of prepared foods. Indeed, a significant portion of the price of food now is attributable to the labor of others. Men have increased the amount of housework they do, but women’s time has gone down. This calls attention to the increase in the number and efficiency of household appliances and products.
Table 9.2 Average Weekly Hours of Household Work, Various Countries, 1960s to Present.
Source: Multinational Time Use Study data base.
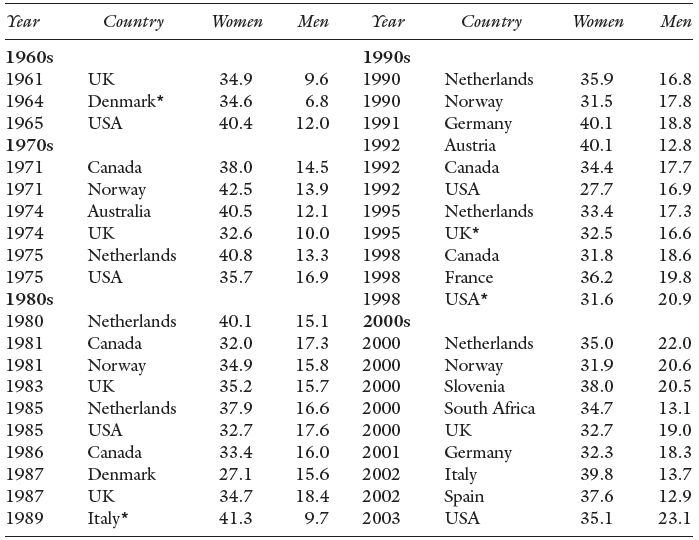
Note: * Did not include information on all categories as earlier surveys.
Table 9.3 Average Weekly Hours Spent in Household Tasks, the US, 1965–2003.
Source: US Multinational Time Use Study data base.

nr – not reported.
This simple impression seems statistically true.38 The time women spent on Cooking/Washing up declined an annual average of 11.6 minutes per hour. This is same reduction as the total, meaning that the annual 5.8 minutes per hour reduction in Housework was cancelled by small increases in the other five activities. Men, on the other hand, increased the time they spent on every activity with the largest increase coming in Housework (an annual average increase of 4.5 minutes per hour). The overall annual increase in total time spent by men on household work, 14.7 minutes per hour, was greater than the decrease calculated for women.
If one adds women’s and men’s times together, even though there are many different living arrangements in the data from married couples to single individuals, the total time spent in household work increased annually by 3.1 minutes per hour between 1965 and 2003, or a total of just less than 2.0 hours in the US. This is roughly one half hour less than the average of 2.5 hours for all the countries in Table 9.2. In sum, the weight of the evidence agrees with Ruth Cowan. The two categories on which much of the literature has focused, Cooking/Washing up and Housework, are the only two to show a decrease in the US data. These two, and only these two, agree with Stanley Lebergott. Both Shopping and Domestic Travel show increases of roughly 2.5 hours each, and one suspects this is largely attributable to the amount of time spent driving. The move from neighborhood stores to shopping malls and supermarkets and the involvement of children in more activities to which they are chauffeured for safety reasons involves greater distances, therefore more time.
Given the wide variety of activities that comprise household work, it should not be surprising that, as leisure hours increased, the amount of time committed to household work increased. While that work has come to involve less cooking and cleaning, we’ve used the hours that have been freed to garden, shop, and give our children a better quality of life – coaching their softball, soccer and hockey teams, for instance.
9.7 Education and Human Capital
In addition to the remarkable increase in physical capital that economic development made possible, the improvement in human capital was vital to the improvement in productivity and consequently individual well-being as we have seen throughout. From society’s point-of-view, the increase of human capital formation was vital to both continued growth and development. Modern economists typically measure human capital in terms of years of formal education, but this may obscure other important contributions. For instance, apprenticeship schemes and on-the-job training are not typically counted when the years of schooling are assessed. The result is that we may under-estimate the amount of human capital embodied in the work force. Also not counted are the skills which are passed from parent to child such as those skills involved in farming. Nonetheless, the substantial differences in schooling are one of the distinguishing features of economic development. The least developed countries of today have educational levels lower than those of most of the OECD countries during the mid-19th century. This has been a substantial brake on their ability to improve the well-being of their populations.
In production, increases in the quality of labor make us capable of more and more complex tasks. A unit of labor today is not, on average, the same as a unit of labor historically. So the quality improvement of labor yields a direct gain in output. In addition, changes in aggregate productivity seem largely related to changes in human capital in an indirect way. For instance, the quicker the response of labor to incentives, such as higher wages, the quicker factors will be shifted from the lower to higher output activities (at the margin). So a high degree of industrial, occupational and geographic mobility helps move both labor and capital to their more efficient end-use more rapidly.
In history a major improvement in aggregate human capital came about as adult mortality began to decline, albeit slowly, in Europe and North America in the 17th century. To be sure, there was much variation, but the trend of decline in adult mortality is evident in most available data from Western Europe and North America (Chapter Three). When someone’s life is extended, obviously society has access to their human capital longer (even if it depreciates, which itself is an open question). Society saves the resources which otherwise would have to be spent more frequently to train replacements for that person. This is similar to the savings that lead to economic growth when human capital simply arrives embodied in immigrants. Consider carpenters of a certain life expectancy which suddenly rises. Society now has to spend less per year on training carpenters to maintain the same level of services – the same amount has to be spent to train one carpenter in total, but it is spent less frequently. In addition, and in aggregate, a decline in the adult mortality rate means that the economy now has more people in the working-age group, and this gives rise to an increased (derived) demand for human capital formation – more carpenters. This change in the composition of the population with its reduced dependency ratio often has been called the compositional effect.
The second aggregate consequence of the increased adult longevity is that it increased the pay-offs to investment in human capital – particularly education – due to the increased growth in aggregate income and the increased length of the pay off period (even when the future is discounted). Even though these effects were small, they did contribute a large proportion of the income gain in the immediate pre-modern and early modern periods, approximately 1675–1800. Thus, a rise in the life expectancy was a long-run source of economic growth.39
It is likely that some degree of literacy was necessary to build upon these gains noted above. Perhaps not surprisingly, by the 15th and 16th centuries it was the city states of Italy which likely had the highest proportions of their populations literate. In the 1560s, in Venice, about 26 % of the males of school age (up to 15 years of age) attended school, although very few girls did. Most of these schools were communal and secular in nature. Many of them taught mathematics and, what we would call, “business studies” with double entry book-keeping a key subject. The net result was that one-third of the male population and one-eight of the female population was literate – the girls having been home-coached, sent to private tutors or learned to read and write in Sunday school.40 The story is similar throughout Renaissance Italy. Other countries with high degrees of literacy for the times were Switzerland, Scotland, Germany (Prussia), the Netherlands and the Scandinavian countries – although we cannot be exact because of the absence of historical data. What researchers have proven, rather than simply surmised, is that literacy and quantitative reasoning (numeracy) are highly correlated and that both were more highly developed in Western Europe than Eastern Europe. This cognitive trait gave Western Europe a decided advantage by the early 1600s, and possibly earlier, to seed commercial development that was a prelude to agricultural and then industrial revolutions.41
As early as the mid 19th century there was concern in England that it was being outstripped by German and North American education. Table 9.4 shows a German–English gap of about 1.12 years in the average educational attainment. Notably, as Jason Long reports, Prussia had introduced mandatory school attendance in 1763; England did not do the same until 1870. A 19th century attempt to raise school attendance by direct subsidies to privately-run schools produced only a small aggregate gain.42 At mid 19th century most Prussian children attended school while only about one-half of the English children did. The individual return to primary education in Britain was low compared to other countries. This is a sign that either the labor markets were not inducing the occupational mobility that other countries were or that the education itself was of low quality.43 With educational accomplishment of only four to five years of school, a gap of over a year is significant because it is near the literate retention threshold – many adults with low levels of schooling forget their juvenile writing and reading abilities. If the comparison with Germany was galling to the British, the comparison between North American and the British children was even more so – see Table 9.4. In fact, the rise of schooling in Britain during the late 19th century was largely due to more girls entering the school system and not existing groups staying longer. And, for some decades, notably the 1880s, there was actually a decline in the hours spent in school by teenagers.44 The Elementary Education Act of 1870 (England and Wales) had little observed effect beyond the targeted group of very young children. Historians have often pointed to this educational gap as one of the sources of the poor productivity record of Britain in the half century before World War I relative to those countries with higher proportions of their labor force with higher levels of schooling.
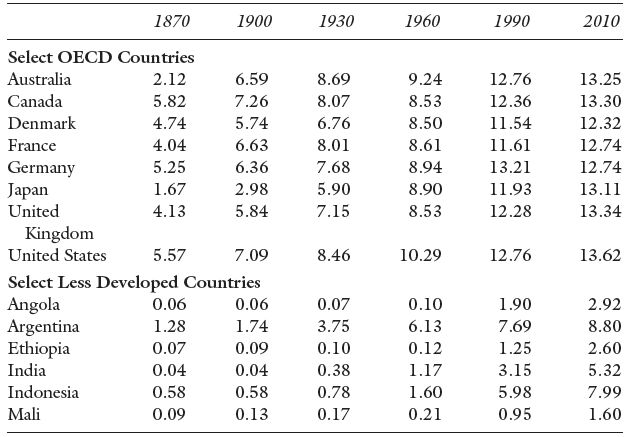
Table 9.4 Average Number of Years of Schooling of the Adult Population (15 to 64 Years of Age) of Selected Countries, 1870–2010.
Source: adapted from Morrison and Murtin (2009), Table 3.
No country with a wide educational gap between itself and the leading countries closed it more effectively than Japan. With the Meiji Government which took power in 1868 educational reform began, slowly at first. The educational goals were i) to become accessible – previously it had been class based – and ii) to contribute to the modernization of the economy by building up the human capital stock. By the 1880s the Japanese government had a national system of compulsory elementary school education, but it explicitly rejected Western models at the elementary and high school levels. One of the by-products of this choice was that the system tended to become nationalistic which indirectly supported the cult of militarism in the years after World War I. This necessitated further reforms in the post 1945 period.45 For university education the model was German. The broad political support of education and a vigorously growing economy meant that by 1930 much of the gap between Japan and the West had been closed. By the 1960s Japanese workers had achieved the country’s long-term goals of educational parity with the West. But, they achieved more. The Japanese educational system has a substantially lower drop-out rate through to high school than other OECD countries.46 This means that Japan not only has a high average level of educational accomplishment but a lower variance in achievement. Although Japanese economic growth has stalled in recent years, the long-term improvement in Japanese well-being was a direct product of the national education strategy.
A national strategy for educational improvement is often held only to be possible in a culturally homogeneous society such as Japan. But, in fact, it was the culturally diverse United States with its large immigrant population that achieved the highest (average) levels of education both in the 19th and 20th centuries. It came in two phases. First was the drive for compulsory primary education funded from local taxation. Second was what Claudia Goldin and Lawrence Katz have called ‘the Great Transformation in American education’. Between 1910 and 1940 secondary school education became available to far more teenagers than in most other countries. The high school movement was the result of a no great political, national strategy, but it came from a general sense (indicated by economic factor such as higher wages) that this would improve the lives of individual citizens. It was financed as local supply responses to a demand for education that produced high differential rates of return. The egalitarian nature of the school system for the most part, the greater ability to absorb taxes than elsewhere – given the higher per capita income and wealth – and local consensuses were factors in the success of the high school movement.47 Homogeneity of the population was important but only at the local school level and even then it was more about shared educational goals – how to use schooling to get ahead – rather than being culturally similar.
After World War II the great mushrooming of university enrollment was felt throughout the OECD countries. It happened more quickly in the US than elsewhere. The same trend, albeit somewhat slower, was evident in France and Germany; Britain lagged. Despite the high differential pay-off to increased schooling in the US, the rate of return to schooling in fact fell through most of the 20th century – until about 1980. At this point the skill premium, as this differential rate of return is often called, began to increase. Its rise was coincident with the technical revolution wrought by micro-chips and computers. The 20th century trend of declining personal income inequality was reversed in the last two decades of the century. The 20th century also saw the long decline in fertility; the opportunity cost of having children increased. This was itself a product of the reduced barriers facing women in formal education as well as a result of the skills premium. However, as seen elsewhere, those with lower levels of schooling or training and income tend to have a greater number of children than those with higher individual levels of human capital.
Even within the countries of the developed world, some groups did not share equally in their countries’ education gains during the 20th century. This was more acute in the US than elsewhere. Without direct national funding, for the most part, its educational system was hostage both to the local willingness and local ability to provide the instruction for its school-aged population. For instance, it took about two generations for blacks who were the grandchildren of slaves to achieve the same level of literacy, occupational status and income as free black citizens’ descendants. But the human capital gap between black and white Americans tended to converge even more slowly.48 The educational gap was a product of several historical forces. First, blacks mostly lived in the South which after the US Civil War was a low income per capita region. It had less to spend on education. This affected all students, black and white. Second, restrictive legislation (called Jim Crow laws in the US although the name has no particular meaning) and racial segregation in the schools existed until the 1960s with its inevitable consequences of discrimination against black youngsters. Fewer resources were devoted to their schooling. Third, for black students the marginal gains to be made from remaining in school were lower than those of whites given the racial discrimination in the workplace. The Great Migration out of the South changed the background conditions as did a radical change in social attitudes, but it took a long time for black and white parity. Today, for the US as a whole, the high school completion rate for black students is the same as the US average – slightly higher for white students and lower for those of Hispanic ethnicity.49 This is a remarkable change from as recently as 40 years ago when black student high school completion rates were significantly lower.
At the aggregate level the labor productivity gains accounted for by schooling can be thought of as in part transitional and in part sustainable or on-going. Transitional gains accrue because of changes in the educational system, an increasing proportion of investment devoted to education. Sustainable gains are those that occur due to the high quality of the labor force to work with (exogenous) technical change. Since per capita investment in schooling grew in the 20th century until at least the third quarter, part of the 20th century growth of income in OECD countries was transitional. In the future these countries will have to rely on labor productivity growth that is sustainable which is estimated to be about 1 % annually for the US – compared to the combined effects of 1.6 % in the 100 years since 1870.50 Such evidence should be encouraging for the planners in the less developed countries of today. Countries such as those of sub-Saharan Africa with their low levels of schooling in the work force (Angola, Ethiopia and Mali for instance) can gather substantial productivity gains both from the transitional effects by increasing the share of investment in education and from sustainable productivity growth. Unfortunately, alone this will not do, as the human capital must have co-operating factors of production and institutions that are sympathetic to economic development.51
Historical shifts in the pattern of education, saving, inter-generational transfers and time allocation are all aggregate effects. They took (take) place relatively slowly. However, there were other shifts in the historical economies and their populations that were deleterious and, either rapid or slow, but inexorable. These we call catastrophes, the subject of the next chapter.
Endnotes
1 David and Wright (1997).
2 One of the most popular treatments of this subject is Foot (1996).
3 This is the process known as “capital deepening.” See Cain and Paterson (1981); (1986) and Wright (1990).
4 Edelstein (1982).
5 Taylor and Williamson (1994).
6 Williamson (1974).
7 Kelley (1976).
8 David and Sanderson (1987); Turchi (1975).
9 Lewis (1983).
10 Lewis (1983); Williamson (1974).
11 There is a separate argument that the married women with children should be recognized as having contributed to GDP by providing child-rearing services and home care. This, it is argued, should entitle them to a pension that is proportional to their services valued at market prices for the services.
12 Some would argue that this means that in retirement men cross-subsidize women. Such an argument entirely misses the point, however. A Rawlsian definition of equity says that gender should never distinguish parts of the human family.
13 For instance: The Age Discrimination in Employment Act of 1967 and The Older Workers Benefit Protection Act of 1990, United States (1967 and 1990).
14 United Kingdom (2009).
15 United Nations (1948).
16 The Court of Justice of the European Communities (2007), Case C–388/07.
17 Maestas and Zissimopoulos (2010).
18 Whaples (1990).
19 Johnson and Libecap (1994).
20 McCormick (1959).
21 Ibid.
22 This results in the familiar backward bending supply of labor.
23 Stewart and Swaffield (1997).
24 Canada (current), Table 113-0001; for the UK see Lader, Short Gershuny (2006); The American Time Use Study can be accessed at http://www.bls.gov/news.release/pdf/atus.pdf
25 Young (1975) and Harris (1975). See Cain and Haddock (2005).
26 London’s well-heeled amateur Old Etonians traveled to Lancashire to take on working-class Darwen. “The result was a draw, but Darwen were unable to travel to London for the replay. The Etonians offered to pay their fares, but the Darwen players simply could not afford the loss of wages….” Harris (1975).
27 In 1885, the Football Association reluctantly voted to allow payment for “broken time,” or wages lost while playing and traveling. Harris (1975).
28 Harris (1975); Eckard (2005).
29 Kirsch (1989).
30 Within a year of Cammeyer’s innovation the Brooklyn Eagle reported, “ballplaying has become quite a moneymaking business, many finding it to pay well to play well” (Rader, 2002).
31 Pianos were among the first goods to be sold on credit, an arrangement that requires consumers to earmark future saving to pay for past consumption.
32 For a history of British music hall see Bailey (1986). For North American vaudeville see Bordman (2004).
33 See Greenwood, Seshadri and Yorukoglu (2005); Albanesi and Olivetti (2009). All have argued that improvements in reproductive medicine and the invention of infant foodstuff, often called formula, were important to the increase in women’s labor force participation.
34 Lebergott (1976, 1993). See also Fogel (2000); Folbre and Nelson (2000).
35 Ramey (2009).
36 Ramey (2009). Lebergott (1976) excludes the care of the family; Ramey includes it.
37 This is a slightly different definition than that used by Ramey, so the numbers are not strictly comparable.
38 Confirmed by regressions run for each activity and the sum.
39 Using data from Geneva and Venice, Boucekkine, de la Croix and Licandro (2003) estimate that the contribution of increased human capital may have been responsible for 70 % of the differential growth rate, 28 % from a ‘composition effect’ and 42 % from increased levels of education.
40 Grendler (1989).
41 A’ Hearn, Baten and Crayen (2009) argue that there was a closer correspondence between the east and west earlier in history and that the two areas diverged in proportionate literacy and numeracy for about 1000 years before the modern era. They have since converged.
42 Mitch (1986).
43 Long (2006).
44 Lord and Rangazas (2006).
45 Schoppa (1991).
46 Blinco (1993).
47 Goldin and Katz (2001 and 2008); Morrisson, Christian and Fabrice Murtin (2009).
48 For a cohort of blacks and whites that was born between 1950 and 1954 the white-black educational gap was 0.78 years, Sacerdote (2005). Collins and Margo (2003) also provide evidence of black school attendance based on Census data.
49 This is based on those 18 to 24 years of age who are not currently enrolled in secondary schools, United States (2009), Table 10.
50 Rangazas (2002).
51 Jones (2005).
References
A’Hearn, Brian, Dorothee Baten and Joerg Crayen (2009) “Quantifying Quantitative Literacy: Age Heaping and the History of Human Capital”, Journal of Economic History, 69(3), 783–808.
Albanesi, Stefania and Claudia Olivetti (2009) “Gender Roles and Medical Progress,” National Bureau of Economic Research, Working Paper No. 14873, April.
Bailey, Peter, ed. (1986) Music Hall: The Business of Pleasure, Milton Keynes, England: Open University Press.
Blinco, Anne (1993) “Persistence and Education: A Formula for Japan’s Economic Success”, Comparative Education, 29(2), 1–183.
Bordman, Gerald Martin, ed. (2004) The Oxford Companion to American Theater, New York: Oxford University Press.
Boucekkine, Raouf, David de la Croix and Omar Licandro (2003) “Early Mortality Declines at the Dawn of Modern Growth”, The Scandinavian Journal of Economics, Population Dynamics and Macroeconomic Performance, 105(3), 401–18.
Cain, Louis P. and David D. Haddock (2005) “Similar Economic Histories: Different Industrial Structures: Transatlantic Contrasts in the Evolution of Professional Sports Leagues,” Journal of Economic History, 65(4), 1116–47.
Cain, Louis P. and Donald G. Paterson (1981) “Factor Biases and Technical Change in Manufacturing: The American System, 1850–1919”, Journal of Economic History, 41(2), 341–60.
Canada (current) Indicators of Well-being in Canada, Human Resources and Skills Development Canada, Ottawa: www4.hrsdc.gc.ca.
Collins, William J. and Robert A. Margo (2003) “Historical Perspectives on Racial Differences in Schooling in the United States”, National Bureau of Economic Research, NBER Working Paper 0714352.
Cowan, Ruth Schwartz (1983) More Work for Mother: The Ironies of Household Technology from the Open Hearth to the Microwave, New York: Basic Books.
David, Paul and Gavin Wright (1997) “Increasing Returns and the Genesis of American Resource Abundance”, Industrial and Corporate Change, 6, 203–45.
David, Paul and Warren Sanderson (1987) “The Emergence of a Two-Child Norm among American Birth Controllers”, Population and Development Review, 13(1), 1–41.
Eckard, E. Woodrow (2005) “Team Promotion in Early Major League Baseball and the Origin of the Closed Sports League,” Explorations in Economic History, 42(1), 122–52.
Edelstein, Michael (1982) Overseas Investment in the Age of High Imperialism: The United Kingdom, 1850–1914, New York, Columbia University Press.
Fogel, Robert William (2000) The Fourth Great Awakening and the Future of Egalitarianism, Chicago: University of Chicago Press.
Folbre, Nancy and Julie Nelson (2000) “For Love or Money – Or Both?” Journal of Economic Perspectives, 14(4), (Autumn), 123–40.
Foot, David with Daniel Stoffman (1996) Boom, Bust and Echo: How to Profit from the Coming Demographic Shift, Toronto: Macfarlane Walter & Ross.
Gallman, Robert (1966) “Gross National Product in the United States, 1834–1909”, in Dorothy S. Brady, ed., Output, Employment and Productivity in the United States after 1800, Studies in Income and Wealth, New York: National Bureau of Economic Research by Columbia University Press.
Goldin, Claudia and Katz, Lawrence (2001) “The Legacy of the US Educational Leadership: Notes on Distribution and Economic Growth in the 20th Century,” American Economic Review, 91(1), 18–23.
Goldin, Claudia and Katz, Lawrence (2008) The Race between Education and Technology, Cambridge, Mass.: Belknap Press of Harvard University Press.
Greenwood, Jeremy, Ananth Seshadri and Guillaume Vandenbroucke (2005) “The Baby Boom and Baby Bust,” American Economic Review, 95(2), 183–207.
Greenwood, Jeremy, Ananth Seshadri and Mehmet Yorukoglu (2005) “Engines of Liberation,” Review of Economic Studies, 72(1), 109–33.
Grendler, Paul F. (1989) Schooling in Renaissance Italy: Literacy and Learning, 1300–1600, Baltimore: The Johns Hopkins University Press.
Haines, Michael R. (2006) Historical Statistics of the United States, Ab315–346.
Harris, Harold Arthur (1975) Sport in Britain: Its Origins and Development, London: Stanley Paul.
Johnson, Ronald N. and Gary D. Libecap (1994) The Federal Civil Service System and the Problem of Bureaucracy: The Economics and Politics of Institutional Change, Chicago: University of Chicago Press.
Jones, Gavin W. (2005) “Human Capital Aspects of Economic Development: A Comparative Perspective in Asia”, in eds. Shripad Tuljapurkar, Ian Pool and Vipan Prachuabmoh, Wiphan Pracˇhuˉapmo Ruˉpfoˉloˉ, Population, Resources and Development, Riding the Ages Waves, Vol. 1, The Netherlands: Springer.
Kelley, Allen C. (1976) “Savings, Demographic Change, and Economic Development”, Economic Development and Cultural Change, 24(4), 683–93.
Kirsch, George B. (1989) The Creation of American Team Sports: Baseball and Cricket, 1838–7, Urbana: University of Illinois Press.
Lader, Deborah Sandra Short and Jonathan Gershuny (2006) The Time Use Survey, 2005; How We Spend Our Time, London: Office for National Statistics.
Lebergott, Stanley (1976) The American Economy, Princeton: Princeton University Press.
Lebergott, Stanley (1993) Pursuing Happiness, Princeton: Princeton University Press.
Lewis, Frank D. (1983) “Fertility and Savings in the United States: 1830–1900”, Journal of Political Economy, 91(5), 825–40.
Long, Jason (2006) “The Socioeconomic Return to Primary Schooling in Victorian England”, Journal of Economic History, 66(4), 1026–53.
Lord, W. and P. Rangazas (2006) “Fertility and Development: The Roles of Schooling and Family Production”, Journal of Economic Growth, 11, 229–61.
Maestas, Nicole and Julie Zissimopoulos (2010) “How Longer Work Lives Ease the Crunch of Population Aging”, Journal of Economic Perspectives, 24(1), 139–60.
McCormick, Brian (1959) “Hours of Work in British Industry”, Industrial and Labor Relations Review, 12(3), 423–33.
Mitch, David F. (1986) “The Impact of Subsidies to Elementary Schooling on Enrolment Rates in Nineteenth-century England”, Economic History Review, 39(3), 37I–9I.
Mokyr, Joel (2000) “Why Was There More Work for Mother? Technological Change and the Household, 1880–1930,” Journal of Economic History, 60(1) (March), 1–40.
Morrisson, Christian and Fabrice Murtin (2009) “The Century of Education”, Journal of Human Capital, 3(1), 2–42.
Rader, Benjamin G. (2002) Baseball: A History of America’s Game, 2nd edn, Urbana: University of Illinois Press.
Ramey, Valerie A. (2009) “Time Spent in Home Production in the 20th Century United States,” Journal of Economic History, 69(1), 1–48.
Rangazas, Peter (2002) “The Quantity and Quality of Schooling and US Labor Productivity Growth (1870–2000)”, Review of Economic Dynamics, 5, 932–64.
Sacerdote, Bruce (2005) “Slavery and the Intergenerational Transmission of Human Capital”, The Review of Economics and Statistics, 87(2), 217–34.
Schoppa, Leonard James (1991) Education Reform in Japan: A Case of Immobilist Politics, London: Routledge.
Stewart, Mark B. and Joanna K. Swaffield (1997) “Constraints on the Desired Hours of Work of British Men”, Economic Journal, 107, 441, 520–35.
Taylor, Alan M. and Jeffrey G. Williamson (1994) “Capital Flows to the New World as an Intergenerational Transfer”, Journal of Political Economy, 102(2), 348–70.
The Court of Justice of the European Communities (2007) Case C-388/07, curia.europa.eu/en/actu/communiques/cp09/aff/cp090019en.pdf
Turchi, Boone A. (1975) The Demand for Children: The Economics of Fertility in the United States, Cambridge, Mass.: Ballinger.
United Kingdom (2009) Age Discrimination, Direct Government. http://www.direct.gov.uk/en/Employment/DiscriminationAtWork/DG_10026429
United Nations (1948) Universal Declaration of Human Rights, Adopted and proclaimed by General Assembly resolution 217 A (III) of 10 December 1948. http://www.un.org/events/humanrights/2007/udhr.shtml
United States (1967, 1990) The Age Discrimination in Employment Act of 1967 and The Older Workers Benefit Protection Act of 1990, United States Equal Employment Opportunity Commission, http://www.eeoc.gov/index.html
United States (2009) Dropout and Completion Rates in the United States, 2007, Department of Education, National Center for Education Statistics, Washington: http://www.nces.ed.gov/pubs2009/
United States (2009) Social Security Programs Throughout the World, Social Security Administration, Office of Policy, Washington: http://www.ssa.gov/policy/docs/progdesc/ssptw/
Voth, Hans-Joachim (2001) Time and Work in England 1750–1830, Oxford: Oxford University Press.
Wakeham, Lawrence (2003) State Pension Models, Occasional Paper, London: Pensions Policy Institute. http://www.pensionspolicyinstitute.org.uk
Whaples, Robert (1990) “Winning the Eight-Hour Day, 1909–1919”, Journal of Economic History, 50(2), 393–406.
Williamson, Jeffrey (1974) “Watersheds and Turning Points: Conjectures on the Long-Term Impact of Civil War Financing”, Journal of Economic History, 34(3), 636–61.
Wright, Gavin (1990) “The Origins of American Industrial Success, 1879–1940”, American Economic Review, Vol. 80, No. 4. (Sept.), 651–68.
Young, Percy M. (1975) A History of British Football, London: Stanley Paul.