EARTH’S LIMITS : WHY GROWTH WON’T RETURN
The 2008 crude oil price, $147 per barrel, shattered the global economy. The “invisible hand” of economics became the invisible fist, pounding down world economic growth to match the limitations of crude oil production.
— Kenneth Deffeyes (petroleum geologist)
We have just seen why, since 2007, growth has languished for reasons internal to the world financial system — the system of money and debt.
Problems arising from speculative overreach, real estate bubbles, and the inherent Ponzi dynamics of our global debt-based financial structures are endemic and profound. Still, if these were our only difficulties, we might reasonably expect that eventually, once they are sorted out (however painful the process may be), growth will return.
Indeed, that is what nearly everyone assumes. It’s a matter of “when,” not “if ” growth resumes.
But there are seldom-acknowledged factors external to financial and monetary systems that are effectively choking off efforts to restart growth. These factors, whose impacts are worsening over time, were briefly alluded to in the Introduction; here we will unpack them in more detail, discussing limits to oil and other energy sources, as well as to food, water, and minerals. We will also explore the increasing cost of industrial accidents and environmental disasters — and why, in the wide wake of global climate change, those costs are likely to escalate to the point that disaster avoidance and recovery will constitute a major portion of future government and private spending. Along the way, we will examine how markets respond to resource scarcity (it’s not a clear-cut matter of incrementally rising prices).
Crucially, in this chapter we will see how and why the most important of these non-financial limits to economic expansion are matters of concern not just for future generations, but for markets and policy makers — indeed, for everyone — today.
Oil
In the Introduction we briefly surveyed the Peak Oil scenario and the events surrounding the oil price spike of 2008. It is tempting here to launch into a lengthy discussion of Peak Oil and what it means to industrial society. I’ve been writing about this subject for over a decade, and it would be easy to fill the space between these covers simply with updates to existing publications. But that’s not what is required here; for our immediate purposes, all that is needed is an overview of some main points regarding oil depletion that are relevant to the question of whether and how economies can continue growing. Readers who wish to know more about Peak Oil should refer to sources listed in the end notes.1
When discussion turns to the economy, most of the ensuing talk tends to focus on money — prices, wages, and interest rates. Yet as important as money is to economies, energy is even more basic. Without energy, nothing happens — quite literally. Energy is not just a commodity; it is the prerequisite for any and all activity. No energy, no economy. (In the next chapter we will examine the argument that we can produce economic growth while using less energy — by using energy more efficiently; our conclusion will be that this is possible only to a limited extent and in situations that differ fundamentally from our current one.)
The massive worldwide economic growth of the past two centuries was enabled by humanity’s newfound ability to exploit the cheap, abundant energy of fossil fuels. There were of course other factors at work — including division of labor, technological innovation, and increased trade. But if it weren’t for oil, coal, and natural gas, we would today all probably be living an essentially agrarian existence similar to that of our 18th-century ancestors — though perhaps with a few additional though minor wind-and water-powered industrial accouterments.
Growth requires not just energy in a general sense, but forms of energy with specific characteristics. After all, the Earth is constantly bathed in energy — indeed, the amount of solar energy that falls on Earth’s surface each hour is greater than the amount of fossil-fuel energy the world uses every year. But sunlight energy is diffuse and difficult to use directly. Economies need sources of energy that are concentrated and controllable, and that can be made to do useful work. From a short-term point of view, fossil fuels proved to be energy sources with highly desirable characteristics: they could be extracted from Earth’s crust quite cheaply (at least in the early days), they were portable, and they delivered a lot of energy per unit of weight and/or volume — in most instances, far more than the firewood that people had been accustomed to using.
Oil has the particular advantage of being a liquid, which means that it (and its refined products like gasoline and jet fuel) can easily be stored in tanks and pumped through pipes and hoses. This effectively maximizes portability. As a result, oil has become the basis of world transport systems, and therefore of world trade. If the oil stops flowing, global trade as we know it grinds to a standstill.
The phrase “Peak Oil” is often misunderstood to refer to the total exhaustion of petroleum resources — running out. In fact it just signifies the period when the production of oil achieves its maximum rate before beginning its inevitable decline. This peaking and declining of production has already been observed in thousands of individual oilfields and in the total national oil production of many countries including the US, Indonesia, Norway, Great Britain, Oman, and Mexico. Global Peak Oil will certainly occur, of that there can be no doubt. There is still some controversy about the timing of the event: has it already happened, will it occur soon, or can it be delayed for many years or even decades?
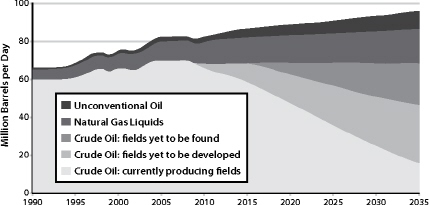
In 2010, the International Energy Agency settled the matter. In its authoritative 2010 World Energy Outlook, the IEA announced that total annual global crude oil production will probably never surpass its 2006 level.2 However, the agency fudged the question a bit by declaring that the peak was not due to geological constraints, and that total volumes of liquid fuels (including crude oil, biofuels, synthetic oil from tar sands and coal, and natural gas liquids like butane and propane) will continue to grow — just a bit — until 2035. In discussing the IEA report, a few analysts declared that these latter claims were essentially just efforts to avoid panicking the markets.3
BOX 3.1 Oil Shock 2011?
In the early months of 2011 street demonstrations erupted in Iraq, Iran, Tunisia, Egypt, Bahrain, Yemen, Libya, and Algeria. Libya became mired in civil war, and its rate of oil exports fell from 1.3 million barrels per day to a small fraction of that amount. In Saudi Arabia, banned opposition groups threatened a “day of rage.” In response to these events, the world oil price — already in the $90 range — shot up to $120. Comparisons with the economic oil price spike of 2008, and its consequences, were inevitable.
Many in the US cheered as decrepit dictators in Egypt and Tunisia fell, and as Gaddafi’s hold on Libya seemed to loosen. But as it became apparent that more democracy for North African and Middle Eastern nations would translate to higher gasoline prices for American motorists, the real motives for, and costs of Western nations’ decades-long support for autocratic regimes in oil-rich nations became starkly apparent. This was a strategy to enforce “stability” among exporters of the world’s most important energy resource, but it was wrong-headed from the start because it could not be sustained on the backs of millions of people with rising expectations but declining ability to afford food and fuel.
If, somehow, serious political disruptions are confined to Libya, Egypt, Tunisia, and Bahrain, oil-importing nations may be able to weather 2011 with minimal GDP declines resulting from $100 oil prices. But it may be only a matter of time until Saudi Arabia is engulfed in sectarian and political turmoil, and when that happens the world will see the highest oil price spike ever, and central banks will be powerless to stop the ensuing economic carnage.
Scientists who study oil depletion begin with the premise that, for any non-renewable resource such as petroleum, exploration and production proceed on the basis of the best-first or low-hanging fruit principle. Because petroleum geologists began their hunt for oil by searching easily accessible onshore regions of the planet, and because large targets are easier to hit than small ones, the biggest and most conveniently located oilfields tended to be found early in the discovery process.
The largest oilfields — nearly all of which were identified in the decades of the 1930s through the 1960s — were behemoths, each containing billions of barrels of crude and producing oil during their peak years at rates of from hundreds of thousands to several millions of barrels per day. But only a few of these “super-giants” were found. Most of the world’s other oilfields, numbering in the thousands, are far smaller, containing a few thousand up to a few millions of barrels of oil and producing it at a rate of anywhere from a few barrels to several thousand barrels per day. As the era of the super-giants passes, it becomes ever more difficult and expensive to make up for their declining production of cheap petroleum with oil from newly discovered oilfields that are smaller and less accessible, and therefore on average more costly to find and develop. As Jeremy Gilbert, former chief petroleum engineer for BP, has put it, “The current fields we are chasing we’ve known about for a long time in many cases, but they were too complex, too fractured, too difficult to chase. Now our technology and understanding [are] better, which is a good thing, because these difficult fields are all that we have left.”4
The trends in the oil industry are clear and undisputed: exploration and production are becoming more costly, and are entailing more environmental risks, while competition for access to new prospective regions is generating increasing geopolitical tension. The rate of oil discoveries on a worldwide basis has been declining since the early 1960s, and most exploration and discovery are now occurring in inhospitable regions such as in ultra-deepwater (at ocean depths of up to three miles) and the Arctic, where operating expenses and environmental risks are extremely high.5 This is precisely the situation we should expect to see as the low-hanging fruit disappear and global oil production nears its all-time peak in terms of flow rate.

FIGURE 21. Liquid Fuels Forecast, 1990–2035. Source: International Energy Agency, World Energy Outlook 2010.
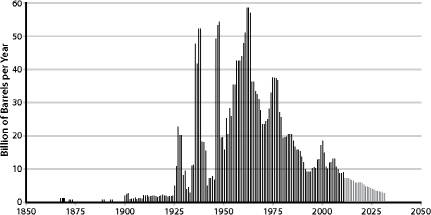
FIGURE 22. World Oil Discoveries. Source: Colin Campbell, 2011.
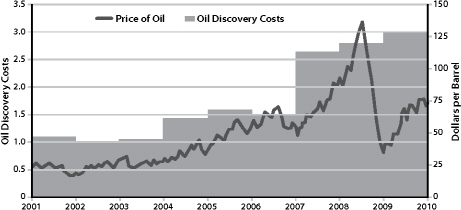
FIGURE 23. Oil Discovery Costs. Source: Thomson Reuters, Wood Mackenzie Exploration Service.
While the US Department of Energy and the IEA continue to produce mildly optimistic forecasts suggesting that global liquid fuels production will continue to grow until at least 2030 or so, these forecasts now come with a semi-hidden caveat: as long as implausibly immense investments in exploration and production somehow materialize. This hedged sanguinity is echoed in statements from ExxonMobil and Cambridge Energy Research Associates, as well as a few energy economists. Nevertheless, it is fair to say that most serious analysts now expect a near-term (i.e., within the current decade) commencement of decline in global crude oil and liquid fuels production. Prominent oil industry figures such as Charles Maxwell and Boone Pickens say the peak either already has happened or will do so soon.6 And recent detailed studies by governments and industry groups reached this same conclusion.7 Toyota, Virgin Airlines, and other major fuel price-sensitive corporations routinely include Peak Oil in their business forecasting models.8
Examined closely, the arguments of the Peak Oil naysayers actually boil down to a tortuous effort to say essentially the same things as the Peaksters do, but in less dramatic (some would say less accurate and useful) ways. Cornucopian pundits like Daniel Yergin of Cambridge Energy Research Associates speak of a peak not in supply, but in demand for petroleum (but of course, this reduction in demand is being driven by rising oil prices — so what exactly is the difference?).9 Or they emphasize that the world is seeing the end of cheap oil, not of oil per se. They point to enormous and, in some cases, growing petroleum reserves worldwide — yet close examination of these alleged reserves reveals that most consist of “paper reserves” (claimed numbers based on no explicit evidence), or bitumen and other oil-related substances that require special extraction and processing methods that are slow, expensive, and energy-intensive. Read carefully, the statements of even the most ebullient oil boosters confirm that the world has entered a new era in which we should expect prices of liquid fuels to remain at several times the inflation-adjusted levels of only a few years ago.
Quibbling over the exact meaning of the word “peak,” or the exact timing of the event, or what constitutes “oil” is fairly pointless. The oil world has changed. And this powerful shock to the global energy system has just happened to coincide with a seismic shift in the world’s economic and financial systems.
The likely consequences of Peak Oil have been explored in numerous books, studies, and reports, and include severe impacts on transport networks, food systems, global trade, and all industries that depend on liquid fuels, chemicals, plastics, and pharmaceuticals.10 In sum, most of the basic elements of our current way of life will have to adapt or become unsupportable. There is also a strong likelihood of increasing global conflict over remaining oil resources.11
Of course, oil production will not cease instantly at the peak, but will decline slowly over several decades; therefore these impacts will appear incrementally and cumulatively, punctuated by intermittent economic and geopolitical crises driven by oil scarcity and price spikes.
Oil importing nations (including the US and most of Europe) will see by far the worst consequences. That’s because oil that is available for the export market will dwindle much more quickly than total world oil production, since oil producers will fill domestic demand before servicing foreign buyers, and many oil exporting nations have high rates of domestic demand growth.12
BOX 3.2 The Mutually Reinforcing Conundrums of Peak Oil and Peak Debt
The energy returned on the energy invested (EROEI) in producing fossil fuels is declining as we finish picking the low-hanging fruit. According to Charles Hall, who has conducted pioneering studies on “net energy analysis,” the EROEI for oil produced in the US was about 100 to one in 1930, declined to 30:1 by 1970, and then to 12:1 by 2005. EROEI figures for coal and gas are also declining, as the easily accessible, high-quality resources are used first.
As EROEI declines over time, an ever-larger proportion of society’s energy and resources need to be diverted towards the energy production sector.
Meanwhile, in the social sphere, since money comes into existence via loans but the interest to service those loans isn’t created at the same time, the amount of total interest due, society-wide, grows each year.
Thus in the same way that lower EROEI necessitates a shift in investment of energy and other resources from non-energy sectors of the economy towards the energy sector, the interest-servicing requirement of our monetary system diverts more and more resources from the non-finance productive economy towards interest payments.
The result: with time, less of both energy and money are available to support basic processes of production and consumption that drove economic growth earlier in the cycle and that support the needs of the population.13
Other Energy Sources
Oil is not our only important energy source, nor will its depletion present the only significant challenge to future energy supplies. Coal and natural gas are also pivotal contributors to global energy; they are also fossil fuels, are also finite, and are therefore also subject to the low-hanging fruit principle of extraction. We use these fuels mostly for making electricity, which is just as essential to modern civilization as globe-spanning transport networks. When the electricity goes out, cities go dark, computers blink off, and cash registers fall idle.
As with oil, we are not about to run out of either coal or gas. However, here again costs of production are rising, and limits to supply growth are becoming increasingly apparent.14
The peak of world coal production may be only years away, as discussed in my 2009 book Blackout: Coal, Climate and the Last Energy Crisis. Indeed, one peer-reviewed study published in 2010 concluded that the amount of energy derived from coal globally could peak as early as this year.15 Some countries that latched onto the coal bandwagon early in the industrial period (such as Britain and Germany) have been watching their production decline for decades. Industrial latecomers are catching up fast by depleting their reserves at phenomenal rates. China, which relies on coal for 70 percent of its energy and has based its feverish economic growth on rapidly growing coal consumption, is now using over 3 billion tons per year — triple the usage rate of the US. Declining domestic Chinese coal production (the national peak will almost certainly occur within the next five to ten years) will lead to more imports, and will therefore put pressure on global supplies.16 We will explore the implications for China’s economy in more detail in Chapter 5.
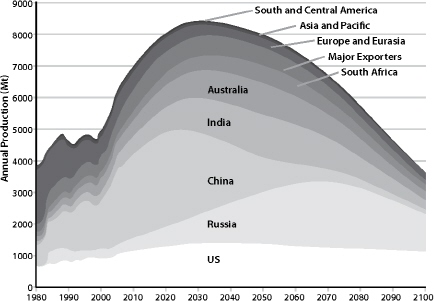
FIGURE 24. World Coal Production Forecast. Source: Energy Watch Group, 2007.
In the US, most experts still rely on decades-old coal reserves assessments that are commonly (though erroneously) interpreted as indicating that the nation has a 250-year supply. This reliance on outdated and poorly digested data has lulled energy planners, policy makers, and the general public into a dangerous complacency. In terms of the energy it yields, domestic coal production peaked in the late 1990s (more coal is being mined today in raw tonnage, but the coal is of lower and steadily declining energy content). Recent US Geological Survey assessments of some of the most important mining regions show rapid depletion of accessible reserves.17 No one doubts that there is still an enormous amount of coal in the US, but the idea that the nation can increase total energy production from coal in the years ahead is highly doubtful.
Add to this an exploding Chinese demand for coal imports, and the inevitable result will be steeply rising coal prices globally, even in nations that are currently self-sufficient in the resource. Higher coal prices will in turn torpedo efforts to develop “clean coal” technologies, which on their own are projected to add significantly to the cost of coal-based electricity.18
OECD energy demand declined in response to the 2008 financial crisis. If financial turmoil (with resulting reductions in employment and consumption) were to continue in the US and Europe and spread to China, this could help stretch out world coal supplies and keep prices relatively lower. But an economic recovery would quickly lead to much higher energy prices — which in turn would likely force many economies back into recession.
The future of world natural gas supplies is a bit murkier. Conventional natural gas production is declining in many nations, including the US.19 However, in North America new unconventional production methods based on hydro-fracturing of gas-bearing rocks of low permeability are making significantly larger quantities of gas available, at least over the short term — though at a higher production cost. Due to the temporary supply glut, this higher cost has yet to be reflected in gas prices (currently many companies that specialize in gas “fracking” are subsisting on investment capital rather than profits from production, because natural gas prices are not high enough to make production profitable in most instances).20 Higher-than-forecast depletion rates add to doubts about whether unconventional gas will be a global game-changer, as it is being called by its boosters, or merely an expensive, short-term, marginal addition to supplies of what will soon be a declining source of energy.21
Can other energy sources replace fossil fuels? Some alternatives, such as wind, are seeing rapid growth rates, but still account for only a minuscule share of current global energy supplies. Even if they maintain high rates of growth, they are unlikely to become primary energy sources in any but a small handful of nations by 2050.
BOX 3.3 Applying Time to Energy Analysis
by Nate Hagens (Excerpted with permission)
Biological organisms, including human societies both with and without market systems, discount distant outputs over those available at the present time based on risks associated with an uncertain future. As the timing of inputs and outputs varies greatly depending on the type of energy, there is a strong case to incorporate time when assessing energy alternatives. For example, the energy output from solar panels or wind power engines, where most investment happens before they begin producing, may need to be assessed differently when compared to most fossil fuel extraction technologies, where a large portion of the energy output comes much sooner, and a larger (relative) portion of inputs is applied during the extraction process, and not upfront. Thus fossil fuels, particularly oil and natural gas, in addition to having energy quality advantages (cost, storability, transportability, etc.) over many renewable technologies, also have a “temporal advantage” after accounting for human behavioral preference for current consumption/return.
In social circumstances where lower discount rates prevail, such as under government mandates and/or in generally more stable societies, longer term energy output becomes more valuable. Less stable societies with higher discount rates will likely handicap longer energy duration investments, as the cost of time will outweigh the value of delayed energy gains. Also in the context of general limits to growth, it is worth noting the evidence that stressed individuals exhibit higher discount rates.
Taking into account time discounting, the EROEI of oil tends to get higher (that is better), while the EROEIs of wind, solar, and corn ethanol tends to get worse. The future energy gain associated with [wind] turbines has decreasing value to users when either (a) the expected lifetime increases or (b) the effective discount rate increases.27
If one of the limits to growth consists of limits to capital, then energy sources that tie up capital for a disproportionate length of time before yielding an adequate energy return could be problematic.
In 2009, Post Carbon Institute and the International Forum on Globalization undertook a joint study to analyze 18 energy sources (from oil to tidal power) using 10 criteria (scalability, renewability, energy density, energy returned on energy invested, and so on). While I was the lead author of the ensuing report (Searching for a Miracle: Net Energy Limits and the Fate of Industrial Societies), my job was essentially just to synthesize original research and analysis from many energy experts.22 It was, to my knowledge, the first time so many energy sources had been examined using so many essential criteria. Our conclusion was that there is no credible scenario in which alternative energy sources can entirely make up for fossil fuels as the latter deplete. The overwhelming likelihood is that, by 2100, global society will have less energy available for economic purposes, not more.23
Here are some relevant passages from that report:
A full replacement of energy currently derived from fossil fuels with energy from alternative sources is probably impossible over the short term; it may be unrealistic to expect it even over longer time frames.... [U]nless energy prices drop in an unprecedented and unforeseeable manner, the world’s economy is likely to become increasingly energy-constrained as fossil fuels deplete and are phased out for environmental reasons. It is highly unlikely that the entire world will ever reach an American or even a European level of energy consumption, and even the maintenance of current energy consumption levels will require massive investment.... Fossil fuel supplies will almost surely decline faster than alternatives can be developed to replace them. New sources of energy will in many cases have lower net energy profiles than conventional fossil fuels have historically had, and they will require expensive new infrastructure to overcome problems of intermittency.24
Some other studies have reached different, more sanguine conclusions. We believe that this is because they failed to take into account some of the key criteria on which we focused, including the amount of energy returned on the energy that’s invested in producing energy (EROEI). Energy sources with a low EROEI cannot be counted as potential primary sources for industrial societies.25
As a result of this analysis, we believe that the world has reached immediate, non-negotiable energy limits to growth.26
BOX 3.4 Net Energy
This “balloon graph” of US energy supplies (Figure 25), developed by Charles Hall of the State University of New York at Syracuse, represents the net energy (vertical axis) and quantity used (horizontal axis) of various energy sources at various times. Arrows show the evolution of domestic oil in terms of EROEI and quantity produced (in 1930, 1970, and 2005), illustrating the historic decline of EROEI for US domestic oil. A similar track for imported oil is also shown. The size of each “balloon” represents the uncertainty associated with EROEI estimates. For example, natural gas has an EROEI estimated at between 10:1 and 20:1 and yields nearly 20 quadrillion Btus (or 20 exajoules). “Total photosynthesis” refers to the total amount of solar energy captured annually by all the green plants in the US including forests, food crops, lawns, etc. (note that the US consumed significantly more than this amount in 2005). The total amount of energy consumed in the US in 2005 was about 100 quadrillion Btus, or 100 exajoules; the average EROEI for all energy provided was between 25:1 and 45:1 (with allowance for uncertainty). The shaded area at the bottom of the graph represents the estimated minimum EROEI required to sustain modern industrial society: Charles Hall suggests 5:1 as a minimum, though the figure may well be higher.28
How Markets May Respond to Resource Scarcity:The Goldilocks Syndrome
Before examining limits to non-energy resources, it might be helpful to consider how markets respond to resource scarcity, with petroleum as a highly relevant case in point.
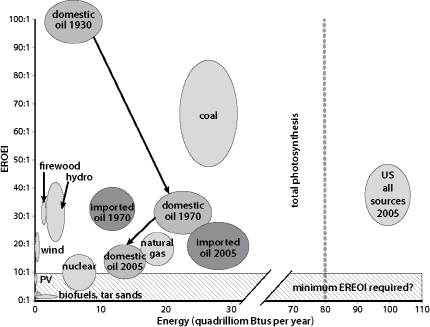
FIGURE 25. Balloon diagram of US energy supplies, including EROEI.
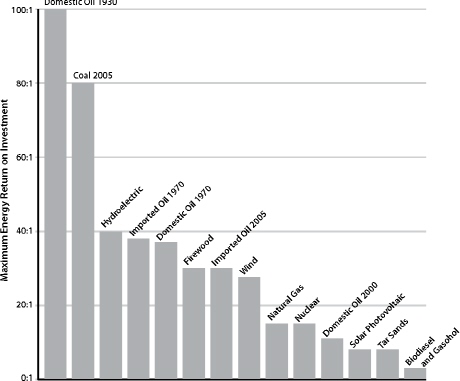
FIGURE 26. Comparison of EROEI for various energy sources. Source: Charles Hall, 2010.
The standard economic assumption is that, as a resource becomes scarce, prices will rise until some other resource that can fill the same need becomes cheaper by comparison. What really happens, when there is no ready substitute, can perhaps best be explained with the help of a little recent history and an old children’s story.
Once upon a time (about a dozen years past), oil sold for $20 a barrel in inflation-adjusted figures, and The Economist magazine ran a cover story explaining why petroleum prices were set to go much lower.29 The US Department of Energy and the International Energy Agency were forecasting that, by 2010, oil would probably still be selling for $20 a barrel, but they also considered highly pessimistic scenarios in which the price could rise as high as $30 (those figures are 1996 dollars).30
Instead, as the new decade wore on, the price of oil soared relentlessly, reaching levels far higher than the “pessimistic” $30 range. Demand for the resource was growing, especially in China and some oil exporting nations like Saudi Arabia; meanwhile, beginning in 2005, actual world oil production hit a plateau. Seeing a perfect opportunity (a necessary commodity with stagnating supply and growing demand), speculators drove the price up even further.
As prices lofted, oil companies and private investors started funding expensive projects to explore for oil in remote and barely accessible places, or to make synthetic liquid fuels out of lower-grade carbon materials like bitumen, coal, or kerogen.
But then in 2008, just as the price of a barrel of oil reached its all-time high of $147, the economies of the OECD countries crashed. Airlines and trucking companies downsized and motorists stayed home. Demand for oil plummeted. So did oil’s price, bottoming out at $32 at the end of 2008.
But with prices this low, investments in hard-to-find oil and hard-to-make substitutes began to look tenuous, so tens of billions of dollars’ worth of new energy projects were canceled or delayed. Yet the industry had been counting on those projects to maintain a steady stream of liquid fuels a few years out, so worries about a future supply crunch began to make headlines.31
It is the financial returns on their activities that motivate oil companies to make the major investments necessary to find and produce oil. There is a long time lag between investment and return, and so price stability is a necessary condition for further investment.
Here was a conundrum: low prices killed future supply, while high prices killed immediate demand. Only if oil’s price stayed reliably within a narrow — and narrowing — “Goldilocks” band could serious problems be avoided. Prices had to stay not too high, not too low — just right — in order to avert economic mayhem.32
The gravity of the situation was patently clear. Given oil’s pivotal role in the economy, high prices did more than reduce demand, they had helped undermine the economy as a whole in the 1970s and again in 2008. Economist James Hamilton of the University of California, San Diego, has assembled a collection of studies showing a tight correlation between oil price spikes and recessions during the past 50 years. Seeing this correlation, every attentive economist should have forecast a steep recession beginning in 2008, as the oil price soared. “Indeed,” writes Hamilton, “the relation could account for the entire downturn of 2007– 08.... If one could have known in advance what happened to oil prices during 2007–08, and if one had used the historically estimated relation [between oil price spikes and economic impacts]...one would have been able to predict the level of real GDP for both of 2008:Q3 and 2008:Q4 quite accurately.”33
This is not to ignore the roles of too much debt and the exploding real estate bubble in the ongoing global economic meltdown. As we saw in the previous two chapters, the economy was set up to fail regardless of energy prices. But the impact of the collapse of the housing market could only have been amplified by an inability to increase the rate of supply of depleting petroleum. Hamilton again: “At a minimum it is clear that something other than [I would say: “in addition to”] housing deteriorated to turn slow growth into a recession. That something, in my mind, includes the collapse in automobile purchases, slowdown in overall consumption spending, and deteriorating consumer sentiment, in which the oil shock was indisputably a contributing factor.”
Moreover, Hamilton notes that there was “an interaction effect between the oil shock and the problems in housing.” That is, in many metropolitan areas, house prices in 2007 were still rising in the zip codes closest to urban centers but already falling fast in zip codes where commutes were long.34
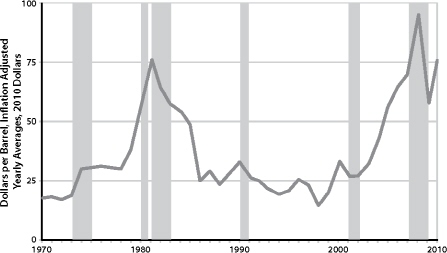
FIGURE 27. Real Oil Prices and Recessions. Rising oil prices bring economic instability. Almost every peak in oil price correlates with an economic downturn. Although the 2000 peak in oil price does not correlate with an official recession, it does correlate with the March 2000 collapse of the dot-com bubble, the unofficial start of the early 2000s Recession. Sources: US Energy Information Administration, US Crude Oil First Purchase Price, The National Bureau of Economic Research.
By mid-2009 the oil price had settled within the “Goldilocks” range — not too high (so as to kill the economy and, with it, fuel demand), and not too low (so as to scare away investment in future energy projects and thus reduce supply). That just-right price band appeared to be between $60 and $80 a barrel.35
How long prices can stay in or near the Goldilocks range is anyone’s guess (as of this writing, oil is trading in New York for over $100 per barrel), but as declines in production in the world’s old super-giant oilfields continue to accelerate and exploration costs continue to mount, the lower boundary of that just-right range will inevitably continue to migrate upward. And while the world economy remains frail, its vulnerability to high energy prices is more pronounced, so that even $80–85 oil could gradually weaken it further, choking off signs of recovery.36
BOX 3.5 Declining Energy Intensity
Carey King, a research associate in the University of Texas Center for International Energy and Environmental Policy, in a recent paper in Environmental Research Letters, introduced a new measure of energy quality, the Energy Intensity Ratio (EIR).38 The ratio represents the amount of profit obtained by energy consumers versus energy producers. Higher EIR numbers indicate that more economic value is being derived by households, businesses, and government from each unit of energy consumed.
King plots EIR for various fuels every year since World War II. The resulting graphs show two large declines, one before the recessions of the 1970s and early 1980s, and the other during the 2000s, leading up to the current recession. There have been other recessions in the US since World War II, but the longest and deepest were preceded by sustained declines in EIR for all fossil fuels.
King’s analysis suggests that if EIR falls below a certain threshold, the economy ceases growing. For example, in 1972, EIR for gasoline was 5.9 and in 2008 it was 5.5. During times of robust economic growth, such as the 1990s, EIR for gasoline was well over 8.
In other words, oil prices have effectively put a cap on economic recovery.37 This problem would not exist if the petroleum industry could just get busy and make a lot more oil, so that each unit would be cheaper. But despite its habitual use of the terms “produce” and “production,” the industry doesn’t make oil, it merely extracts the stuff from finite stores in the Earth’s crust. As we have already seen, the cheap, easy oil is gone. Economic growth is hitting the Peak Oil ceiling.
As we consider other important resources, keep in mind that the same economic phenomenon may play out in these instances as well, though perhaps not as soon or in as dramatic a fashion. Not many resources, when they become scarce, have the capability of choking off economic activity as directly as oil shortages can. But as more and more resources acquire the Goldilocks syndrome, general commodity prices will likely spike and crash repeatedly, making hash of efforts to stabilize the economy.
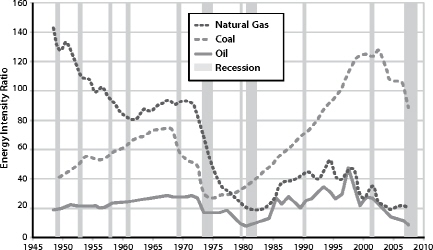
FIGURE 28. EIR declines and recessions. The worst recessions of the last 65 years were preceded by declines in energy quality for oil, natural gas, and coal. Energy quality is plotted using the energy intensity ratio (EIR) for each fuel. Recessions are indicated by gray bars. In layman’s terms, EIR measures how much profit is obtained by energy consumers relative to energy producers. The higher the EIR, the more economic value consumers (including businesses, governments, and people) get from their energy. Credit: Carey King.
BOX 3.6 The Essentials
Energy, water, and food are all essential and have no substitutes, which means that prices fluctuate wildly in response to small changes in quantity (i.e. demand for them is inelastic). As a side effect of this, their contribution to GNP (price × quantity) increases as their supply declines, which is highly perverse. When financial publications tout “bullish” oil or grain prices, the reader may naturally assume that this constitutes good news. But it’s only good for investors in these commodities; for everyone else, higher food and energy prices mean economic pain.
Water
Limits to freshwater could restrict economic growth by impacting society in four primary ways: (1) by increasing mortality and general misery as increasing numbers of people find difficulty filling basic and essential human needs related to drinking, bathing, and cooking; (2) by reducing agricultural output from currently irrigated farmland; (3) by compromising mining and manufacturing processes that require water as an input; and (4) by reducing energy production that requires water. As water becomes scarce, attempts to avert any one of these four impacts will likely make matters worse with regard to at least one of the other three.
There is now widespread concern among experts and responsible agencies that freshwater supplies around the world are being critically overused and degraded, so that water scarcity will increase dramatically as the century wears on. Rivers and streams are being overdrawn, aquifers are being depleted, both surface water and groundwater are being polluted, and sources of flowing surface water — snowpack and glaciers — are receding as a result of climate change.39
According to the UN’s Global Environment Outlook 4 (2007), “by 2025, about 1.8 billion people will be living in countries or regions with absolute water scarcity, and two-thirds of the world population could be under conditions of water stress — the threshold for meeting the water requirements for agriculture, industry, domestic purposes, energy and the environment....”40
A recent study by a team of researchers at the University of Utrecht and the International Groundwater Resources Assessment Center in Utrecht in the Netherlands estimates that groundwater depletion worldwide went from 99.7 million acre-feet (29.5 cubic miles) in 1960 to 229.4 million acre-feet (55 cubic miles) in 2000.41 When groundwater is withdrawn and used, it ultimately ends up in the world’s oceans, resulting in rising sea levels. However, the contribution of groundwater to sea-level rise will probably diminish in the decades ahead because, in the words of water expert Peter H. Gleick of the Pacific Institute, “as groundwater basins are depleted, there won’t be as much water left to send through rain clouds to the oceans.”42
In the US, the Colorado River — which supplies water to cities such as Phoenix, Tucson, Los Angeles, Las Vegas, and San Diego, as well as providing most of the irrigation water for the Southwest — could be functionally dry within the decade if current trends continue.43 The snowpack in the headwaters of the Colorado River is decreasing due to climate change and is expected to be at 40 percent below normal in the coming years. Meanwhile, withdrawals of water continue to increase as population in the region grows. (It is important to distinguish between water withdrawal and water consumption. Water withdrawal represents the total water taken from a source while water consumption represents the amount of that water withdrawal that is not returned to the source, generally lost to evaporation.)44
Three billion inhabitants of southern Asia (nearly half the world’s population) face a similar crisis: they depend for their water on the great river systems that flow from the melting glaciers and snow of the Himalayas — the Ganges, Indus, Brahmaputra, Yangtze, Mekong, Salween, Red River (Asia), Xunjiang, Chao Phraya, Irrawaddy, Amu Darya, Syr Darya, Tarim, and Yellow River. Here again, climate change is reducing the amount of snowpack and shrinking ancient glaciers, while growing populations and expanding economies are making ever-increasing demands on these key waterways.45
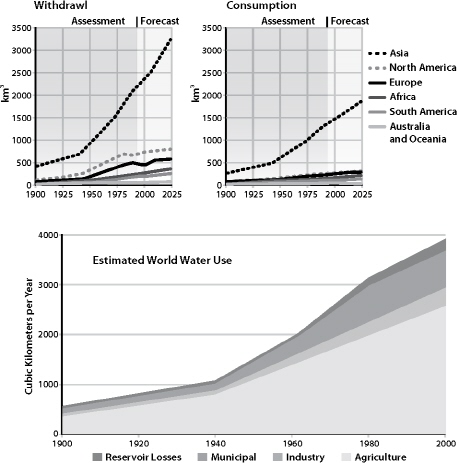
FIGURE 29. World Freshwater Withdrawals and Consumption. Source: United Nations Environment Program (UNEP).
Life-threatening water shortages have already erupted in parts of Africa. In 2009, Somaliland was gripped by a drought that left thousands of families and their livestock seriously weakened for lack of drinking water. Many water wells dried up altogether, and those that still had water had to serve very large populations, including about 100,000 people displaced by the drought.46
Agricultural irrigation accounts for 31 percent of freshwater withdrawals in the US, according to the USGS.47 The impacts of increasing water shortages on agriculture are illustrated by the dilemma of farmers in California’s Central Valley, one of the most productive agricultural areas in America in terms of crop output value per acre. In 2009, in the throes of yet another punishing drought, farmers in Kern County (located in the southern portion of the Central Valley) received less than half their normal water allotment from Federal and state water projects. The local agriculture is highly water-intensive: for Kern County farmers to produce a single orange requires 55 gallons of water, while each peach takes 142 gallons. As a result of the drought, tens of thousands of acres of Kern County farmland were idled.
As snowpack disappears, farmers, ranchers, and cities make up for the loss of running surface water by pumping more from wells. But in many cases this just trades one long-term problem for another: depleting aquifers. The prime example of this trend is the Ogallala aquifer, a vast though shallow underground aquifer located beneath the Great Plains in the United States, which is being drained at an alarming rate. The Ogallala covers an area of approximately 174,000 square miles in portions of eight states (South Dakota, Nebraska, Wyoming, Colorado, Kansas, Oklahoma, New Mexico, and Texas), and supplies water to 27 percent of the irrigated land in the United States.48 The regions overlying the aquifer are used for ranching and for growing corn, wheat, and soybeans. The Ogallala also provides drinking water to 82 percent of the people who live within the aquifer boundary.49 Many farmers in the Texas High Plains are already turning away from irrigated agriculture as wells deepen. In most areas covering the aquifer the water table has dropped 10 to 50 feet since groundwater mining began, but drops of over 100 feet have been recorded in several regions.
In the US, only about five percent of freshwater withdrawal is for industrial uses.50 But these uses support industries that produce, among other things, metals, wood and paper products, chemicals, and gasoline. Industrial water is used for fabricating, processing, washing, diluting, cooling, or transporting products, or for sanitation procedures within manufacturing facilities. Virtually every manufactured product uses water during some part of its production process.
As water becomes scarce, more effort on the part of industry must go toward providing in some other way the same service as cheap water currently provides, almost always at a higher cost. This can mean redesigning industrial processes, or paying more for water brought from further distances.
But moving water takes energy. In California, for example, water pumps use 6.5 percent of the total electricity consumed in the state each year.51 Desalinating ocean water for industrial, agricultural, and home use also takes energy: the most efficient desalination plants, using reverse osmosis, consume about 2.5 to 3.5 kilowatt hours of energy per cubic meter of fresh water produced.52
But if more energy must be used to obtain water as water becomes scarce, more water must be used to obtain energy as energy resources become scarce. Let’s return to our earlier example of Kern County, California. In addition to a vital agricultural economy, the county is also host to a $15 billion oil and gas industry — which likewise happens to be very water-intensive. The heavy oil extracted from Kern County oil wells can only flow into and up boreholes when drillers inject enormous amounts of water and steam — 320 gallons for every barrel pumped to the surface. Farmers and oil companies must compete for the same dwindling water supplies.53
Electricity production requires water, too. About 49 percent of the 410 billion gallons of water the US withdraws daily (if saline water is included) go to cooling thermoelectric power plants, and most of that to cooling coal-burning plants.54 Nuclear power plants also need substantial amounts of water to cool their reactors. Even the manufacturing of photovoltaic solar panels requires water — in this case, water of exceptionally high purity (though of relatively very small amounts compared to other energy technologies). According to Circle of Blue, a network of journalists and scientists dedicated to water sustainability, “...the competition for water at every stage of the mining, processing, production, shipping and use of energy is growing more fierce, more complex and much more difficult to resolve.”55
Most nations have been getting steadily more productive with water — that is, water use per unit of GDP has been going up. This is largely due to the shift from agricultural to industrial water use, and also to boosts in efficiency. There is much more that could be done in terms of the latter: water productivity in most sectors could easily double, triple, or more.
Still, across the world conflicts over scarce freshwater resources are multiplying and intensifying. There are many potential flashpoints; for example: a coalition of countries led by Ethiopia is currently challenging old agreements that allow Egypt to use more than half of the Nile’s flow. Without the river, all of Egypt would be desert.56 As users of water, and uses of water, compete for access to dwindling supplies, many nations will find continuing economic growth increasingly put at risk.
By itself, water scarcity is not likely to be an immediate limiting factor for economic growth for the US, at least for the next couple of decades. But it is already a serious problem in many other nations, including much of Africa and most of the Arab world.57 And water scarcity subtly tightens all the other constraints we are discussing.
Food
In addition to water, people need food for their very existence. Thus food is also essential to economic growth.
Problems with maintenance of far-flung and intensive food production systems played a role in the collapse of previous civilizations, including the Roman Empire.58 Mesopotamia, the green and lush center of the Sumerian and Babylonian civilizations, was largely turned to desert as a result of soil erosion. The Mayan civilization likewise succumbed to declining food production, according to recent archaeological research.59 Industrial societies have skirted what would otherwise have been limiting factors to food production using irrigation, new crop varieties, fertilizers, herbicides and pesticides, and mechanization — as well as expanded transport networks that allow local abundance to be shared globally. In terms of productivity, 20th-century agriculture was an unprecedented success: grain production increased an astounding 500 percent (from under 400 million tons in 1900 to nearly two billion in 2000). This achievement mostly depended on the increasing use of cheap and temporarily abundant fossil fuels.60
At the beginning of the 20th century, most people farmed and agriculture was driven by muscle power (animal and human). Today in most countries, farmers make up a much smaller proportion of the population than was formerly the case and agriculture is at least partly mechanized. Fuel-fed machines plow, plant, harvest, sort, process, and deliver foods, and industrial farmers typically work larger parcels of land. They also typically sell their harvest to a distributor or processor, who then sells packaged food products to a wholesaler, who in turn sells these products to chains of supermarkets or restaurants. The ultimate consumer of food is thus several steps removed from the producer, and food systems in most nations or regions have become dominated by a few giant multinational seed companies, agricultural chemicals corporations, and farm machinery manufacturers, as well as food wholesalers, distributors, and supermarket and fast-food chains.
Farm inputs have also changed. A century ago, farmers saved seeds from year to year, while soil amendments were likely to come from the farm itself in the form of animal manures. Farmers only bought basic implements, plus some useful materials such as lubricants. Today’s industrial farmer relies on an array of packaged products (seeds, fertilizers, pesticides, herbicides, feed, antibiotics), as well as fuels, powered machines, and spare parts. The annual cash outlays for these can be daunting, requiring farmers to take out substantial loans.
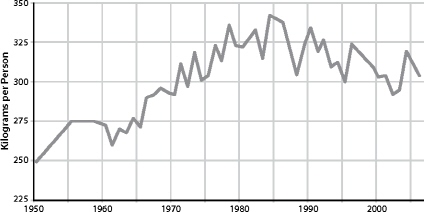
FIGURE 30. World Grain Production Per Person, 1950–2006. Since peaking in 1984, world grain production per person has been falling. Source: Earth Policy Institute.
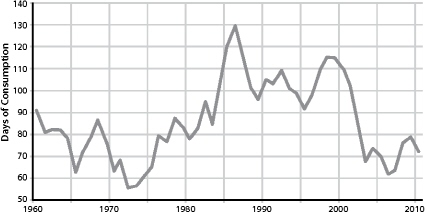
FIGURE 31. World Grain Stocks, 1960–2010. After peaking in 1986, world stocks have also been declining. Source: Earth Policy Institute.
The path to our current food abundance was littered with incidental costs, most borne by the environment. Agriculture has become the single greatest source of human impact upon the planet as a result of soil salinization, deforestation, loss of habitat and biodiversity, fresh water scarcity, and pesticide pollution of water and soil.61 Fertilizer use worldwide increased 500 percent from 1960 to 2000, and this contributed to an explosion of “dead zones” in seas and oceans, upsetting a process of nutrient cycling that has existed for billions of years.62
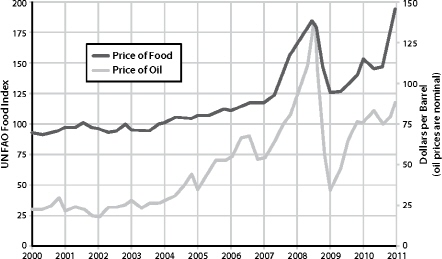
FIGURE 32. World Food and Oil Prices, 2000–2010. There is a strong correlation between food and oil prices. When oil prices spiked in the summer of 2008, food prices reached their highest levels since the UN began collecting food price data. In January 2011, food prices jumped again. This time they reached almost 200 on the FAO’s food price index, the highest level ever recorded. Source: UN Food and Agriculture Organization (FAO), US Energy Information Administration.
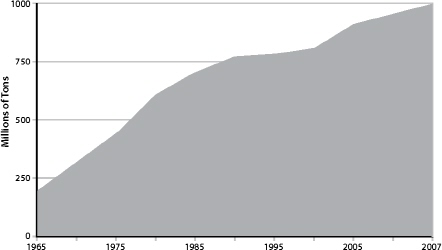
FIGURE 33. World Nitrogen Fertilizer Consumption. Source: UN Food and Agriculture Organization (FAO).
There have been some environmental improvements to agriculture in recent years: US farming is more energy efficient than it was a couple of decades ago, fertilizer use has declined somewhat, and more effort goes toward soil conservation. But in general, and especially on the global scene, as food production has grown, so have environmental impacts.63
Now, further expansion of the food supply appears problematic. World grain production per capita peaked in 1984 at 342 kg annually. For many years production has not met demand, so the gap has been filled by dipping into carryover stocks; currently, less than two months’ supply remains as a buffer.64
The challenges to increasing production come from several directions simultaneously: water scarcity (see above), topsoil erosion (we are “mining” topsoil with industrial agriculture at almost four times the rate we are mining coal — over 25 billion tons per year versus 7 billion tons), declining soil fertility, limits to arable land, declining seed diversity, increasing requirements for inputs (pests are developing resistance to common pesticides and herbicides, requiring larger doses), and, not least, increasing costs of fossil fuel inputs.65
But as the energy required to run the food system becomes more costly, food is increasingly being used to make energy. Many governments now offer subsidies and other incentives for turning biomass — including food crops — into fuel. This inevitably drives up food prices. Even non-fuel crops such as wheat are affected, as farmers replace wheat fields with more profitable biofuel crops like maize, rapeseed, or soy.
Mineral depletion is also posing a limit to the human food supply. Phosphorus is often a limiting factor in natural ecosystems; that is, the supply of available phosphorus limits the possible size of populations in those environments. That’s because phosphorus is one of the three major nutrients required for plant growth (nitrogen and potassium are the other two). Most agricultural phosphorus is obtained from mining phosphate rock: organic farmers use crude phosphate, while conventional industrial farms use chemically treated forms such as superphosphate, triple super-phosphate, or ammonium phosphates. Fortunately, phosphorus can be recycled, as the Chinese did in their traditional food-agriculture systems, where human and animal wastes were returned to the soil. But today vast amounts of what might otherwise be valuable soil nutrients are flushed down waterways, and wind up being deposited at the mouths of rivers.66
BOX 3.7 Food Crisis in 2011?
Floods in Australia and Brazil, drought in northern China, and high oil prices are conspiring to drive up food prices in 2011 to record levels. Stockpiling of grain in China and other industrializing countries on expectation of shortages is putting even more upward pressure on prices. As of February, wheat prices were already up nearly to the record levels seen in 2008, and rice orders in China were running at 2 to 4 times usual quantities.
University of Illinois agricultural economist Darrel Good estimated that US corn stocks at the end of the 2010–11 marketing year would total only 745 million bushels. “That projection represents 5.5 percent of projected marketing year consumption. Stocks as a percent of consumption would be the smallest since the record low 5 percent of 1995–96. And 5 percent is considered to be a minimal pipeline supply.” Good also noted that combined corn and soybean acreage would have to increase by 6.5 million acres in 2011 to meet anticipated immediate demand while also allowing for a modest rebuilding of inventories. Almost 5 billion bushels of corn will be used in ethanol production this year.72 Meanwhile, as Lester Brown, founder of Earth Policy Institute, pointed out in a prominent article (“The Great Food Crisis of 2011”),
“Two huge dust bowls are forming, one across northwest China, western Mongolia, and central Asia; the other in central Africa. Each of these dwarfs the US dust bowl of the 1930s. Satellite images show a steady flow of dust storms leaving these regions, each one typically carrying millions of tons of precious topsoil. In North China, some 24,000 rural villages have been abandoned or partly depopulated as grasslands have been destroyed by overgrazing and as croplands have been inundated by migrating sand dunes.”73
High food prices were frequently cited as factors contributing to the uprisings in Tunisia and Egypt early in 2011.
In 2007, Canadian physicist and agricultural consultant Patrick Déry studied phosphorus production statistics worldwide using Hubbert lin-earization analysis (a technique used to forecast oil depletion rates) and concluded that the peak of phosphate production has been passed for both the United States (1988) and for the world as a whole (1989). Déry looked at data not only for phosphate that is currently commercially minable, but for reserves of rock phosphate of lower concentrations; he found — no surprise — that these would be more costly to exploit from economic, energetic, and environmental standpoints.67 Déry’s conclusions are echoed in a recent report by Britain’s Soil Association (see Box 3.8 in this chapter, “Does Peak Phosphorus Mean Peak Food?”)
There are three main solutions to the problem of Peak Phosphate: composting of human wastes, including urine diversion; more efficient application of fertilizer; and farming in such a way as to make existing soil phosphorus more accessible to plants.
Food supply challenges extend from farms to the world’s oceans. Fish like cod, sardines, haddock, and flounder have been favorites for decades in Europe and North America, but many of these species are now endangered. Global marine seafood capture peaked in 1994. An international group of ecologists and economists warned in 2006 that the world will run out of wild seafood by 2048 if steep declines in marine species continue at current rates. They noted that as of 2003, 29 percent of all fished species had collapsed, meaning they were at least 90 percent below their historic maximum catch levels. The rate of population collapses continues to accelerate. The lead author of the group’s report, Boris Worm, was quoted as saying, “We really see the end of the line now. It’s within our lifetime. Our children will see a world without seafood if we don’t change things.”68 According to a more recent study, many types of fish have great difficulty recovering even if over-fishing stops. After 15 years of conservation efforts, many stocks had barely increased in numbers. Cod, for example, failed to recover at all (see Box 3.13 in this chapter, “Atlantic Cod: A Story of Renewable Resource Depletion”).69
BOX 3.8 Does Peak Phosphorus Equal Peak Food?
A recent report from the Soil Association of Britain concludes that supplies of phosphate rock are running out faster than previously thought and that declining supplies and higher prices of phosphate are a new threat to global food security. A Rock and a Hard Place: Peak Phosphorus and the Threat to Our Food Security highlights the urgent need for farming to become less reliant on phosphate rock-based fertilizer.74
Intensive agriculture depends on phosphate to maintain soil fertility. Globally, 158 million metric ton of phosphate rock is mined each year, but the mineral is non-renewable and supplies are finite. Recent analysis suggests that the world may hit “peak phosphate” as early as 2033; production in the US is already declining. As with Peak Oil, supplies will become increasingly scarce and expensive even before production declines, as mining companies are forced to move to lower-quality deposits.75 This critical issue is currently missing from the global food policy agenda. Without fertilization from phosphorus, wheat yields could plummet by half in coming decades. Current prices for phosphate rock are about twice the level in 2006. The Soil Association report notes that, “When demand for phosphate fertilizer outstripped supply in 2007/08, the price of rock phosphate rose 800 percent.” Phosphate is essential and non-substitutable; therefore demand is inelastic.
In 2009, 67 percent of rock phosphate was mined in just three countries — China (35 percent), the US (17 percent), and Morocco and Western Sahara (15 percent). China has now restricted exports, and the US has stopped exporting the mineral.76
Here, then is the overall picture: Demand for food is slowly outstripping supply. Food producers’ ability to meet growing needs is increasingly being strained by rising human populations, falling freshwater supplies, the rise of biofuels industries, expanding markets within industrializing nations for more resource-intensive meat and fish-based diets; dwindling wild fisheries; and climate instability. The result will almost inevitably be a worldwide food crisis sometime in the next two or three decades.70
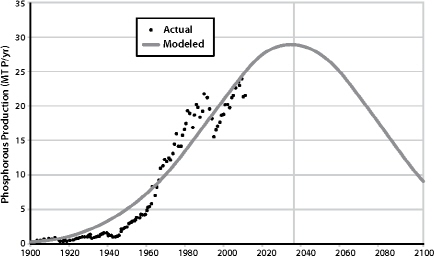
FIGURE 34. World Phosphorus Production, History, and Projection. Source: Cordell et al, 2009, “The Story of Phosphorus: Global Food Security and Food For Thought,”
Global Environmental Change 19:292–305.
The challenges to increasing global food production or even maintaining current rates are linked not only with the other problems discussed in this chapter (changing climate, energy resource depletion, water scarcity, and mineral depletion) but also with the problems discussed in Chapter 2: Modern agriculture requires a system of credit and debt. Unless farmers can obtain credit, they cannot afford increasingly expensive inputs. Food processors and wholesalers likewise require access to credit. Thus a prolonged credit crisis could devastate the world’s food supply as dramatically as could any imaginable weather event.
The solution often proposed to these daunting food system challenges is genetic engineering. If we can splice genes to make more productive crop varieties, more nutritious foods, plants that can grow in saltwater, fish that grow faster, or grains that can fix atmospheric nitrogen the way legumes do, then we could reduce the need for freshwater irrigation, nitrogen fertilizers, and overfishing while growing more food and nourishing people better. It sounds too good to be true — and probably is. In reality, most currently patented plant genes merely confer resistance to insect pests or proprietary herbicides; the promise of more nutrient-rich crops and of nitrogen-fixing grains is still years from realization. Meanwhile, the designer-gene seed industry continues to depend on energy-intensive technologies (such as chemical fertilizers and herbicides), as well as centralized production and distribution systems, along with financial systems based on credit and debt. So far, gene splicing in food plants has succeeded mostly in generating enormous profits for an increasingly centralized corporate seed industry, and more debt for farmers. As for gene-altered fish, ecologists warn that while these are meant to be raised in enclosed areas, if even a few accidentally escaped into the wild they could quickly displace remaining related wild populations and upend fragile and already compromised ecosystems.71
It’s worth noting that for the past few decades a vocal minority of farmers, agricultural scientists, and food system theorists including Wendell Berry, Wes Jackson, Vandana Shiva, Robert Rodale, and Michael Pollan, has argued against centralization, industrialization, and globalization of agriculture, and for an ecological agriculture with minimal fossil fuel inputs. Where their ideas have taken root, the adaptation to Peak Oil and the end of growth will be easier. Unfortunately, their recommendations have not become mainstream, because industrialized, globalized agriculture have proved capable of producing larger short-term profits for banks and agribusiness cartels. Even more unfortunately, the available time for a large-scale, proactive food system transition before the impacts of Peak Oil and economic contraction arrive is gone. We’ve run out the clock.
Metals and Other Minerals
Without metals and a host of other non-renewable minerals, industrial economies could not function. Metals are essential for energy production; for making factory tools, transportation vehicles, and agricultural machinery; and for building the infrastructure of highways, pipes, and power lines that enables modern civilization to function. Hi-tech electronics industries rely on a host of rare metallic and non-metallic minerals ranging from antimony to zinc. All are depleting, and some are already at economically worrisome levels of scarcity.
In principle, there is no sustainable rate of extraction for non-renewable resources: every instance of extraction represents a step toward “running out.” During the twentieth century, though, new mining technologies enabled commercially available supplies of most minerals to increase substantially. Ore qualities gradually declined as the low-hanging fruit disappeared, but this trend was countered by the investment of increasing amounts of cheap energy in mining and refining. Globalization also helped, as users of non-renewable resources gained access to virgin deposits in countries where labor costs for mining were minimal. Resource substitution and recycling likewise played their parts in keeping mineral and metal prices low and generally declining.77
That price trend seems to have reversed. During the past decade, production rates for many industrially important non-renewable resources have leveled off or, in some cases, begun to decline, while prices have risen.78 Several recent articles, reports, and studies highlight the predicament of depleting mines, declining ore quality, and rising prices.79 Data from the US Geological Survey shows that within the US many mineral resources are well past their peak rates of production.80 These include bauxite (whose production peaked in 1943), copper (1998), iron ore (1951), magnesium (1966), phosphate rock (1980), potash (1967), rare earth metals (1984), tin (1945), titanium (1964), and zinc (1969).81 As Tom Graedel at Yale University pointed out in a 2006 paper, “Virgin stocks of several metals appear inadequate to sustain the modern ‘developed world’ quality of life for all of Earth’s people under contemporary technology.”82
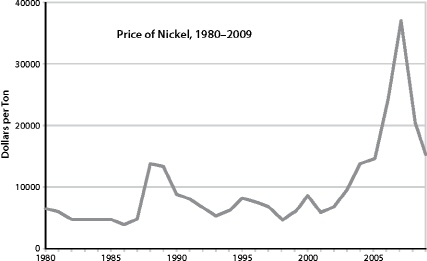
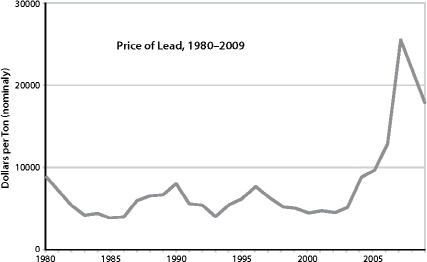
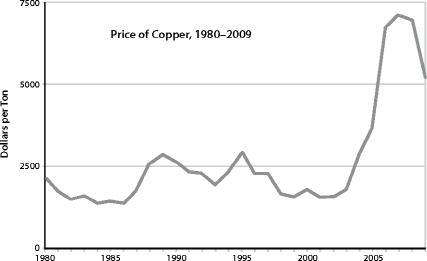

FIGURE 35. Commodity Prices, 1980–2009. Source: UN Conference on Trade and Development (UNCTD).
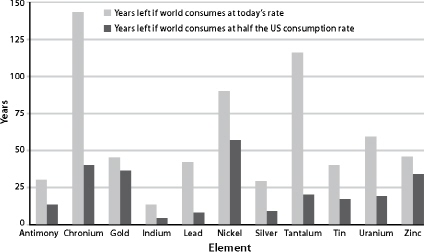
FIGURE 36. Depleting Elements. If nothing changed in our consumption patterns for the above elements, their supply would dwindle relatively slowly (represented in light grey). However, as more countries industrialize, consumption is likely to increase. If the world consumes these resources at only half the current US rate, they will all run out within 60 years (represented in dark grey). Source: Armin Reller of University of Augsburg, Tom Graedel of Yale University, Australian Academy of Science.
The following are just a few examples.
For thousands of years, metal smiths made tools from melted-down “bog iron” (which was mainly composed of an iron-rich ore called goethite), using charcoal as a fuel. In the more recent past iron miners began to extract lower-grade ores such as natural hematite, which were then smelted in coke-fed blast furnaces. Today miners must rely more heavily on taconite, a flint-like ore containing less than 30 percent magnetite and hematite.83
According to Julian Phillips, editor of Gold Forecaster newsletter, deposits of gold that can be easily mined will probably be exhausted in about 20 years.84
There are 17 rare earth elements (REEs) with names like lanthanum, neodymium, europium, and yttrium. They are critical to a variety of high-tech products including catalytic converters, color TV and flat panel displays, permanent magnets, batteries for hybrid and electric vehicles, and medical devices; to manufacturing processes like petroleum refining; and to various defense systems like missiles, jet engines, and satellite components. REEs are even used in making the giant electromagnets in modern wind turbines. But rare earth mines are failing to keep up with demand. China produces 97 percent of the world’s REEs, and has issued a series of contradictory public statements about whether, and in what amounts, it intends to continue exporting these elements. The options for other nations, such as the US, are to find substitutes for REEs or to identify new economically viable REE reserves elsewhere in the world.85
Indium is used in indium tin oxide, which is a thin-film conductor in flat-panel television screens. Armin Reller, a materials chemist, and his colleagues at the University of Augsburg in Germany, have been investigating the problem of indium depletion. Reller estimates that the world has, at best, 10 years before production begins to decline; known deposits will be exhausted by 2028, so new deposits will have to be found and developed.86 Some analysts are now suggesting that shortages of energy minerals including indium, REEs, and lithium for electric car batteries could trigger trade wars.87
Armin Reller and his colleagues have also looked into gallium supplies. Discovered in 1831, gallium is a blue-white metal with certain unusual properties, including a very low melting point and an unwillingness to oxidize. These make it useful as a coating for optical mirrors, a liquid seal in strongly heated apparatus, and a substitute for mercury in ultraviolet lamps. Gallium is also essential to making liquid-crystal displays in cell phones, flat-screen televisions, and computer monitors. With the explosive profusion of LCD displays in the past decade, supplies of gallium have become critical; Reller projects that by about 2017 existing sources will be exhausted.88
Palladium (along with platinum and rhodium) is a primary component in the autocatalysts used in automobiles to reduce exhaust emissions. Palladium is also employed in the production of multi-layer ceramic capacitors in cellular telephones, personal and notebook computers, fax machines, and auto and home electronics. Russian stockpiles have been a key component in world palladium supply for years, but those stockpiles are nearing exhaustion, and prices for the metal have soared as a result.89
Uranium is the fuel for nuclear power plants and is also used in nuclear weapons manufacturing; small amounts are employed in the leather and wood industries for stains and dyes, and as mordants of silk or wool. Depleted uranium is used in kinetic energy penetrator weapons and armor plating. In 2006, the Energy Watch Group of Germany studied world uranium supplies and issued a report concluding that, in its most optimistic scenario, the peak of world uranium production will be achieved before 2040. If large numbers of new nuclear power plants are constructed to offset the use of coal as an electricity source, then supplies will peak much sooner.90
Tantalum for cell phones. Helium for blimps. The list could go on. Perhaps it is not too much of an exaggeration to say that humanity is in the process of achieving Peak Everything.91
BOX 3.9 Depletion
As a rule of thumb, when the quality of the ore drops, the amount of energy required to extract the resource rises (often the amount of water, too).
Mining companies around the world are reporting declining ore quality, and are using increasing amounts of energy in mining and refining. However, our main sources of energy (fossil fuels) are also depleting non-renewable resources with declining quality. Once energy starts to become scarce and expensive, this sets off a self-reinforcing feedback loop: declining energy supplies make resource extraction more problematic; but since metals and other minerals are essential to energy production, this only makes the energy problem worse, which makes the materials problem worse, which makes the energy problem worse....92
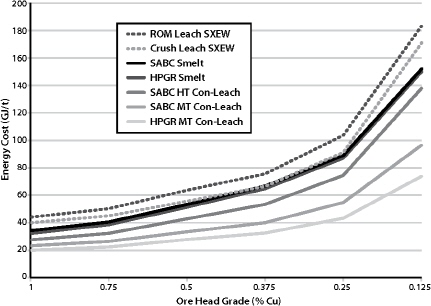
FIGURE 37. Energy Cost of copper production as a function of ore grade. As ore grade declines, energy costs of resource recovery increase. This graph tracks costs of copper production, but the principle could easily be illustrated for other minerals. Source: J. O. Marsden. Hydrometallurgy 2008: Proceedings of the Sixth International Symposium: Energy Efficiency and Copper Hydrometallurgy, Edited by C. A. Young, SME (2008).
Climate Change, Pollution, Accidents, Environmental Decline, and Natural Disasters
Accidents and natural disasters have long histories; therefore it may seem peculiar to think that these could now suddenly become significant factors in choking off economic growth. However, two things have changed.
First, growth in human population and proliferation of urban infrastructure are leading to ever more serious impacts from natural and human-caused disasters. Consider, for example, the magnitude 8.7 to 9.2 earthquake that took place on January 26 of the year 1700 in the Cascadia region of the American northwest. This was one of the most powerful seismic events in recent centuries, but the number of human fatalities, though unrecorded, was probably quite low. If a similar quake were to strike today in the same region — encompassing the cities of Vancouver, Canada; Seattle, Washington; and Portland, Oregon — the cost of damage to homes and commercial buildings, highways, and other infrastructure could reach into the hundreds of billions of dollars, and the human toll might be horrific. Another, less hypothetical, example: the lethality of the 2004 Indian Ocean tsunami, which killed between 200,000 and 300,000 people, was exacerbated by the extreme population density of the low-lying coastal areas of Indonesia, Sri Lanka, and India.
Second, the scale of human influence on the environment today is far beyond anything in the past. In this chapter so far we have considered problems arising from limits to environmental sources of materials useful to society — energy resources, water, and minerals. But there are also limits to the environment’s ability to absorb the insults and waste products of civilization, and we are broaching those limits in ways that can produce impacts we cannot contain or mitigate. The billions of tons of carbon dioxide that our species has released into the atmosphere through the combustion of fossil fuels are not only changing the global climate but also causing the oceans to acidify. Indeed, the scale of our collective impact on the planet has grown to such an extent that many scientists contend that Earth has entered a new geologic era — the Anthropocene.93 Humanly generated threats to the environment’s ability to support civilization are now capable of overwhelming civilization’s ability to adapt and regroup.
Ironically, in many cases natural disasters have actually added to the GDP. This is because of the rebound effect, wherein money is spent on disaster recovery that wouldn’t otherwise have been spent. But there is a threshold beyond which recovery becomes problematic: once a disaster is of a certain size or scope, or if conditions for a rebound are not present, then the disaster simply weakens the economy.94
Examples of major environmental disasters in 2010 alone include:
• January: a major earthquake in Haiti, with its epicenter 16 miles from the capital Port-au-Prince, left 230,000 people dead, 300,000 injured, and 1,000,000 homeless;
• April–August: the Deepwater Horizon oil rig exploded in the Gulf of Mexico; the subsequent oil spill was the worst environmental disaster in US history;
• May: China’s worst floods in over a decade required the evacuation of over 15 million people;
• July–August: Pakistan floods submerged a fifth of the country and killed, injured, or displaced 21 million people, making for the worst natural disaster in southern Asia in decades;
• July–August: Russian wildfires, heat wave, and drought caused hundreds of deaths and the widespread failure of crops, resulting in a curtailing of grain exports; the weather event was the worst in recent Russian history.
But these were only the most spectacular instances. Smaller disasters included:
• February: storms battered Europe; Portuguese floods and mudslides killed 43, while in France at least 51 died;
• April: ash from an Iceland volcano wreaked travel chaos, stranding hundreds of thousands of passengers for days;
• October: a spill of toxic sludge in Hungary destroyed villages and polluted rivers.
This string of calamities continued into early 2011, with deadly, catastrophic floods in Australia, southern Africa, the Philippines, and Brazil.
GDP impacts from the 2010 disasters were substantial. BP’s losses from the Deepwater Horizon gusher (which included cleanup costs and compensation to commercial fishers) have so far amounted to about $40 billion.95 The Pakistan floods caused damage estimated at $43 billion, while the financial toll of the Russian wildfires has been pegged at $15 billion.96 Add in other events listed above, plus more not mentioned, and the total easily tops $150 billion for GDP losses in 2010 resulting from natural disasters and industrial accidents.97 This does not include costs from ongoing environmental degradation (erosion of topsoil, loss of forests and fish species). How does this figure compare with annual GDP growth? Assuming world annual GDP of $58 trillion and an annual growth rate of three percent, annual GDP growth would amount to $1.74 trillion. Therefore natural disasters and industrial accidents, conservatively estimated, are already costing the equivalent of 8.6 percent of annual GDP growth.
BOX 3.10 The Japan Earthquake
As this book was in its final stages of preparation for printing, a massive earthquake and tsunami struck northern Japan. Thousands of lives were lost; entire towns were wiped out; nuclear reactors melted down; oil refineries were shuttered; rolling blackouts swept the nation; seaports were seriously damaged; and Toyota, Sony, and other major corporations ceased production.
Only days after these horrific events it was already clear that Japan’s economy would be impacted for many months to come. Most oil traders at first assumed that so much destruction in the world’s third largest economy would lower world petroleum demand, but others soon argued that Japan would have to import more oil to make up for its lost electrical production capacity, and that refinery outages would put pressure on Asian diesel supplies. Some economists theorized that reconstruction efforts would boost Japan’s economy, while others contended that reconstruction could not balance out the enormous GDP hit from lost manufacturing and trading — and that the government, already mired in debt, might not be able to afford to fund complete reconstruction in any case. Energy experts were all generally agreed that the global nuclear power industry had been set back, and that many power plants in the planning stages throughout the world would likely never be built.
The tragic Japanese quake only underscores a general global trend toward ever-higher costs arising from natural disasters and industrial accidents.
As resource extraction moves from higher-quality to lower-quality ores and deposits, we must expect worse environmental impacts and accidents along the way. There are several current or planned extraction projects in remote and/or environmentally sensitive regions that could each result in severe global impacts equaling or even surpassing the Deepwater Horizon blowout. These include oil drilling in the Beaufort and Chukchi Seas; oil drilling in the Arctic National Wildlife Refuge; coal mining in the Utukok River Upland, Arctic Alaska; tar sands production in Alberta; shale oil production in the Rocky Mountains; and mountaintop-removal coal mining in Appalachia.98
The future GDP costs of climate change are unknowable, but all indications suggest they will be enormous and unprecedented. The most ambitious effort to estimate those costs so far, the Stern Review on the Economics of Climate Change, consisted of a 700-page report released for the British government in 2006 by economist Nicholas Stern, chair of the Grantham Research Institute on Climate Change and the Environment at the London School of Economics. The report stated that failure by governments to reduce greenhouse gas emissions would risk causing global GDP growth to lag twenty percent behind what it otherwise might be.99 The Review also stated that climate change is the greatest and widest-ranging market failure ever seen, presenting a unique challenge for economics.
The Stern Review was almost immediately strongly criticized for underestimating the seriousness of climate impacts and the rate at which those impacts will manifest. In April 2008 Stern admitted that, “We underestimated the risks...we underestimated the damage associated with temperature increases...and we underestimated the probabilities of temperature increases.”100
The Stern Review is open to criticism not just for its underestimation of climate impacts, but also for its overestimation of the ability of alternative energy sources to replace fossil fuels. The report does not take into account EROEI or other aspects of energy quality that are essential to understanding the economic advantages that fossil fuels have delivered. Since climate is changing mostly because of the burning of fossil fuels, averting climate change is largely a matter of reducing fossil fuel consumption.101 But as we have seen (and will confirm in more ways in the next chapter), economic growth depends on increasing energy consumption. Due to the inherent characteristics of alternative energy sources, it is extremely unlikely that society can increase its energy production while dramatically curtailing fossil fuel use.102 Once energy quality factors are taken into account, it is difficult to escape the conclusion that energy substitution will likely be much more expensive than forecast in the Stern Review, and that the price of climate change mitigation — originally estimated at 1 percent of GDP annually in the Review, but later revised to 2 percent — will likely be vastly higher, even ignoring any underestimation of climate change risks and rates.
BOX 3.11 The Environmentalist’s Paradox
Environmentalists have long argued that ecological degradation will lead to declines in the general welfare of people who depend on ecosystem services — which in the end includes everyone. Yet the Millennium Ecosystem Assessment found that human well-being has increased despite substantial declines in most global ecosystem services. Were the environmentalists wrong?
A paper by Ciara Raudsepp-Hearne et al., discusses four explanations for these divergent trends: (1) We have measured well-being incorrectly; (2) well-being is dependent on food services, which are increasing, and not on other services, which are declining; (3) technology has decoupled well-being from nature; (4) time lags may lead to future declines in well-being.109
Their conclusion: “The environmentalist’s paradox is not fully explained by any of the four hypotheses we examined.” Despite the assessment that the fourth hypothesis has “weak empirical support,” the authors conclude that it may in fact be the best explanation for the divergence in trends. The authors discuss “threshold effects,” where ecosystem declines are masked up to a point, but then quickly overwhelm human support systems.
“. . . [A]nthropogenically driven ecological change has substantial and novel impacts on the biosphere. These changes present new challenges to humanity. The existence of a time lag between the destruction of natural capital and the decline in ecosystem service production provides an explanation of the environmentalist’s paradox, but uncertainty about the duration, strength, and generality of this lag prevents us from providing strong support for this hypothesis. However, evidence of past collapses and of declines in natural capital does mean that this hypothesis cannot be rejected.”110
Another environmental impact that is relatively slow and ongoing and even more difficult to put a price tag on is the decline in the number of non-human species inhabiting our planet. According to one recent study, one in five plant species faces extinction as a result of climate change, deforestation, and urban growth.103 Many species have existing or potential economically significant uses; the yew tree, for instance, was until recently considered a “trash tree,” but is now the source for taxol, relied on by tens of thousands of people as a life-saving treatment for breast, prostate, and ovarian cancers. Sales of the drug have amounted to as much as $1.6 billion in some recent years.104 As species disappear, potential uses and economic rewards disappear with them.
Another study, this one by the UN, has determined that businesses and insurance companies now see biodiversity loss as presenting a greater risk of financial loss than terrorism — a problem that governments currently spend hundreds of billions of dollars per year to contain or prevent.105
Non-human species perform ecosystem services that only indirectly benefit our kind, but in ways that turn out to be crucial. Phytoplankton, for example, are not a direct food source for people, but comprise the base of oceanic food chains — in addition to supplying half of the oxygen produced each year by nature. The abundance of plankton in the world’s oceans has declined 40 percent since 1950, according to a recent study, for reasons not entirely clear.106 This is one of the main explanations for a gradual decline in atmospheric oxygen levels recorded worldwide.107
BOX 3.12 Growing Demand for Resources “Threatens EU Economy”
According to a report by the European Environment Agency, released in November 2010, Europe’s economy is at risk due to limits of global natural resources. The Environment State and Outlook Report said the threat is driven by a need to satisfy rising global consumption.111
The report said there were no “quick fixes” and called on businesses, individuals and policymakers to work together to make resource use more efficient.
The report’s authors noted that EU environmental policy had “delivered substantial improvements,” but added: “major environmental challenges remain, which will have significant consequences for Europe if left unaddressed.”
For example, while Europe’s network of protected areas and habitats has expanded to cover about 18 percent of the continent’s landmass, the EU has failed to meet its target to halt biodiversity loss by 2010.
The report, according to its executive summary, “does not present any warnings of imminent environmental collapse. However, it does note that some local and global thresholds are being crossed, and that negative environmental trends could lead to dramatic and irreversible damage to some of the ecosystems and services that we take for granted.”112
A 2010 study by Pavan Sukhdev, a former banker, to determine a price for the world’s environmental assets, concluded that the annual destruction of rainforests entails an ultimate cost to society of $4.5 trillion — $650 for each person on the planet. But that cost is not paid all at once; in fact, over the short term, forest cutting looks like an economic benefit as a result of the freeing up of agricultural land and the production of timber. Like financial debt, deferred environmental costs tend to accumulate until a crisis occurs and systems collapse.108
Declining oxygen levels, acidifying oceans, disappearing species, threatened oceanic food chains, changing climate — when considering planetary changes of this magnitude, it may seem that the end of economic growth is hardly the worst of humanity’s current problems. However, it is important to remember that we are counting on growth to enable us to solve or respond to environmental crises. With economic growth, we have surplus money with which to protect rainforests, save endangered species, and clean up after industrial accidents. Without economic growth, we are increasingly defenseless against environmental disasters — many of which paradoxically result from growth itself.
Unfortunately, in the case of climate change, there may be a time lag involved (even if we stop carbon emissions today, climate will continue changing for some time due to carbon already in the atmosphere), so that the end of economic growth cannot be counted on to solve the environmental problems that growth has previously generated.
In the Introduction to this book we began with a simple premise: humanity cannot grow consumption and waste streams forever on a finite planet. There are limits. The evidence is clear: We are reaching those limits. It is no longer a matter of saying, “If we don’t voluntarily bring growth in consumption to an end, then we will run into problems.” That was a message appropriate to the 1970s or ’80s. We didn’t change direction then, and now we are nearing or at the point of declining energy, declining freshwater, declining minerals, declining biodiversity...and a declining economy.
Perhaps the meteoric rise of the finance economy in the past couple of decades resulted from a semi-conscious strategy on the part of society’s managerial elites to leverage the last possible increments of growth from a physical, resource-based economy that was nearing its capacity. In any case, the implications of the current economic crisis cannot be captured by unemployment statistics and real estate prices. Attempts to restart growth will inevitably collide with natural limits that simply don’t respond to stimulus packages or bailouts.113
Burgeoning environmental problems require rapidly increasing amounts of effort to fix them. In addition to facing limits on the amount of debt that can be accumulated in order to keep those problems at bay, we also face limits to the amounts of energy and materials we can devote to those purposes. Until now the dynamism of growth has enabled us to stay ahead of accumulating environmental costs. As growth ends, the environmental bills for our last two centuries of manic expansion may come due just as our bank account empties.114
BOX 3.13 Atlantic Cod: A Story of Renewable Resource Depletion
In 1988, Canadian newspaper and magazine articles (exemplified in a prominent Canadian Geographic story, “Almighty Cod”) celebrated the extraordinary success of the Atlantic Fishery. The fishing industry, including the practice of dragging-trawling, was presented in glowing terms, and it was suggesting that the cod fishery could lift eastern Canada out of its economic doldrums.
Just two years later, scientific reports showed that the fishery was in serious trouble, and fishermen reported their catches were declining rapidly (Canadian Geographic ran a new story by the same author titled, “Net Losses: The Sorry State of our Atlantic Fishery”). The turnaround was abrupt and catastrophic.
Canadian media began detailing the horrendous environmental costs of dragging-trawling. And scientists admitted that they really knew very little about cod.
Government quotas (special Company Allotments) succeeded in keeping prices stable, and fishing continued at levels that were still much too high, until it was obvious that cod populations had collapsed.
In 1992, a cod fishing moratorium was declared.
Nearly twenty years have passed since then, and despite the moratorium, fish stocks have not recovered. Indeed there is not much hope that they will at this point. There are still cod out there, but only a few fishermen go after them. The price is still good, but there is simply not enough cod to support the livelihoods of fishermen, let alone an entire industry. So now the industry has shifted its focus to shellfish, shrimp, and lobster.