SG Fleet Group Limited
| ASX code: SGF | investors.sgfleet.com | |
 | ||
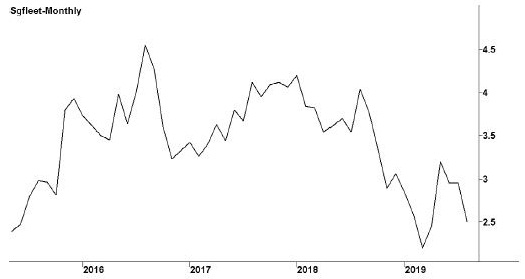
| Share price ($) | 2.40 | |
| 12-month high ($) | 4.05 | |
| 12-month low ($) | 2.05 | |
| Market capitalisation ($mn) | 628.6 | |
| Price-to-NTA-per-share ratio | ~ | |
| 5-year share price return (% p.a.) | 12.0 | |
| Dividend reinvestment plan | No | |
| Sector: Industrials | Company | Sector |
| Price/earnings ratio (times) | 10.3 | 18.3 |
| Dividend yield (%) | 7.4 | 4.1 |
SG Fleet, based in Sydney, has its roots in the formation in 1986 of Leaseway Transportation, a specialist fleet management company. Leaseway was later sold to the Commonwealth Bank, which in turn sold it in 2004 to a South African company, Super Group, who renamed it FleetAustralia. In 2014 it was listed on the ASX as SG Fleet Group. Today it offers a range of fleet management services, in Australia, New Zealand and the United Kingdom. It also provides salary packaging services. It operates under the brands SG Fleet and, in the UK, Fleet Hire. South Africa's Super Group continues to hold a 59 per cent equity stake in the company.
Latest business results (June 2019, full year)
A decline in new car sales hit the company, and revenues and profits were down, with some second-half strength — following the federal election and an interest rate cut —insufficient to offset the declines of the first half. Despite a 10 per cent decline in new car sales during the year, the company saw novated sales down only 3 per cent. The company's corporate business remained steady, with some new contracts and growth in accessory sales. British business represents around 20 per cent of total company turnover, and sales and profits were up, thanks to some new contract wins. These came despite poor business confidence and continuing Brexit uncertainty. New Zealand operations enjoyed an excellent year, with a double-digit rise in sales and profits, though this business is responsible for only about 3 per cent of company income. The company's total fleet size fell from 147 703 vehicles in June 2018 to 139 945 vehicles in June 2019.
Outlook
SG Fleet occupies a solid position in a competitive industry. It generates good profit margins, and as it grows it achieves significant economies of scale that boost margins higher. However, its business is influenced to a degree by the state of the economy, and in particular the level of new car sales. Nevertheless, it enjoys a large amount of annuity-style income, with many long-term clients, as it is costly for a car fleet customer to switch providers. It expects a series of new products to solidify relationships with existing customers and attract new ones. Its new Inspect365 vehicle inspection system has generated a pleasing response and its eStart electric vehicle transition planning service has helped deliver new customers. The company expects continuing solid growth from British operations, although Brexit issues may dampen short-term results.
| Year to 30 June | 2018 | 2019 |
| Revenues ($mn) | 513.9 | 508.1 |
| EBIT ($mn) | 104.2 | 93.7 |
| EBIT margin (%) | 20.3 | 18.4 |
| Profit before tax ($mn) | 96.0 | 85.8 |
| Profit after tax ($mn) | 67.5 | 60.5 |
| Earnings per share (c) | 26.30 | 23.20 |
| Cash flow per share (c) | 37.46 | 35.33 |
| Dividend (c) | 18.74 | 17.69 |
| Percentage franked | 100 | 100 |
| Net tangible assets per share ($) | ~ | ~ |
| Interest cover (times) | 12.7 | 11.8 |
| Return on equity (%) | 28.3 | 22.8 |
| Debt-to-equity ratio (%) | 12.4 | 8.9 |