Technology One Limited
| ASX code: TNE | www.technologyonecorp.com | |
 |
||
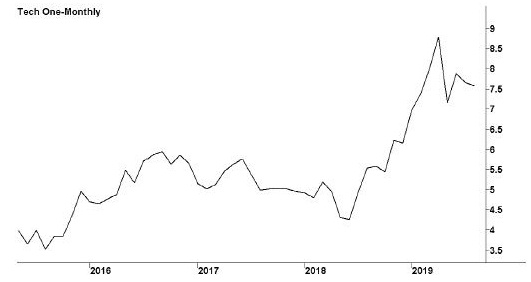
| Share price ($) | 7.47 | |
| 12-month high ($) | 9.39 | |
| 12-month low ($) | 5.05 | |
| Market capitalisation ($mn) | 2369.1 | |
| Price-to-NTA-per-share ratio | 149.4 | |
| 5-year share price return (% p.a.) | 19.0 | |
| Dividend reinvestment plan | No | |
| Sector: Information Technology | Company | Sector |
| Price/earnings ratio (times) | 46.3 | 29.4 |
| Dividend yield (%) | 1.2 | 1.6 |
Brisbane-based TechnologyOne, founded in 1987, designs, develops, implements and supports a wide range of financial management, accounting and business software. It has gained success with its TechnologyOne Financials software product, and enjoys particular strength in local government. Its software is also used by educational institutions, including many Australian universities. Other key markets are financial services, central government, and health and community services. It derives revenues not only from the supply of its products but also from annual licence fees. It operates from offices in Australia, New Zealand, Papua New Guinea, Malaysia and the UK. It has opened research and development centres in Indonesia and Vietnam.
Latest business results (March 2019, half year)
TechnologyOne enjoyed a big surge in profits as increasingly it succeeded in moving its customers onto its Software as a Service (SaaS) cloud platforms. The number of large-scale enterprise SaaS customers rose from 280 at March 2018 to 389 a year later, with fees up 42 per cent to $37.5 million. The company also benefited from a turnaround in its consulting services — essentially the implementation of its software — with this business moving from loss to profit, despite a slight dip in revenues.
The company's British operation saw its loss falling from $3.2 million to $0.9 million. In addition, company operating expenses fell 7 per cent to $104.8 million. However, the company conceded that new accounting standards have magnified the extent of its profit growth. It maintained its high level of research and development spending, up nearly 9 per cent to $27.8 million.
Outlook
TechnologyOne has become a star among Australian high-tech companies, with growing profits and regular dividend increases. In large part this reflects a strong product line, a solid flow of recurring income and a heavy investment in new products and services. It is now achieving great success with its SaaS offerings, which put software in the cloud, rather than on the customers' own computers, meaning that the customers always have the latest software versions, and giving them greater flexibility than previously. TechnologyOne has achieved an SaaS annual contract value of $85.8 million, and believes this could rise to $107 million by September 2019. The company forecasts a September 2019 pre-tax profit of $71.6 million to $76.3 million, and predicts that it will double in size over the coming five years, with new machine learning and artificial intelligence products, a significant contribution from British operations and the possibility of an entry to the US market.
| Year to 30 September | 2017 | 2018 |
| Revenues ($mn) | 271.6 | 297.1 |
| EBIT ($mn) | 57.3 | 66.2 |
| EBIT margin (%) | 21.1 | 22.3 |
| Profit before tax ($mn) | 58.0 | 66.5 |
| Profit after tax ($mn) | 44.5 | 51.0 |
| Earnings per share (c) | 14.18 | 16.14 |
| Cash flow per share (c) | 15.53 | 17.50 |
| Dividend (c) | 8.2 | 9.02 |
| Percentage franked | 75 | 80 |
| Interest cover (times) | ~ | ~ |
| Return on equity (%) | 30.1 | 30.3 |
| Half year to 31 March | 2018 | 2019 |
| Revenues ($mn) | 123.6 | 129.3 |
| Profit before tax ($mn) | 10.6 | 24.5 |
| Profit after tax ($mn) | 8.2 | 17.9 |
| Earnings per share (c) | 2.59 | 5.65 |
| Dividend (c) | 2.86 | 3.15 |
| Percentage franked | 75 | 75 |
| Net tangible assets per share ($) | 0.10 | 0.05 |
| Debt-to-equity ratio (%) | ~ | ~ |
| Current ratio | 1.8 | 0.8 |