Table 3.1 National rural poverty rates in China measured by different lines
Source: Hussain (2002, p. 6), cited in Fischer (2005, pp. 96–99).
3 | MONEY-METRIC MEASURES OF POVERTY
This chapter presents an overview of the most conventional poverty measures: indirect measures based on income or expenditure, measured in units of money, here referred to as money-metric measures. The purpose is to highlight the degree of arbitrary and subjective discretion and choice that is involved in even these most restrictive forms of poverty measurement, which many consider the most scientific or objective, at least in principle, if exercised carefully. This arbitrariness is inherent in many of the steps of conceptualisation and measurement, implying that these poverty measures can easily be tweaked and adapted to support broader narratives and agendas, as discussed in the previous chapters. Political and ideological biases can also enter at each of these steps, even before these measures are applied to social and political economy realities, which invariably distort the measures even further.
The emphasis of the chapter is on the key axes of discretion that allow for the entry of politics and ideology into the calculus of these measures, to the extent that even carefully managed measures provide little reliable scientific indication of whether basic needs are actually being met and, especially, how this might be changing over time. In other words, given the wide variety of fairly arbitrary assumptions and choices that are required in order to first choose a line and then to apply this line to presumably accurate survey data in ways that are broadly consistent, accurate and comparable across time and regions, it is no exaggeration that poverty estimates – even estimates based on national lines – are quite arbitrary, even before considering the technical complexities of second-order measurement issues such as the World Bank purchasing-power-parity (PPP) conversions.
This point is acknowledged in some of the seminal texts by the doyens of poverty studies, such as Ravallion (1992). However, his response to this quandary is that we must ultimately chose a line, whatever the line, and stick with it in order to allow for comparison and evaluation, so long as the line and the income it is judged against are accurately adjusted over time. But this just simply kicks the problem forward, given that adjustments to the line over time, in addition to evaluations of the nature and structure of incomes, are even more complex, involving yet further arbitrary choices and biases.
This leads to the classic quandary of whether poverty trends over time reflect actual changes or else errors of adjustment and conception. For the sake of being provocative, even the income of a beggar will rise with rising prices. If the poverty line is set too low or adjustments to the line are insufficient, his or her situation could appear to be moving out of poverty even in the absence of any substantive change, besides receiving dimes instead of pennies. Moreover, this is with respect to national poverty lines. The international estimates provided by the World Bank involve even greater degrees of arbitrariness and, as such, are highly contestable even though they are the main data relied upon by the leading international organisations spearheading the promotion of various development goals. The evaluative emphasis also sidesteps the dilemma that, once applied to the social and political economy realities of policy-making and actual distributions of benefits and poverty relief, the problems of these poverty measures become compounded by social and power relations.
The last point on actual application to social political realities of course applies to all poverty measures and will be addressed further in the conclusion of the book. However, one additional particularity of absolute money-metric measures that is broached in the last part of this chapter is that these measures are prone to a secular tendency to gradually underestimate absolute poverty over time in the context of structural and institutional changes associated with development. This is due to three fundamental sources of bias in such absolute measures. One is based on declining terms of trade for food, which gives greater relative prominence to non-food essential needs over time. This is not reflected in poverty lines that continue to be anchored by reference to minimal food requirements and that more or less treat non-food needs as a constant share of food needs, as is standard. The second is more fundamental, in terms of the shift from self-provisioning to commodified consumption, which in many respects overestimates the value of the latter relative to the functional value of subsistence of the former. The last is more proximate to the neoliberal era of commoditised social provisioning, in particular the substantial commoditisation and privatisation of health and education. A fundamental problem with money-metric measures of poverty is that they are biased by design against universalistic and de-commodified forms of social provisioning, such that a move towards greater commodification can actually be reflected as an improvement in poverty, all else held constant.
These points are discussed in the following three sections. The first clarifies my use of the term ‘money-metric’ and also discusses the notions of dimensionality and indirect measures, as represented by such approaches. The second presents an overview of such poverty measures in order to clearly highlight the degree of arbitrary and subjective choices that are involved in the successive steps of measurement and the huge difficulties in setting any measure that can be considered rigorously reliable as an evaluative standard over time. The third section elaborates the three institutional and structural sources of bias that have led to a secular underestimation of money-metric poverty rates over time.
Clarifications on the metric of money and unidimensionality
As a starting point, my use of the term ‘money-metric’ should be clarified. Income and expenditure measures are often referred to as ‘monetary’ measures (e.g., see Laderchi et al. 2003). This label gives the impression, however, that their primary concern is with income or expenditure that occurs in monetary form, which is a common but misconstrued criticism often levelled against these measures. Indeed, there is an increasing reaction against such measures along such lines, usually conjoined with an advocacy of multidimensional measures. Similar to criticisms of GDP, the focus on monetary measures of wellbeing is often purported to cause or reflect an obsession with money and economic growth as development goals.
While there are plenty of problems with such money-metric measures, as explored in this chapter, the common perception that they are primarily concerned with monetised incomes is misconceived. Conventional income or expenditure surveys – especially rural surveys – are usually designed to record all sources of livelihoods, including monetised sources (e.g., selling crops for cash or wage labour) as well as non-monetised sources. The latter are referred to as ‘income in kind’ or ‘own consumption’. They are also often conceived as ‘subsistence production’, meaning that the household directly consumes much of what it produces and supplements this consumption with lesser or greater degrees of commodity consumption, financed through the sale of the non-consumed surplus or through other sources of income. This is in contrast to so-called ‘commercial farmers’, who sell most of their produce and then use the proceeds to purchase most of what they consume, as is more typical in richer countries or among large-scale farms everywhere. The value of ‘own consumption’ is usually approximated in surveys by using market prices, as if it would have been sold, and then this value is included within the measure of incomes.
Obviously, many things might be missed by such attempts to calculate the volume and/or value of non-monetised income or consumption (calculating the value of owner-occupied housing faces comparable problems). In many cases people might also forget or not know the exact amounts they consumed. However, similar problems also face the reporting of monetary incomes, especially given the tendency of people to under-report these incomes.
There is also much debate, such as in the feminist and gender studies literature, about what gets included or excluded in the calculation of non-monetary incomes, particularly with respect to unpaid domestic work. The inclusion of own-consumption of food follows a traditional logic of production, in that something tangible is produced and consumed, even if it is not sold. However, this distinction is less credible when located within the increasing prominence of service-sector work in poor countries. The distinction in such cases would therefore seem to rest on whether an activity contributes income (monetary or non-monetary) that can be used to provide for basic needs, or else enhances consumption. The question then, from this narrow poverty perspective, is the degree to which unpaid work offsets some of these needs or enhances consumption through some other means. Simply calculating the hours worked and then multiplying these by a reference wage, as is a common way of estimating the value of domestic work, is not necessarily appropriate given that it does not necessarily give a sense of how such work contributes to achieving a minimum standard of consumption.
Similarly, much of unpaid domestic work is directly related to production, such as in farming households or in many urban households engaged in informal activities such as hawking or catering, and as such is essential to survival. However, the question from a poverty evaluation perspective is whether such work should be calculated as an income that augments consumption versus an input that is required to realise income. The latter accentuates the problem faced by the poor of ‘low labour productivity’ or, more appropriately, of low value-added earned for their labour time. In other words, just because something can be ascribed a monetary value does not necessarily mean that it will have a substantive effect on poverty and/or its reduction. Slave labour can be ascribed a monetary value, but this does not mean that the slave will be any better off as a result.
For the purpose of the present discussion, all of these points of contention highlight that conventional measures of income are not restricted to only monetised incomes. Due to the confusion, I prefer to use the term ‘money-metric’ versus ‘monetary’ measures because, in effect, the issue is more precisely about the choice of a metric for the purposes of aggregation rather than the valuing of money. Poverty evaluation invariably requires adding up various measures through a common unit that can be compared to a threshold measured in the same unit, e.g., dollars and dollars, calories and calories, kilograms and kilograms, etc. The use of a unidimensional metric in this sense does not necessarily mean that only one dimension is being measured, but that various dimensions must be converted into a common unit for the purposes of evaluation. The same is ironically required in so-called multidimensional measures, which ultimately must also convert multiple dimensions into a single metre in order to make poverty evaluations, as discussed in the next chapter.
With money-metric measures, the choice of this common unit is money, with the logic that income remains a primary concern and a strong indirect indicator of poverty, regardless of other legitimate concerns raised by other dimensions such as health and education. Using money as a unit obviously restricts measurement to only those things that can be logically converted into money units and excludes those things that cannot be converted (such as health, education, etc.), hence the criticism that it is only concerned with the commodity space (as per Amartya Sen) or with private versus public goods (e.g., see this point in Laderchi et al. 2003, p. 249). However, as discussed in the following chapter, the alternatives also present their own sets of problems.
For instance, the commonly used alternative to money-metric evaluations of income or wealth is based on using proxies, referred to as proxy means testing (e.g., Grosh and Baker 1995; Brown et al. 2016). In practice, this is often referred to as a consumption measure. The proxies are things that are easy for a surveyor to observe during a visit to a household, thereby circumventing the problems of people recalling and self-reporting their incomes or consumption, or otherwise measuring incomes or consumption in the absence of formal data or even numeracy of the surveyed respondents. Proxies also generally reflect the results of consumption, especially of durable items. Examples include the state of flooring and ceilings in a house, the number of light bulbs, existence of piped water, ownership of assets such as cattle, bicycles or cars or the ownership of durable goods such as televisions or mobile phones. The choice of proxies is supposed to be based on studies that find a strong degree of positive association in certain contexts at certain periods of time between the possession of these proxies and the likelihood of not being in income poverty. In other words, the proxies (or lack of them) are argued to be strong predictors of whether or not a household is poor (although Brown et al. (2016) critically assess proxy means testing in nine African countries and conclude that, while generally effective in filtering out the non-poor, proxy means testing usually also excludes many poor people and is particularly deficient in reaching the poorest). However, it is important to point out that unidimensionality is not avoided in the case of these proxy measures. Rather, the proxies are converted and aggregated into a common unit, hence they are equally as unidimensional as money-metric measures.
In this respect, there are advantages and disadvantages to all approaches. The enduring quality of money-metric approaches is that they are intuitive (besides the one-or-more-dollar-a-day purchasing-power-parity poverty line of the World Bank, which seems intuitive but actually is not, as discussed below). National poverty lines expressed in national currencies are intuitive for residents of those countries. The rough significance of a poverty line of 1000 pesos a month is clear to someone living in a country that uses this currency and understands the relative value of the amount. However, in the case of proxy ‘consumption’ measures, a poverty line is usually expressed as simply a number, such as 35, which has no meaning whatsoever for anyone outside of the circle of experts who devised the measure or who are trained to comprehend it.
The tangibility of a money-metric line can provide the basis of contestation by the poor or those representing the poor, whereas the opacity and obscurity of proxy measures would have a tendency to disempower such contestation if only through the force of sheer incomprehension. Indeed, it might even be argued that a certain degree of deception is involved in surveying for such proxies, to the extent that a surveyed person might not understand that their poverty is being judged when a surveyor asks them whether or not they own cattle or counts the number of lightbulbs that they might have in their home.
The relevance of the proxies might also change over time and, given their focus on durable goods, they are not helpful for understanding short-term fluctuations in incomes (hence one reason why they miss out a lot of poor people). For example, the ownership of a mobile phone might have been a relevant indicator of not being in poverty in 2005 but much less so in 2015, when mobile phone ownership became much more affordable and pervasive among the poor. Similarly, past purchases of assets or durable goods might not reflect current conditions. The fact that proxies might reveal poverty only once assets are eroded or sold off is, itself, a major fault of such measures. Even if proxy means surveys are conducted regularly enough to provide insight into short-term fluctuations, which generally they are not,1 these deficiencies should be important considerations for social protection programmes that aim to provide short-term income support to households in the event of economic shocks and downturns.
Hence, while much ado can be made about the use of money as a metric, the approach remains one means to aggregate within one important dimension of poverty, among a range of other imperfect options, and aggregation is also a problem with other approaches. In this sense, it is important to avoid building straw men. Money-metric poverty measures do have biases and it is essential to understand these biases in order to compensate for them, but the use of a money-metric does not necessarily imply a belief that money or income are primary overriding goals and priorities. Rather, they reveal very important information, even though they do not reveal all of the information that is relevant to understand poverty, nor were they necessarily conceived to do so.
Indeed, a similar case can also be made for national accounting (i.e., GDP) statistics. These have also been criticised as instilling a fetishism for growth and as being inappropriate for measuring the wellbeing of a society, even though they were not conceived for this purpose. Rather, national accounting data are conceived for measuring the creation and circulation of monetary value added in an economy and, as such, are very important for understanding how value added is distributed, across sectors and in particular between profits and wages. They are important as such in their ability to provide information to governments about where profits are being made in an economy and hence where they might be taxed, among other information that is necessarily expressed in monetary terms because economic actors effectively operate with money and are motivated by monetary value. The danger of efforts to transform national accounting into something that might, according to various propositions, better reflect wellbeing, sustainability or other objectives is that this original information then becomes obscured or even lost, particularly if efforts to reform result in more abstract metrics given the inclusion of many non-monetary variables. Indeed, this obscurity might even advantage powerful economic interests, who otherwise would continue to track the circulation of value in the economy as a means to profit from it, increasingly through their own private means. In other words, the risk of obfuscation is that, despite the progressive intentions, it dilutes our ability to understand and contest the core dynamics of power and wealth in modern economies.
Indirect measures
As briefly presented in the previous chapter, money-metric measures of poverty are also the epitome of indirect measures. Money is not happiness (or welfare) and it does not even have a direct relationship to standards of living (e.g., see Gordon 2006 for a discussion of this). However, it is nonetheless a crucial dimension in the economics of human existence, for survival, basic needs, functioning and beyond. This is especially the case in societies that are immersed in monetised forms of commodity consumption and where poor people are acutely aware of their relative insufficiency of income even if they have access to acceptable levels of education and health care. The same consideration even applies to non-monetary forms of income or consumption in less-commoditised economies, insofar as the amount of consumption permitted by so-called subsistence production is generally understood within such societies as an indicator of wealth (e.g., see Fischer 2006, 2008b, 2014 for a discussion of this). Hence, while income (in both monetary or non-monetary forms) is not necessarily a cause of wellbeing in a positive sense, a lack of it below certain survival needs is definitely a source of illbeing, for all but the enlightened perhaps. In this restrictive sense, it can be considered an appropriate indirect reflection of poverty at the lower bound, in that it identifies situations where we can expect standards of living to be deficient, with the likelihood that this also has a negative impact on wellbeing.
There are, of course, a multitude of debates about whether income or consumption reflect welfare, and even different understandings about what constitutes welfare. In his seminal text on poverty measurement, Ravallion (1992) discusses the relation between income and welfare in some detail, although he uses the term ‘welfare’ in reference to the idea of ‘utility’ in modern welfare economics, which is not exactly how welfare might be popularly understood by the layperson as referring to actual objective needs. Rather, his discussion relates to the standard utilitarian welfare economics presumption that utility is imputed by the market value of consumption, as ‘revealed preferences’. This presumption, however, is very difficult to prove and also results in a circular, if not tautological, reasoning. It is particularly problematic in real-world contexts where poor people might not have enough income to reveal all of their preferences, where their choices are constrained through various economic and social forces, and/or where they are not necessarily free to make certain choices or to withdraw from hypothesised market bargaining processes, whether due to poverty, coercion or else by more nuanced processes of social conditioning. Hence, despite Ravallion’s digression and much theoretical musings on this in economics more generally (and occasional attempts to measure ‘utility’), the discussion does not have much practical relevance within poverty studies and income is typically understood as an indirect measure of poverty rather than a direct measure of utility. Direct measures of poverty are instead mostly focused on ‘objective’ measures of wellbeing, such as nutrition, education and health, as discussed in the next chapter.
The arbitrariness of money-metric poverty measurement
Whereas the fetishism of money is not necessarily a valid criticism of money-metric poverty measures, they nonetheless succumb to several fundamental problems. One concerns the arbitrariness of choice in such measures, such that evaluation is in effect very difficult to do in practice, particularly once social scientific pursuits are applied to the social and political economy realities of policy practice. This is important because it provides the ease with which such measures can be manipulated for political purposes. Another problem concerns certain fundamental biases against more universalistic forms of social provisioning that are built into such measures, as an artefact of how these measures are constructed. For the purpose of highlighting and clarifying these problems, it is useful to first briefly examine the standard methods in the study of money-metric poverty in order to reveal the arbitrariness of choice involved.
As noted in the previous chapter, there are essentially two sides involved in poverty measures. In the case of money-metric measures, one is the measurement of income, expenditure or wealth, and the other is the calculation of the poverty line, that is, the threshold under which one is considered to have deficient income, expenditure or wealth. The former is used for measuring other things than simply poverty, such as household inequality (except when surveys are conducted solely for the purpose of measuring poverty, such as when samples are drawn from social registers that only cover parts of the population where poverty is expected to be most concentrated, in which case, other surveys need to be relied on to measure inequality). The key difference between inequality and poverty measures in this respect is that inequality measures do not generally rely on the idea of a threshold (although, as highlighted in debates over various inequality indices and their interpretation, they also have their share of problems). In this respect, the poverty line is the particular source of contention.
Surveying
The first step in the measurement of income involves the fundamentals of surveying, as examined in great detail, for instance, in the formative work of Angus Deaton (1997). Surveys typically use clustered stratified random samples in order to guarantee some degree of representativity of the larger population, to the extent that relatively accurate social or civil registers of the entire population exist, which is a problem in many countries. As commonly noted, this leads to problems of excluding those populations that are hard to reach, such as homeless or temporary residents, particularly in cases where such populations are not sufficiently recorded in various civil registries that are used as the basis for random sampling. This is a problem in China, for instance, where household income and expenditure surveys are generally drawn from households registered as permanent residents in that locality, meaning that they omit migrants or even long-term residents who are still formally registered as temporary residents (see Hussain 2003; Fischer 2005). Different methods are also used to record incomes or expenditures, from one-off interviews relying on on-the-spot recall by interviewees, to keeping log books in households, which are filled by household members, presuming of course that they are literate, numerate and also able to conduct basic accountancy tasks.
The choice between measuring expenditures versus incomes has received much attention in the literature. Expenditure is conventionally said to be better because it is more regularised due to consumption smoothing, whereas incomes are more volatile. This would be especially common in agricultural areas; incomes are concentrated around harvest time and are otherwise sparse, and people borrow or use savings in periods when incomes are not sufficient in order to maintain consistent consumption, of food in particular. Financial intermediation is common in poor rural communities precisely for this reason, as classically noted by Hill (1966),2 even though this basic insight ironically runs contrary to the assumption in the microfinance literature that poor people need to learn the savings habit. Expenditure reporting is also said to be less subject to the tendency of people to under-report their incomes. Moreover, it is said to be better because it is often easier for people to recall what they consumed rather than what they earned, especially in rural economies with diversified livelihoods, many of which might not be monetised, and in which much income might be shared across households in extended family or community networks. Indeed, many people consume even if they do not earn income, through pooling and sharing within such networks. The standard way of dealing with this in income or expenditure surveys is to deal with households rather than individuals as the basic accounting unit in order to deal with the income and resource pooling and sharing that typically takes place within a household. However, household boundaries can be tricky and sharing does not necessarily happen within them, in terms of how they might be identified by a surveyor (e.g., see Randall and Coast 2015; Palacio 2017).3
Despite these contentions, the case for expenditure or consumption has been arguably oversold and there is a growing scholarly reaction against it, as synthesised by Jolliffe and Serajuddin (2018). The reaction includes doyens in the consumer behaviour of the poor, such as Banerjee and Duflo (2007) and Banerjee (2016). The main point, as noted by Parker (2015), is that poor households (in income or in liquid wealth) typically do not smooth consumption, partly because they are not able. As would be obvious for anyone with experience living in rural agrarian settings, consumption and expenditure actually do vary substantially throughout the year, particularly between lean and harvest seasons, and they tend to spike in the latter, similar to the case of income. Volatility is also exacerbated by expenditures during festivals (e.g., Christmas or Diwali), or lifecycle events such as weddings or funerals, all of which can amount to major sources of variation depending on the timing of a survey (this point is made by Banerjee and Duflo 2007, although it has been well established in anthropological literature since the origin of the discipline). Consumption also includes consumer durables, especially when economies of scale are sought at the household level, which can also lead to lumpy expenses over time. Hence, while ordinary recurrent expenditures might be smoothed over a year, such as on food (but not necessarily, as noted above), overall consumption typically is not. To reinforce these points, Jolliffe and Serajuddin (2018) note that while most poverty estimates are based on enumerations taken at a single point in time, poverty estimates can vary substantially if households are interviewed at multiple times throughout the year. Using an example from Jordan, they illustrate that repeat visits result in a poverty rate that is 26 per cent higher than the estimate based on a single-visit interview. The fact that it has taken so long for the consumption smoothing proposition to be challenged (even though it continues to be reiterated) is a case in point about how these ‘truths’ are established through the force of uncritical repetition rather than being based on grounded experience.
In addition to these critiques, expenditure measures do not indicate how expenditure is financed, that is, whether it is paid for through earnings, savings or debt. They might therefore miss out important information about the sustainability of consumption, which incomes can reveal, such as whether consumption is eroding savings and assets, or if households are borrowing in order to sustain consumption. Income is arguably preferable to consumption measures precisely for this reason.
In any case, many surveys include both income and expenditure and, on average, expenditure amounts to a fairly regular fraction of incomes. As noted by Hussain (2003) in the case of household surveys in China, which measure both, the use of expenditure rather than income effectively operates as the equivalent of a higher poverty line (because the same line is used against expenditure data that are, on average, a fraction of the income data). He recommends using both in order to have a better understanding of the gradation of poverty as well as the sensitivity of poverty rates to changes in such measures or the poverty line.
Without even advancing to the subsequent step of determining a poverty line, much information can be derived from this initial step of measuring income, expenditure or wealth. Indeed, the most useful information is arguably attained at this stage and the poverty line itself is a fairly arbitrary exercise, although one that receives most of the attention, as described further below. For instance, as noted above, information about inequality can be derived from these data. The structure of income distribution can also be observed through frequency distributions, which show how many people or what proportion of people are at each level of income. Such frequency distributions are much more informative than poverty rates given that they show the clustering of populations at various income levels as well as the polarisation of income distributions, among other information, such as in the excellent studies of both population and consumption density distributions based on World Bank PPP data by Edward and Sumner (2013, 2014, 2015, 2016). Useful information can be similarly gleaned through analysing representative households, such as at the 10th, 25th, median, 75th and 90th percentiles of a sample (presuming that the sample includes a representative range from poorest to richest households, which is often not the case), or else by analysing the average characteristics of each decile or quintile of the population sampled. The use of representative households or deciles must be interpreted with caution because they do not represent a consistent household or group over time due to churning in the population from survey to survey, whereby households change positions, some rising and others falling, with the net effect often being cancelled out. Moreover, these latter methods are not able to tell us what proportion of the population falls beneath a fixed poverty line (unless the poverty line is set relatively at a particular percentile, as discussed below).
Varieties of poverty lines
In terms of setting poverty lines, the key question as discussed in the previous chapter is whether or not there is some scientific or conceptual rationale for establishing a threshold, in this case, an income or expenditure threshold. In other words, is there some point that can be identified below which things start to fall apart, or people experience a reality flip in terms of their ability to maintain nutrition, health and other functions?
There are a variety of different approaches to conceptualise or operationalise such a threshold. As discussed further below, the dominant ‘absolute’ approach is in terms of basic food and non-food needs. Food (or physiological) needs are expressed in terms of calories needed per person per day, supplemented with an allowance for a minimum of non-food essentials (e.g., at the very least, the poor need to be able to cook their food). Other approaches, as reviewed by Saith (2005), include the so-called inductive empiricist approach, such as using consumer behaviour studies to determine a consumption basket, and self-defined approaches. However, these are not as common, especially for large-scale surveys designed to evaluate poverty at regional or national scales.
On the other hand, political-administrative methods are abundantly used, although these are associated more with policy interventions rather than with accurate evaluations of poverty. They are often referred to as ‘benefit lines’, in the sense that they are used for means-testing whether or not people qualify for poverty relief or benefits of various kinds. Precisely for this reason, the level at which such lines are set is usually driven by political and budgetary considerations and they often change due to political or economic circumstances. Indeed, benefit lines are often not indexed to inflation (in contrast to social security, which generally is), which becomes an important means of depreciating these lines over time. Lack of indexing also requires (often politicised) discretionary government interventions to raise these benefit lines, which does not particularly inspire confidence as to their accuracy or comparability over time. In this sense, such lines usually cannot be used for any credible evaluation of poverty, especially over time, even though they are often misconstruedas such.
For instance, in the late 1990s, the National Bureau of Statistics of China estimated the absolute rural poverty line, based on 2100 calories a day, at around 865 yuan a year, whereas the official (or benefit) line was only 635 yuan (Hussain 2002). Despite this discrepancy, it was the latter official line that was commonly referred to at the time in official pronouncements on poverty by the government or by international organisations such as the World Bank, which cited that the rural poverty rate in China had dropped to 3.5 per cent by 2000, or about 32 million people (ibid., p. 3). In addition, there might be many benefit lines for different purposes, such as in China where the official ‘benefit’ line in the late 1990s was again different from the lines that were used to determine whether particular counties were to be considered ‘poverty-stricken’ and hence eligible for poverty relief funding. Notably, all of these administrative lines that are used for the allocation of resources and benefits become contested in the political economy struggles over budgetary allocations, citizen entitlements and so forth. Even the absolute line in China in the late 1990s was contested, including by the then-Premier Wen Jiabao in 2003, given that many people deemed it far too low (see Fischer 2005, pp. 96–99). It has since been revaluated upwards several times, up to 2300 yuan in 2015, which represents an adjustment that is far beyond the rate of price inflation over these years.
More relative approaches to setting the line emphasise the idea of social norms or socially acceptable minimums, as discussed in the previous chapter. The common relative approach, such as that used in Europe, is to define the poverty line as 60 per cent of average incomes. However, this is more of an inequality rather than poverty measure, insofar as such a threshold offers no indication of whether those below the threshold are meeting basic needs (although the European Union tries to compensate for this by also measuring ‘severe material deprivation’ alongside ‘monetary poverty’). It is also unreliable as constant standard because the line changes with changes in the average. Indeed, the line would fall in times of recession, when average incomes fall, contradicting the fact that more people would logically be poor under such conditions. As noted above, using representative households is a similar relative measure, whereby one observes the characteristics of households at fixed percentiles within the income distribution. In order for relative measures to go beyond such inequality-type measures, they arguably need to be grounded in some conception of minimum needs or standards, except through a relative rather than absolute conception of need, as discussed in the previous chapter.
This relates to the debates about absolute versus relative poverty lines, exemplified by the classic duel between Amartya Sen (1983, 1985) and Peter Townsend (1985, 1993). The absolute archetype is starvation, but as noted by Townsend, even starvation is a gradual process with many gradations, such that it is difficult to determine a precise cut-off point whereby a deficient income becomes hunger and hunger becomes starvation. Townsend argued instead that minimum standards for subsistence are relative to societies, groups and contexts, including the basket itself, the pricing of the basket and the entitlements needed to access the basket or other essential needs. But this raises the perennial question of how to measure such standards, especially if one’s motivation is to devise standardised and comparable measures for an entire national population or even across countries. This latter point is perhaps part of the reasoning for Sen’s critique of Townsend, in terms of cutting through the semantics and arguing for a decisive absolute minimum standard applied to all. The irony is that Sen himself has similarly argued elsewhere that such absolute minimum standards should be the construct of local democratic deliberative processes, which more or less ends up agreeing with Townsend’s position.
Interestingly, Ravallion (1992) himself has argued that the notion of absolute poverty should not be about mere survival, such as with food poverty lines based only on calorie minimums. But in recognising the difficulty of being able to objectively determine such a line, he has argued instead that what is more important (for comparison purposes) is that the line, whatever line, however chosen, should remain fixed and constant across space and over time. This is probably why his subsequent work became so focused on measuring purchasing power parities across countries and across time – the only justification for such measurement projects are for global comparisons and evaluations.
World Bank purchasing-power-parity poverty lines
Amidst these various approaches that are grounded on at least some attempt to provide a rationale for basic needs, the line that currently dominates attention is the one-dollar-(or-more)-a-day purchasing-power-parity (PPP) poverty line of the World Bank. More precisely, this started as $1.08 a day, then was increased to $1.25 in 2008 based on 2005 data, and was further revised to $1.90 in 2015 based on 2011 data. In non-technical public presentations (e.g., WB 2015), the claim is that the revisions represent changes in the cost of living. In practice, however, they represent both cost-of-living adjustments as well as the inclusion of new information derived from the newer surveys. As a result, it is not actually clear whether the $1.90 line in 2011 is actually the equivalent of the $1.25 line in 2005, as is often implied by the Bank. Indeed, this was a major focus of a high-level Commission on Global Poverty that the Bank convened in 2015 (see WB 2017a).
Even more fundamentally, the line is not clearly grounded on any social-scientific approach to measuring basic needs. Rather, the Bank defers to and relies on national poverty lines for performing such assessments, as it specifies in its response to the recommendations of the high-level Commission in WB (2017b). This refers to the original determination of the line at $1.08 (once converted into PPP terms), which was based on averaging the national poverty lines of six poor countries that had reasonably sufficient data. The revision in 2008 extended this to the national poverty lines of 15 countries.
To be clear, ‘national poverty lines’ in this sense refers to the politico-administrative lines – or benefit lines – mentioned above. The problem, as noted above in the case of China, is that these official poverty lines in poor countries are usually notoriously deficient, often because of resource constraints given that higher lines might oblige governments to spend more than they are able. Angus Deaton has noted this problem in the case of India (Deaton 2010). Statistical systems in many of these countries are also seriously deficient, particularly after years of structural adjustment programmes that crippled state statistical capacity (e.g., see Jerven 2013). Indeed, statistical capacity was highlighted by the Commission as a major point of concern in global poverty evaluations (WB 2017a). Moreover, even where such statistical systems are sufficient, such as in India or China, official poverty lines are a subject of constant political contestation and are regularly revised (or not) in function of these contestations between various contending power factions. For instance, as previously mentioned, the ‘absolute’ line in China was revised from 865 yuan per person per year in the late 1990s to 2300 yuan by 2015. Meanwhile, poverty lines in India were modestly revised upwards after the Tendulkar Committee recommended this in 2011, up to roughly 27 rupees per person per day in rural areas and 33 rupees in urban areas. However, subsequent revisions have not been made despite similar recommendations from the follow-up Rangarajan Committee in 2014, which recommended that the line be raised to 32 and 47 rupees, respectively. Since that time, the ‘Great Poverty Debates’ in India seem to have been eclipsed by other issues.4
As a result of relying on such official lines, the very birth of the dollar-a-day concept was arguably underestimated as an effective measure of even absolute poverty and it lacked any rigorous or reliable grounding in notions of basic needs. Instead, it was an artefact of the very politicised exercises of minimal poverty line setting in very poor countries with very weak social assistance systems and very constrained fiscal resources. Indeed, this is one reason that is given for the regular revisions that have been made to the line since that time, with the inclusion of new information that might better reflect absolute or basic needs. However, any serious revision according to these considerations has been resisted because it would undermine the legitimacy of the line as a gold standard of international poverty comparisons over time. For this and other reasons, the World Bank has defended its choice to remain with the original logic of using national official lines as the basis for calculating the international PPP line. It argues this case in WB (2017b, pp. 6–7), claiming ‘that it would be paternalistic and disrespectful to question the choices of the world’s poorest countries in terms of what constitutes poverty for them’ (even though, on other matters, the World Bank has shown no proclivity to avoid paternalism in its dealings with such poor countries). As such, the precise meaning of the line is unclear, even though the idea behind it seems intuitive: a universal measure that everyone can relate to, especially people living in the United States (although perhaps less so for poor people in other countries who have never had any contact with dollars).
An additional layer of obscurity is caused by the PPP conversions used, whereby a dollar does not really mean a dollar. This is a confusion that is so rampant in the general public understanding of the line, despite World Bank attempts at public education on the matter, that it even enters in places that are purported to clarify such matters. For instance, the Wikipedia page on ‘Poverty in India’5 states that the Indian poverty line of 26 rupees a day, or 43 USD cents, is ‘lower than the World Bank’s $1.25 per day income-based definition’, emphasising ‘income’ as if to suggest that this partly explains the difference, which it does not. Rather, a dollar is converted to local currencies based on the estimated relative purchasing powers operating in each location (hence the PPP line of India is substantially lower than one dollar’s worth of rupees at market exchange rates, whereas the PPP line of Japan is higher than one dollar’s worth of yen, and so on). The World Bank Commission recommended reporting the lines in national currencies to avoid the common confusions created when journalists and others simply convert $1.90 into local currencies at market exchange rates (WB 2017a and 2017b). However, this simply resolves the public relations issue, not the meaningfulness of the lines reported in whichever currency units. The more fundamental problem is that the project of setting a universal line to which all are evaluated in a standardised manner effectively obscures the meaning of that line in any particular context.
Much of the controversy has been focused on the question of how to make a comparable basket that is relevant for poor people. This was highlighted in the debates in the early 2000s between Ravallion (2002), from the side of the World Bank, and Pogge and Reddy (2002a, 2002b), who launched the original critique. This debate was also summarised by Wade (2004) and was implicitly alluded to in WB (2017a). The problem is not just with evaluating different purchasing powers for the same goods, but that the goods consumed by the poor in each context are different, relative to both other countries but also with respect to the local setting. Poor people typically consume different types and qualities of goods than wealthier people consume. The poor also typically pay different prices than wealthier people do. Indeed, one of the largest components of the general consumer price index (CPI) of Brazil is the cost of domestic servants, which poor Brazilians obviously do not employ, and a different CPI calculation is made for the poor that excludes these types of costs.6 The logic works in both directions; whereas it is commonly noted that poor people pay more per unit of various goods than wealthier people do (because the latter can purchase in bulk amounts, etc.), wealthier people often pay more for their goods because they shop in wealthier areas, especially in highly segregated societies (such as Brazil). All of these considerations can have huge effects on the calculation of the basket consumed by the poor, and hence on the poverty line and the resulting poverty measures, requiring careful and meticulous study of their consumption patterns (to the extent that these can reveal basic needs rather than substandard consumption due to deficient means). However, as noted above, the PPP conversions are not based on baskets consumed by the poor but on more general standardised baskets.
In this respect, the initial idea of PPP conversions was oriented towards making comparable assessments of the domestic purchasing power of national economies, that is, GDP.7 Because whole economies consume a much wider range of goods than poor people, it made sense to include luxury items that the poor would never consume, or else things like the cost of housing in, say, Tokyo. However, as the idea became applied to measuring poverty, the problem is that many of these items remained, despite having no relevance to the consumption of the poor, especially in poor countries. Pogge and Reddy (2002a) pointed out, for instance, that an increase in the cost of housing in Tokyo, all else held constant, would have the effect of lowering the PPP poverty line for everyone else, thereby lowering poverty rates in poor countries even though nothing would have effectively changed for the poor.
A comparable problem is evident, for example, in the well-known ‘Big Mac index’ produced by The Economist. In this index, the cost of a McDonald’s Big Mac in various countries around the world is used as the basis for comparing purchasing power and whether exchange rates are over- or undervalued. The fundamental problem with this idea is that a Big Mac is a poor person’s food in the US or in Europe, while it is considered to be a relatively wealthy person’s meal in poor countries such as India. A better comparison, for the sake of comparing purchasing power, would be to compare the cost of a Big Mac in the US with the cost of a dal bhat typically consumed by poor people in India, which would lead to very different results. In particular, it would raise the estimate of purchasing power of ordinary Indian incomes (although the Big Mac index is not used for this purpose).
Similarly, as I have analysed with regard to debates about whether China’s currency is undervalued (Fischer 2010c), an important point that is generally not considered in these debates is that a currency can be both over- and undervalued depending on whose consumption or production is referred to. While it can be debated whether China’s currency was undervalued relative to its manufacturing exports in the 2000s on the basis of its increasing trade surpluses in those years, it could equally be argued that its currency was overvalued for its farmers, given that the liberalisation of international trade in agricultural goods since the 1990s had been putting downward pressure on domestic agricultural prices and, hence, on rural incomes in China.
For these types of reasons, the international comparison lines based on the PPP conversions used by the World Bank are, to a certain extent, meaningless for the purpose of actually understanding local realities facing poor people in any particular context. At the very least, they muddy the water much more than they clarify, especially for the ordinary person’s comprehension. It is for this reason that many have come to increasingly argue for a return to the use of national poverty lines based on national data, that is, national lines based on credible or at least transparent and verifiable evaluations of basic needs or ‘absolute’ thresholds, rather than simply expressing the World Bank PPP lines in local currencies as recommended (WB 2017a) and accepted (WB 2017b) by the World Bank. By keeping things national, the basis for determining such lines becomes more tangible and accessible for public debate and contestation, and such deliberation remains within the national sphere rather than being relegated to supranational international agencies. Of course, this would not resolve the fundamental arbitrariness of such poverty lines, but at least it would make this arbitrariness more apparent and accessible for public debate.
Standard absolute approaches
As noted above, the World Bank (2017b) excuses itself from the task of evaluating the basic needs of poor people in specific contexts because it argues that basic needs or ‘absolute’ approaches to poverty measurement are already widely employed in the derivation of national poverty lines. Those national lines to which they respectfully defer, however, are generally administrative lines rather than ‘absolute’ basic needs lines determined in an independent social-scientific manner. It is nonetheless worthwhile to make a brief overview of the standard methods of the absolute approaches as this helps to highlight how even the best-case scenarios are so arbitrary and prone to subjective and often politicised judgements.
Absolute or basic needs poverty lines use a mix of both minimum calorie requirements (often known as the food poverty line) as well as an allowance for non-food items. The calorie component is in reference to physiological needs, framed in terms of the most basic level of nutrition deemed necessary for human survival. While this is attractive for giving the appearance of a hard objective standard, physiological needs are nonetheless heatedly debated in the literature and there is no consensus on what should be an appropriate number of calories to define a poverty line. Part of the problem is that there are huge individual and regional variations, such as with respect to height, climate, types of work, age, specific lifecycle needs such as those related to pregnant and lactating mothers and children, and so on. As a result, any standard will be inevitably wrong for a wide range of individuals that fall outside the standard.
In this sense, food poverty lines must be understood as reflecting population averages, for the purpose of making population-scale evaluations. However, this point itself runs counter to the logic of using of such poverty lines to target individuals for poverty relief and other benefits on the basis of individual need. That would arguably require taking into consideration individual differences in evaluations of need. While the latter option is generally seen by economists working on poverty as ideal but wildly unattainable, it also suggests that these practices of poverty measurement and targeting are not the best suited institutionally for identifying needs.
Common calorie standards typically work with 2100 calories per person per day, as is recommended by the World Bank (e.g., see Haughton and Khandker 2009). For instance, the food poverty line in China is defined according to 2100 calories (recall, this is not the official line, but the absolute line estimated by the National Bureau of Statistics, as discussed above). Sometimes 2400 calories or higher standards are used, and/or different amounts are differentiated for men and women, or for rural and urban areas (with the assumption that women need fewer calories on average than men, or that work in urban areas typically requires fewer calories than in the rural areas). India, for example, uses a standard of 2400 calories for rural areas and 2100 calories for urban areas.
As extensively documented by Sathyamala (2016), these calorie standards were whittled down over the course of the twentieth century. The Food and Agriculture Organisation of the UN (FAO) recommended 2830 calories for ‘moderate activity’ in 1957, whereas the Indian Council of Medical Research (ICMR) recommended 2700 calories in 1982. Lipton (1983) then recommended taking 80 per cent of the ICMR amount (2160 calories) to reflect the ‘ultra-poor’. Even lower levels were then recommended to reflect sheer physiological survival, based on a fraction added to the basal metabolic rate (BMR), which, it should be recalled, is the number of calories required for the basic functioning of a body at rest, engaged in no activity, variously estimated to be in an average range of around 1200 calories. For instance, in 1985, the FAO recommended an amount of 1550 calories based on 1.27 times the BMR (Payne 1990, p. 15, cited in Sathyamala 2016, pp. 106–107). In the FAO update on minimum dietary energy requirements in 2008 (FAO 2008), a hypothetical example resulted in an overall minimum daily per person energy requirement of 1680 calories per day, which appears to be consistent with the previous reductions in standards.
These reductions in standards were not necessarily for well-established empirical or scientific reasons (even though every standard is at least justified on the basis of some studies). Rather, as noted by Sathyamala (2016), they represented a reduction of norms from optimal to minimal levels of calories (let alone nutrition, which is generally not addressed, although it is notable that the FAO has more recently started to integrate nutrition into its conception and presentation of food security).8 Within the minimal, choices are taken on the degree to which the minimum should represent mere survival at fractions above the BMR or degrees of activity above the BMR. Indeed, given that human bodies are known to adapt to lower calorie intakes, as famously argued by Sukhatme and Margen (1978, 1982),9 choices even involve judgements about whether poverty should be evaluated relative to such adaptive survival abilities of the poor.
The standardisation of the 2100-calorie norm therefore needs to be put into perspective because it represents a lower range of minimal norms in sedentary work (whereas most poor people are not employed in sedentary work), rather than a level that could be considered optimal for healthy functioning (especially in non-sedentary work). Even higher calorie measures, such as 2800 calories, could be considered insufficient for the needs of adults working in heavy forms of manual labour, such as rural poor people engaged in agriculture (who dominate measures of poverty), or women involved in extensive domestic work, or even the urban poor, who are generally engaged in manual labour (e.g., porters, street vendors, rickshaw drivers, domestic labourers, etc.). In particular, poor people typically work harder and longer than wealthy people in poor countries, given that poverty is not typically associated with unemployment but rather with poorly valued albeit often quite intense forms of manual labour. For instance, Sathyamala (2016, p. 118) notes that, around the same time that the Tendulkar Committee in India utilised the FAO’s revised calorie norm of 1770 per person per day in its calculations in 2009, for no reason other than that it was closer to the actually observed intake of 1776 calories, the Indian Council of Medical Research recommended in 2010, based on studies of Indian populations, 2560 calories for a male of 55kg engaged in moderately heavy work and 2050 calories for a 50kg female engaged in the same (Indian Council of Medical Research 2010, p. 50). Meanwhile, the National Institute of Nutrition in India recommended 2730 calories for a 60kg man engaged in moderate work, and 3490 calories for the same man engaged in heavy work. The standardisation of the lower norms therefore already represents the institutionalisation of certain normative choices about what should constitute poverty, ultra-poverty or extreme poverty, by relegating them to the space of hunger and starvation.
The question, then, is whether one should be considered poor if one’s consumption (or ability to consume based on income) falls below the recommended optimal norm, or whether the poverty line should be set at a level that is much lower than the recommended norm, and by how much and for which people. As noted above, the argument that food poverty lines should be set lower that the optimal norm is often driven by budgetary resource constraints, issues of triage in emergency situations or even Victorian-type conservative arguments against any overly generous allowances for poor people, lest this creates dependency and lessens their will to work. The argument that bodies adapt to lower calories and that Indian bodies, for instance, are smaller and more efficient (e.g., Sukhatme and Margen 1978, 1982; see Sathyamala 2016 for a critique) is also problematic because some bodies are able to adapt while others are not. More direct testing would be required to differentiate between the two, although of course we need to ask the prior question of why we should expect such poor people to adapt, especially in the knowledge that adaptation to lower calories is associated with higher morbidity and lower longevity.
Again, the arbitrariness of choice quickly becomes political and moral in terms of the standards that are applied to the poor. Indeed, as analysed by Sathyamala (2016), contestations over nutritional norms and requirements can be traced back to the mid-nineteenth century in relation to the practice of the setting of different, inferior standards for the working classes and the poor. The fact that current standards are essentially only applied to poor people in developing countries, through the deliberation of non-poor professionals, suggests that the same biases persist today, including across classes within these countries.
The choice of calorie threshold is just the starting point in food poverty measures. Subsequent steps involve decisions about what should be included in the food basket in order to constitute the required calories, and then how to price such a basket, with prices that are relevant for the poor. In terms of the basket, the standard approach is to use local consumption patterns at local prices, although this itself involves a huge latitude of subjective choice about what patterns and what prices. In particular, if the understanding of such patterns is derived from studies of the consumption of the poor or near-poor, these might themselves already represent deficient or repressed consumption.
An important factor concerns the balance between cheaper and more expensive foods. Should the diet be balanced, including vegetables and other more expensive calories, or should it be largely made up of the cheapest calories, such as grains? To give an example, the absolute rural poverty line in China in the late 1990s was based on a diet that was 90-per cent grain (Hussain 2002). A large part of the revision to the line since then (e.g., from 865 to 2300 yuan) has not been based on cost-of-living increases (which account for a fraction of the revision) but on more realistic evaluations of appropriate diets that include other, more expensive calories, even while maintaining the 2100-calorie standard.
Another fundamental question in such calculations is whether diets should be based on what people want to eat, or what is made available to them through subsidised provisioning systems – or even whether subsidised provisioning systems should provide better quality foods, for that matter, or what quality of food would remain accessible to the poor if such systems were eliminated. Any variety of foods can be compiled to make up 2100 calories, from very poor quality foods that anyone in their right mind would avoid if given the choice, to varied diets of good-quality foods aimed at attracting people to enhance their nutritional intake. Similarly, as noted by Saith (2005), should allowances be made for discretionary foods, such as sweets, alcohol or even cigarettes? And of course, who should be making these choices?
The common approach, as expressed, for instance, by Ravallion (1992), is to calculate for enough money to afford a relatively balanced diet and then to leave it to the poor to spend it wisely. If they do not, then it is their fault for having made the wrong choices. The same thinking was reflected in the early work by Seebohm Rowntree (1901), who defined poverty in terms of primary and secondary poverty, the first representing a lack of income for basic necessities and the second representing situations where income was sufficient but not actual consumption because some of the money was being spent on other things, some justified and others not, such as ‘wasteful’ spending on alcohol. This view represents a mix of liberal and Victorian mindsets that were typical in thinking about poverty in the nineteenth century. It finds a contemporary re-expression in the behavioural work of Banerjee and Duflo (2011), for instance, who also emphasise how poor people often make consumption choices that do not seem aligned with how we might think poor people should be making good choices (such as buying a TV). Notably, this is a vision that reduces ‘good’ consumption to its purely utilitarian value of supporting workers to maintain their most basic functions.
The next step is in the pricing of food. Ideally, these should be the prices faced by the poor, but as noted above, for what food? What if prices are used for food we think the poor should eat, even though they eat other food? The standard approach is to use consumption surveys of the poor or near-poor and to base consumption profiles and prices on this information, but again there is the question of whether such surveys are able to acquire the appropriate information, or whether the information acquired reflects repressed consumption. Such surveys might hide prices that the poor are occasionally forced to face, particularly in the case of repressed consumption, or situations where the poor might face exploitation in pricing, which surveyors might have difficulty in detecting.
Regional price differences can also wreak havoc on the accuracy of estimates, particularly if national lines are used for evaluation purposes (such as with PPP poverty lines). A single national line carries the bias that poverty tends to be overestimated in cheaper rural locations and underestimated in more expensive locations, such as in large cities. An excellent example of this can found in the work of Hussain (2003) on urban poverty in China. Up to the time of his work, the conventional wisdom based on national poverty lines was that poverty rates were higher in the western China and lower in eastern China. For instance, Khan and Riskin (2001, p. 67) concluded from their regression analysis on a large national survey in 1995 that ‘the incidence of broad poverty is, by and large, lower for the provinces with higher per capita income. Spearman’s rank correlation coefficient between the provincial rank in head count rural poverty and the provincial rank in per capita rural income is highly significant at –0.69.’ Hussain (2003) demonstrates that the correlation – at least with respect to urban poverty – is to a large extent an artefact of differences in price levels, not poverty rates. With access to urban income and price data of sufficient disaggregation for 1998, he was able to construct an urban ‘absolute’ poverty line for each province individually. On the basis of this, he found that urban poverty rates in the southwest were in fact lower than the national average, very close to those of the southeast, and considerably lower than those of the north and northeast (Hussain 2003, p. 18). He was not able to conduct the same revision for rural areas because of lack of disaggregated price data but, based on experience in rural China, it is clear that a similar corrective would have applied.
Such a radical revision of the received wisdom reinforces the point that poverty rates measured by a single national line are not comparable across provinces or regions with different price levels, even though they might reflect at least some notion of poverty within each province or region, as measured by an arbitrary line. However, for purposes of evaluation, even an arbitrary line should be indexed to local inflation rates rather than national inflation rates, given that the latter again introduces a bias over time. These are fundamental problems with poverty mapping using national lines, especially between rural and urban areas, given that such maps reveal as much price differences as poverty differences across regions. Many national poverty measurement systems do use regional lines, or differentiate between rural and urban areas, such as in India, where each state sets its own line, in addition to the national line that is used for evaluation and budgetary allocations from the centre to the states. However, again, such systems are usually tied to the allocation of benefits in the population and for determining eligibility for poverty relief, and hence political-administrative and budgetary issues usually overwhelm any of the more social-scientific concerns of poverty measurement.
Beyond the determination of the food poverty line, even greater methodological problems and arbitrariness enter with the determination of non-food basic needs, such as fuel, housing, clothing, transport, etc. While food arguably has at least some underlying scientific basis to guide the debate, the determination of non-food items is far more arbitrary. As described by Saith (2005), there are a variety of methods, such as: simply adding 50 per cent extra to the food poverty line; using Engels curves to determine a more precise proportion; or observing the non-food consumption of those whose food expenditure or even total income is on the food line, with the assumption that if something is an absolute non-food basic need, then those people will forego food in order to consume it (such as fuel to cook food). Again, in all these methods, we are not even asking the equivalent of the food question, which is what should non-food needs be and whether they are being met. The risk again is that we are simply basing our poverty lines on compounded measures of repressed consumption.
As a last step to poverty measurement, the line is combined with the survey data to compute a measure of poverty. Much of the focus in the poverty studies literature is on these measures, such as the straightforward headcount ratio, the Foster-Greer-Thorbecke Index for depth and severity of poverty, or the competing Sen poverty index (e.g., see Shorrocks 1995) and so on. The increasing complexity of these measures – to capture issues such as depth of poverty or inequality among the poor – often come, however, with a loss of tangible meaning. Moreover, while the technicality of these various measures receives much of the attention in scholarship, this is the stage that is actually most removed from the political and moral choices involved in poverty measurement, given that the arbitrariness of choice primarily enters through previous stages of determining the line. This allows statisticians and technocratic practitioners to feel that they are removed from such politics, particularly if they are simply using national survey data and poverty lines rather than collecting and calculating these themselves, as noted above with respect to the World Bank’s position in its ‘Monitoring Global Poverty’ report for 2016 (WB 2017b). However, through the process, they place formal technocratic legitimacy onto processes that, in their essence, are fundamentally political. This puts the relevance of these measurement issues in perspective, especially the very precise ones, which run the danger of methodological fetishism over the creation of useful and reliable analysis.
Sensitivity and evaluation over time
To wrap up, even the most restrictive form of basic-needs poverty line is arbitrary, given that it is unable to provide any reliable indication of whether basic needs are being met. Depending on the range of assumptions that are made at a variety of different points in determining the poverty line, a large range of poverty rates can be estimated on the same data. The quandary is all the more problematic given that the incomes of populations in poor countries tend to be densely clustered around a typical poverty line, resulting in an extreme sensitivity of poverty estimates to small adjustments to the line, whether or not these are accurate.
Examples are replete in the scholarship. Székely et al. (2000) applied sensitivity analysis to household survey data from 17 Latin American countries in the 1990s. By varying the poverty line parameters within ‘reasonable boundaries’,10 they estimated poverty rates as lying anywhere from 12.7 per cent to 65.8 per cent of the total population. The ranking of countries with respect to poverty rates was also highly sensitive to their exercise. Hussain (2003) demonstrates a similar point with respect to urban poverty in China in terms of both sensitivity and rank orderings across Chinese provinces. Helwege and Birch (2007, p. 6) note that, ironically, ‘the institutions that generate poverty data are well aware of how methodological choices affect poverty estimates. They simply have not established standardized approaches to measuring poverty.’ Hence, in their assessment of alternative poverty estimates from the World Bank and the United Nations for Latin America, Helwege and Birch advise caution in interpreting trends from any of these data.
Practitioners of poverty measurement have acknowledged these pitfalls for decades. Indeed, in the opening pages of his seminal text Poverty Comparisons, Ravallion (1992, p. 2–3) admits that poverty lines are arbitrary. He argues, however, that even arbitrarily chosen lines nonetheless allow for comparison and evaluation so long as they are accurately adjusted over time. The importance is in the evaluation, he maintains, not the precise poverty rate.
However, the possibility of adjusting poverty lines over time merely compounds these problems of poverty measurement. It does not absolve these measures of their original methodological precarity. In particular, the question of adjustment over time leads to the classic quandary of whether poverty trends reflect actual changes in poverty or else errors of adjustment to the poverty line or other elements of the calculus. This is particularly important in most poor countries where populations are generally clustered around the line, such that small changes in the line produce large changes in the poverty head count. Trends can also vary depending on the level of the line.
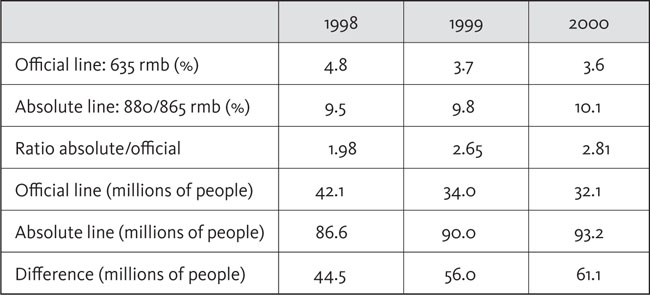
A good example of this can be drawn from rural poverty estimates in China in the late 1990s, as already discussed above. As shown in Table 4.1, rural poverty was decreasing in China from 1998 to 2000 according to the unreasonably low official (‘benefit’) poverty line of 635 yuan per person per year (i.e., the one usually cited in World Bank publications in the early 2000s), but it was rising according to the more credible absolute poverty line calculated by the China National Bureau of Statistics. The latter line was based on the estimated average minimum annual income required per person for the food and non-food items deemed essential to be able to subsist at approximately 2100 calories a day, at local prices and with local consumption patterns. The National Bureau of Statistics in China estimated this line to be 880 yuan per person in 1997 and 1998, and 865 yuan in 1999 to 2001, the adjustment reflecting deflation at the time.11 As noted above, many in China argued that even this line was far too low, including Premier Wen Jiabao in 2003.
Table 3.1 National rural poverty rates in China measured by different lines
Source: Hussain (2002, p. 6), cited in Fischer (2005, pp. 96–99).
The difference between the two main national lines – 230/245 yuan per person per year (about 25 USD at the time) – was extremely significant due to the clustering of the rural population around and between the two lines. As shown in Table 3.1, the absolute line, which was about one-third higher than the benefit line, doubled the national poverty headcount in 1998 and almost tripled it in 2000. This sensitivity is the result of clustering, such that small changes in the line produce large changes in the poverty headcount. As a result, different poverty rate trends can be observed at each line,12 reflecting the degree to which the effects of rising inequality, for instance, were differentiated among various income strata within the poorest decile or quintile of the population. Over these years, during which China was growing rapidly at 6 to 9 per cent a year in real terms despite the East Asian crisis, the most extreme forms of poverty appeared to have fallen to a very small share (or else the official line had depreciated over the 1990s to an irrelevantly low level due to insufficient indexing). However, rates of absolute poverty were apparently on the rise, at least for a short time (the incongruence appears to have been ironed out as the economy started to surge from the early 2000s onwards). This case might be taken as one of the outliers in the matrices of Dollar and Kraay (2002) in their argument that growth is good for the poor. Given the size of the population involved, it is an important outlier.
Similar issues have led to fierce debates in India, the other country driving most of the commonly cited global poverty reduction since the 1980s (see Himanshu and Sen (2014) for a recent review of these debates). Based on their efforts to correct inconsistencies in Indian survey data from 1999–2000, Himanshu and Sen (2004) concluded that there had been little poverty reduction in India in the 1990s, contrary to the dominant consensus. Deaton and Kozel (2005, p. 117) contended that such claims are ‘frankly political’ and that there is good evidence that poverty fell. However, further findings presented by Himanshu (2007), based on new data from 2004–2005, confirmed his earlier results that most poverty reduction since the early 1990s was concentrated in the period from 1999 to 2005. While these findings continue to be met with a barrage of dismissal, they were broadly supported by the Tendulkar Committee, the expert group of the Planning Commission of the Government of India (GOI) that was set up to review these matters (GOI 2009; also see Himanshu 2010). They also corroborate much more coherently with the findings of other studies that calorie deprivation had actually increased in India in the 1990s (e.g., see Meenakshi and Vishwanathan 2003).13
While some might argue that the latter incongruence is due to consumer sovereignty (i.e., poor people choosing to spend their extra income on bidis rather than chapattis), the more plausible explanation is that some of the poverty calculations are quite simply inaccurate or that poverty lines are set too low and not sufficiently adjusted over time. The fact that measures of hunger and malnutrition remain stubbornly high in India (see the evidence reviewed by Sathyamala 2016), suggests that this continues to be the case up to the present. Indeed, similar incongruences of slow progress in hunger and malnutrition despite decent poverty reduction are observed in other countries (e.g., Ecuador) and globally (e.g., see FAO 2017 and WHO 2013). In addition, there have been increasing observations of widespread food insecurity in rich countries such as the US, among families that would technically be well above an ‘absolute’ poverty threshold in the way it is calculated for poor countries. These incongruences suggest that something has gone awry with our conventional practices of measuring absolute poverty.
Our ability to track poverty trends over time is critically based on our presumption that we can accurately measure all of the changing cost factors faced by poor households together with their changing patterns of livelihood and consumption. This is especially challenging in contexts of the often-rapid socio-economic structural changes associated with development, such as migration, urbanisation, monetisation, commoditisation or an increased reliance on wage labour. Notably, the World Bank revised its estimates for global PPP poverty rates upwards in 2008, including an upward adjustment of about 40 per cent for China. This was based on new and improved cost of living data from 2005, which revealed a substantially higher cost of living in developing countries than was previously estimated from older data.
However, Chen and Ravallion (2008) optimistically stressed that, although poorer than previously thought, the world was just as successful in poverty reduction at the revised estimates, which simply moved the rates upwards but not the trends. They nonetheless reached this conclusion simply by deflating the new PPP poverty lines by the official consumer price indices (CPI) of each country back to 1981 (ibid., pp. 14–15). In other words, the fact that the resultant trends were the same as before is in part an artefact of their assumption that the source of error was the same in 1981 as it was 2005, i.e., that the changing cost structures and levels faced by the poor are represented by the overall CPI indices of each country. The other possibility that they sidestep is that the poor might have faced higher price inflation than that represented by the CPI, or that the older cost data might have been accurate for the earlier period and that cost levels did in fact increase accordingly.14 That the poor might have faced greater cost-of-living increases than suggested by the general consumer prices indices is quite possible given the notable increases in inequality in many countries over the same period.15 Thus, while Chen and Ravallion provided a politically convenient narrative, many intractable problems remained lost in past surveys. Similar problems plagued the revisions in 2015, based on new 2011 data, as discussed above.
Secular underestimations of absolute poverty
Several structural and institutional processes are arguably at the root of these incongruences of monotonically decreasing rates of absolute poverty across the world versus ongoing manifestations of distress and deprivations among the same poor populations. These processes have arguably resulted in a chronic secular (i.e., long-term) underestimation of money-metric poverty overtime over the course of the postwar period, or, more precisely, an overestimation of its reduction over time. There are at least three fundamental reasons for this. The first is more proximate and institutional, regarding the commodification of various services and/or the proliferation of private previsioning in social services over the course of the last 30 to 40 years, in what is often referred to as the neoliberal period (as discussed in the Introduction). The second and third are more structural, with reference to transitions away from ‘subsistence’-based agrarian systems, and food and nutrition transitions.
The bias against universalistic social provisioning
With regard to the first institutional process of commodification and privatisation, the fundamental Achilles Heel of money-metric approaches to poverty measurement is that education and health costs are mostly not included in the calculation of poverty lines. Laderchi et al. (2003, p. 249) imply this problem by referring to an implicit bias in these approaches in favour of private income as against public goods provision given that they invariably include only private resources and omit social income, such as goods and services provided publicly (school, clinics, etc.). However, the problem is more specific than this.
The exclusion of health and education costs from money-metric poverty lines is for technical reasons, given that they constitute large and highly irregular expenditure items across households and across time. Hence, short of calculating individualised poverty lines for each household surveyed in each period, which is practically close to impossible in the absence of a functional and enforced government income-reporting system (as is the case in practically all developing countries), these costs are generally ignored with the assumption that they are randomly distributed across households and are generally proportionate across periods. Accordingly, they would not undermine the representativeness of the resultant poverty measures and trends. Notably, this solution does not address the issue of poverty targeting for actual social provisioning. It is only concerned with the social-scientific goal of performing accurate representative evaluations.
However, even with respect to representative surveying, the problem remains that education and health costs are included in the expenditures of surveyed households. This renders the comparison of poverty rates very difficult across households, let alone across regions with different provisioning systems or else across time when the costing and/or supply of education or health care changes. Increasing costs of education or health care, or else increasing school enrolments in schools that charge fees, would be invisible to most conventional poverty lines even though they effectively raise the poverty line for a large proportion of households. To the extent that large health costs are financed by incurring debt, they might even be reflected as increasing expenditures and falling expenditure poverty. These implications lead to an important source of underestimation of money-metric poverty rate trends in such contexts. This weakness is recognised in some of the literature, but it is also generally sidestepped in the same literature (e.g., see Ravallion, 1992, pp. 12, 28), for the simple reason that accounting for these factors – which is possible in theory – would render surveying unwieldy and extremely expensive in practice, and would also introduce ever more arbitrary assumptions and potential for measurement errors.
The innovative work by van Doorslaer et al. (2005) is one exception in this regard. Merely by deducting catastrophic out-of-pocket payments for health care from the expenditures of households surveyed in 11 low- and middle-income countries in Asia (most surveys taken around 2000), they show that poverty rates across Asia increased from 19.3 per cent to 22 per cent, or an increase of 14 per cent or 78 million people. The biggest increases were in Vietnam, where poverty rates increased by one-third, China (by 19 per cent), Bangladesh (by 17 per cent) and India (by 12 per cent). However, this does not take into account the repressed expenditure of poor people who would have otherwise spent more on necessary health care were it not for lack of resources, which is a major problem that the authors consider but cannot measure.16
As insightful as this work is, it is nonetheless based on insights from single surveys taken at particular points in time. The results offer no indication on how these considerations might alter our perception of trends over time, particularly in cases where education and health care costs have increased substantially. For example, falling income poverty rates in China since the early 1980s do not factor into consideration the parallel shift from very cheap to very expensive health care or post-primary education. More specifically, while the general consumer price index in China remained more or less unchanged between 1997 and 2003, prices for tuition and child care more than doubled over the same period, and prices for health care services almost doubled (see Figure 3.1).
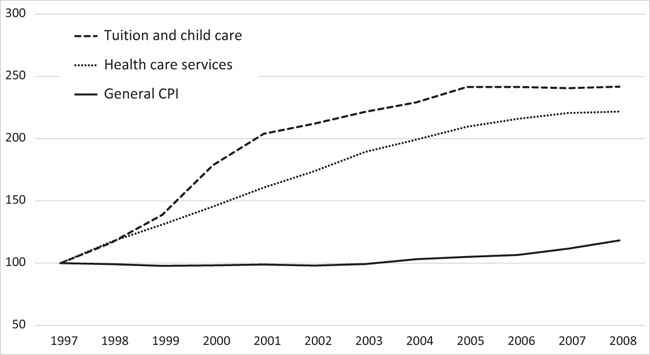
FIGURE 3.1 Selected prices indices for China, 1997–2008 (1997=100)
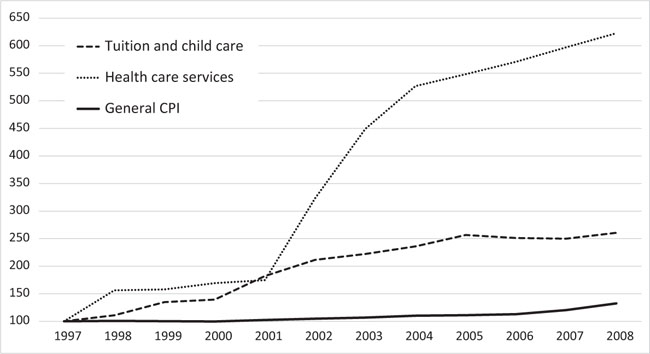
FIGURE 3.2 Selected prices indices for Qinghai Province, 1997–2008 (1997=100)
Tuition and health care services were especially inflationary in some of the poorest western provinces (see Figures 3.2 to 3.4). In Qinghai, where prices for health care services increased by more than six times by 2008. In Xinjiang, they increased by more than four times by 2005. Both price categories almost doubled by 2003 in Gansu, the second-poorest province in China in terms of per-capita GDP. In these three western provincial cases, much of the divergence took place around 2000, reflecting a form of shock therapy with respect to the pricing of these social services under what was otherwise a reorientation of regional development policy towards this region. The sharp increases in tuition would have been particularly onerous for poor households given simultaneous efforts by the government to increase enrolment rates (see Fischer 2009a, 2014a; Fischer and Zenz 2018). By ignoring such dramatically changing price structures (as do Chen and Ravallion 2008), we cannot know to what degree the appearance of falling poverty rates merely represents increasing relative prices for these essential services that are not included in the poverty line.
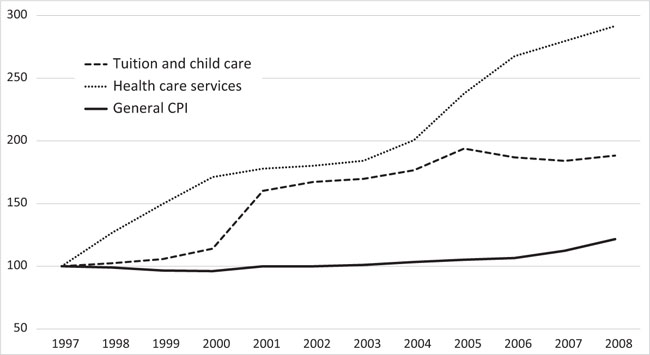
FIGURE 3.3 Selected prices indices for Gansu Province, 1997–2008 (1997=100)
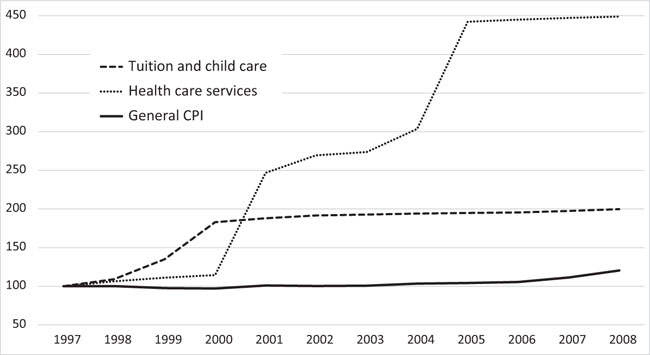
FIGURE 3.4 Selected prices indices for Xinjiang, 1997–2008 (1997=100)
Source for all figures: Fischer (2005, p. 48), based on data compiled from various China Statistical Yearbooks.
It is in this sense that absolute money-metric poverty measures can be said to be biased against universalistic modes of social policy. A movement towards free education or health care financed through progressive taxation would not necessarily appear as decreasing poverty even though it would lower the effective poverty line for households previously paying fees. Similarly, it is difficult to calibrate poverty rates in any meaningful way across countries with very different provisioning systems, such as between Cuba, with its free health care and education, and Vietnam, which had the greatest reliance on out-of-pocket payments among the Asian cases studied by van Doorslaer et al. (2005). Indeed, a significant proportion of the appearance of falling poverty in the latter case or in China might actually signify the commodification of previously socialised health care and education.
The general trend across most countries since the early 1980s has been in the direction of commodification, increasing private provisioning, cost recovery and so forth. In many cases these changes have been impelled quite dramatically by the austerity imposed on government finances by recurrent financial crises. It is in this sense that these institutional changes would have in principle led to an increasing underestimation of poverty rates over these decades. The precise empirical effects are difficult to evaluate outside of specific contexts and cases, although the logic of this implication is quite clear given the way that poverty lines are constructed. Indeed, it is ironic that the poverty impact of quite marginal programmes such as cash transfers have been so widely and enthusiastically researched, with the endorsement and financing of major donors and international organisations, whereas these more systemic issues that are much more significant to poverty dynamics as well as to the dynamics of social integration and stratification have been largely neglected. That they are far more difficult to fit into convincing econometric techniques of analysis is a poor excuse for the neglect.
The erosion of subsistence capacity
The second two processes are more structural in nature and less specifically associated to the neoliberal era, even though they have been exacerbated by it. The first is related to the gradual transition of rural populations out of situations that might be described as subsistence-based over the course of the last century, as briefly discussed in the first chapter. Standard measures of income, consumption and poverty under-evaluate the implicit value of what I have called ‘subsistence capacity’ (Fischer 2006, 2008b, 2014a). Hence, they exaggerate the significance of an increase in explicit monetary incomes as rural livelihoods become increasingly commodified.
In deference to Polly Hill (1986), this term ‘subsistence’ needs to be used with caution. In her frontal critique of the conventional wisdom in much of development economics, she pointed out that the standard derogatory association of subsistence with poverty or traditional pre-market economic systems may actually be the inverse to how subsistence is subjectively experienced by rural communities (see pp. 18–20). Moreover, she argued that such associations ignore inequality in rural communities given that, within such communities, it is usually only rich households that can hope for attaining a degree of self-sufficiency and it is precisely these households that also enjoy the most lucrative non-farming occupations. On this basis, she criticises the common assumption that traditional agriculture is characterised by degrees of subsistence, which are inversely related to market integration.
Keeping these points in mind, subsistence can nonetheless be characterised in terms of households or communities that consume much of their own output and then trade the rest, if and when some is left over. This differs from commercial farming, in which farmers sell most of what they produce and derive most of their consumption through similarly purchasing commodities from others. The latter can be characterised as a commoditised form of production, exchange and consumption.17
Accordingly, ‘subsistence capacity’ can be conceived as an ability to subsist on one’s own production. Absolute subsistence capacity refers to the ability of a household to produce a surplus above the subsistence needs required to reproduce itself economically. At the most basic level, this can be understood in terms of food. This meaning is essentially synonymous with food security at a household, family or community level and, in this sense, also complies with Hill’s contention.18
As I have argued in Fischer (2006, 2008b, 2014a) based on my fieldwork in western China, maintaining an asset base at a level sufficient to meet absolute subsistence capacity allows people to maintain autonomy from labour market dependence (or labour commodification). This in turn represents a fundamental source of economic opportunity given that it provides an ability to act strategically, primarily by avoiding dependence on subordinated forms of employment and/or by being able to wait for more lucrative or strategic opportunities, such as with respect to selling surplus production when prices are higher rather than lower. Hence, rural dwellers naturally seek autonomy from such dependence. One way is to re-embed themselves in an asset base, such as by investing in land and livestock, as a means to buffer themselves against the potential disadvantages of labour commodification in the short term, even though social and economic structural changes might simultaneously undermine the sustainability of these subsistence-based livelihood strategies in the medium to long term.
Subsistence in this sense serves both instrumental as well as symbolic (or cultural) wealth functions within rural communities. Contrary to arguments that such valuation of subsistence is only a characteristic of those living close to destitution, this idea that subsistence is an instrument for wealth is comparable to the way that monetary wealth provides freedom within a fully commoditised non-rural setting. Few would contest that the rich can do what they like with their disposable wealth regardless of whether their actions are deemed rational or otherwise; this is the privilege of wealth. Similarly, the ability to be unemployed in most poor countries is actually an attribute of middle- or upper-class status; the truly poor have no capacity to be unemployed. They must work, whatever the work, and whatever the remuneration. Indeed, even the ability to survive an unpaid internship, as is one of the pathways into eventually getting paid work in the UN system, in many NGOs, and increasingly in the private sector, generally depends on having some reserve of wealth, which thereby becomes a class- and/or wealth-based screening mechanism within such forms of employment. In other words, this suggests a more generalised experience of ‘subsistence’ as wealth. This understanding of what it means to attain subsistence (and thus, in principle, to be a ‘subsistence farmer’) may not accord to the ways that non-rural academics or policy-makers expect ‘disciplined’ or ‘deserving’ poor people to behave, but this is more likely due to a misreading of the clues rather than any developmental deficiency on the part of rural-dwellers.
Along similar lines, an extension of the ‘commodity’ or cash economy is not necessarily antithetical to these subsistence strategies. Contemporary rural-dwellers across developing countries are invariably involved with the commodity cash economy in various ways, some due to choice and others necessity, and thus they cannot base their livelihoods solely on subsistence household production, if ever they did, as noted by Hill (1986). This is partly because they purchase, consume or invest in modern goods, be they mobile phones, motorcycles or fertilizers, among many others. Perhaps more importantly, rapidly increasing fees for education and health care in many contexts also act as strong compelling forces for rural-dwellers to move into cash-earning activities, particularly in light of livelihood strategies that target post-primary schooling for at least one child. Scarcity of rural cash-earning opportunities in turn drives rural-to-urban migration.
However, the cash imperative is often overemphasized as a driver of labour commodification, given that it can easily co-exist with subsistence-based livelihood strategies. In fact, the combination can be ideal. If subsistence capacity is sufficient, it offers a choice as to how and when to engage in cash-earning activities and these in turn can be used to bolster subsistence capacity. It offers autonomy from a dependence on regular low-wage employment, or from the forced selling of produce at inopportune moments, both of which can have impoverishing implications. The ability to wait thereby confers an ability to access better opportunities if and when they arise.
In this sense, the subjective proclivity for subsistence within rural communities is not merely cultural or symbolic. It also carries important instrumental wealth functions, not only in terms of the risk-averse insurance principle as argued by authors such as James Scott (1976), but also in terms of providing a position from which market and other forms of economic opportunity can be engaged advantageously. In other words, reinforcing subsistence capacity can serve as an important wealth-supporting strategy within rural transitions into more marketized forms of production, exchange and employment.
The problem, however, is that standard measures of income or consumption are poorly adapted to reflect such wealth-supporting functions, in the sense that a dollar of subsistence production and consumption is valued the same as any other dollar earned and spent. Hence, transition away from subsistence forms of production, such as when subsistence capacity becomes eroded and households are increasingly forced into labour market dependence, remains mostly invisible to household income or expenditure surveys, even though it can have a massive effect on the subjective and objective wellbeing of people undergoing such transitions.
I detected this in my own research in the Tibetan areas of western China through the observation that, although rural Tibetans were among the poorest in rural China in terms of incomes and consumption, they were among the richest in terms of asset ownership. The incongruence is partly due to the fact that rural household surveys are designed with farming communities in mind and are poorly adapted to pastoralist communities. More precisely, pastoral savings (i.e., an increase in herd size) are recorded as increases in productive fixed assets and are thereby not reflected in the data on pastoral household incomes, whereas savings of grain output are calculated as part of farming household incomes. However, it is also a reflection of relatively strong subsistence capacity, which is not mirrored in the income or consumption data but definitely in the wage expectations common among such Tibetans, as well as in their non-wage expectations regarding such things as daily hours of work, discipline, intensity of work, or tolerance of absenteeism. According to my observations, these tended to be higher than those of Chinese migrants coming from otherwise more affluent regions (in rural income or consumption terms).
Moreover, in certain cases there might even be an inverse relationship between income and assets. A remote pastoral household might appear poor in terms of income (and in terms of education and health) yet possess substantial livestock assets, enough to offer considerable subsistence consumption and even bouts of conspicuous consumption. In contrast, a pastoral household located closer to a populated area might have much more circulating income, due to its integration into the ‘commodity economy’, even while its asset base is depleted due to shortage of quality pastures or stronger state enforcement of livestock limits. Asset depletion might even be reflected as increasing income for short periods of time, such as when a herder is hard-pressed for cash in one year and sells off a larger part of their herd than they normally would. In these cases, an increase in income wealth may in fact represent considerable subsistence impoverishment.
All of these considerations suggest that there is considerable wealth generated and stored in subsistence-based rural economies that is often poorly captured by conventional household income and expenditure surveys, and that people living within such economies may be considerably wealthier than the income or expenditure data suggest. Moreover, these conventional measures may be poorly conceived for capturing the wealth dimensions of transition from more subsistence to more monetised or commoditised livelihoods. Smooth monotonic increases in income may not necessarily reflect actual changes in overall wealth and might hide the erosion of asset-based subsistence through population and economic pressures, or through government policies that undermine this asset base, such as resettlement or land reforestation programmes, or the imposition of livestock limits.
The decline in food relative to other needs
The second structural process that arguably leads to a secular overestimation of absolute poverty reduction is related to food or nutritional transitions, from insecure and perhaps austere, but more diverse, higher-quality and nutritionally rich foods, to ample supplies of cheap and highly processed, calorie-rich but nutritionally deficient foods. The best examples of the latter include sugars and oils, which used to be relatively luxurious items in the pre-industrial past but have now become so cheap that they have become part of the staple of the diets of even poor people. Indeed, this helps to explain the rise of obesity among the relatively poor in middle-income countries (e.g., see Kobiyama 2013).
However, because poverty lines are focused on crude calories and on actual consumption patterns among the poor, they overlook these shifts in the quality of diet. Over time, this effectively amounts to comparing goods of different quality in the basket of the poverty line. The shift towards an increasing cheapness of calories therefore has an effect of reducing the poverty line to a declining lowest common denominator.
The falling terms of trade of such calories in particular means that calorie-based poverty lines are anchored on a foundation that is being compressed over time relative to other expenditures and consumption needs, especially in the context of urbanisation whereby the latter become more prominent.19 This thereby introduces a further subtle but powerful source of underestimation in measures of ‘absolute’ near-starvation deprivation over time. In other words, productivity in the contemporary production of food, for instance, has increased to such an extent over the last century that substantial surpluses have been achieved even in the face of rising population. As a result, real food prices – or the terms of trade of food relative to other goods – are at close to an all-time low in historical terms, even despite the recent spike in food prices. For instance, Fuglie and Wang (2013) estimate that, on average, real food prices have fallen by 1 per cent a year between 1900 and 2010. Given rising productivity and the mass processing of cheap (and cheap-quality) foods, combined with increasingly integrated international markets, it is understandable how the condition of poverty has gradually changed over the last century from one of food scarcity and starvation to one in which calorie sufficiency is relatively easier to secure (although not necessarily nutrition sufficiency), while other compelling social needs take over in precedence, as discussed in the previous chapter.
Insofar as absolute poverty is restrictively designed to measure a minimal ability to procure food (not necessarily an ability or decision to procure food in light of other social needs or desires), it is understandable that this transformation in the condition of modern poverty would introduce a gradual underestimation of such poverty lines over time. Insofar as the ratio of food to non-food needs is not substantially revised to reflect the changing balance of relative costs, at least part of the long-term secular decline in such poverty rates would be reflective of this underestimation.
This rather extensive chapter provided an overview of money-metric approaches to measuring poverty, which are considered the most precise and restrictive, and serve as the cornerstone of various development goals by most international organisations. The aim was to demonstrate how even these approaches are inherently arbitrary, to the extent that they are unable to provide any reliable indication of whether basic needs are being met and how this might be changing over time. This is before consideration of all of the problems associated with international poverty comparisons, with reference to the ever-altering, one-dollar-or-whatever-a-day purchasing-power-parity poverty lines of the World Bank. Even if we accept the arbitrariness of a line but then adopt this as a means of evaluation, this merely kicks the problem forward into the classic quandary of whether poverty trends over time reflect actual changes or else errors of adjustment and even of conception.
This intrinsic arbitrariness is ideological given the fundamentally normative and political character of the wide range of choices that are involved in producing data sets, and in setting lines and adjusting them over time. The fact that they are so arbitrary also renders them prone to political manipulations in application. The evaluative emphasis of these approaches essentially sidesteps the problem that, once applied to the social and political economy realities of policy-making and actual distributions of benefits and poverty relief, the problems of these poverty measures become compounded by social and power relations. Indeed, in this respect, official poverty lines need to be understood first and foremost as the outcome of complex processes of political contestation and the balance of power between various contending power factions that find an interest in weighing in on these measures.
Money-metric poverty measures nonetheless remain attractive because they yield exact, seemingly objective and scientific statistics, in a technical manner that can be compared and analysed with an ever-expanding battery of increasingly sophisticated statistical techniques. Yet, we must ask what we are buying into when we adopt these approaches. At the very least, we must engage in them with awareness of their fundamentally ideological and political nature, as well as with transparency, honesty and humility as to their limitations.
This is all the more important because these measures do remain as one valuable means to aggregate within one important dimension of poverty, among a range of other imperfect options, and aggregation is also a problem with other approaches. They do have biases and it is essential to understand these biases in order to compensate for them, but they reveal very important information, even though they do not reveal all of the information that is relevant to understand poverty, nor were they necessarily conceived to do so. The danger of diluting this information with attempts to add in different dimensions and elements intended to better reflect wellbeing or other objectives is that this original information then becomes obscured or even lost. Indeed, this obscurity might even advantage powerful economic interests and, despite the progressive intentions, dilute our ability to understand and contest certain core aspects of power and wealth in modern economies as they manifest for poor people.
In the third section of this chapter, an elaboration was given on how the standard absolute money-metric poverty measures are arguably prone to a secular tendency to gradually underestimate absolute poverty over time in the context of structural and institutional changes associated with development and in particular during the recent neoliberal phase of change. One fundamental source of bias is based on declining terms of trade for food, which gives greater relative prominence to non-food essential needs over time. The second is in terms of the shift from self-provisioning to commoditised consumption, which in many respects overestimates the value of the latter relative to the functional value of previous subsistence modes of livelihood. The last is more proximate to the neoliberal era of commoditised social provisioning, in particular the substantial commoditisation and privatisation of health and education. A fundamental problem with money-metric measures of poverty is that they are biased by design against universalistic and decommoditised forms of social provisioning, such that a move towards greater commoditisation can actually be reflected as an improvement in poverty, all else held constant.
Indeed, in the face of global productive capacity, if anything it is surprising that so much of the world’s population still subsists under or just above such minimally defined food-based poverty lines. Part of this is undoubtedly related to agrarian conditions in much of the Global South, where peasant farmers struggle to get by on the low food prices received for their output on shrinking per-person plots of land (if they produce a surplus), relative to rising prices in the range of other social needs (such as in health care and schooling, or else in inputs to production). However, much is not agrarian, particularly as poor people increasingly move out of such conditions, albeit bringing their poverty with them. Rather, as discussed in Chapter 6, much of it is related to the valuing of labour more generally, even as it is integrated into value chains that generate enormous value for those who control them. In this sense, workers integrated within such chains are still living under the predicament posited by classical economists such as Malthus, Ricardo and Marx, who assumed that workers’ wages would always be squeezed down to a level of subsistence, that is, subsistence minimally defined by the price of food. Because absolute poverty lines continue to be established by the price of food, such tendencies could ironically be reflected as declining poverty rates correspondent to declining real prices for food.
This brings us back to the crucial question of social needs and how these are calculated by absolute lines. The mission is not impossible, but it is one that requires much more nuance and context specificity, as well as a much greater broadening of the scope of what we should include in the basket that is used to set the poverty line, all of which the World Bank has refused to do up to the present, despite some of the recommendations from its own high-level Commission (WB 2017a). As a result, we are left with poverty standards that are minimalist, whittled down to the necessities for mere food survival and that are arguably depreciating over time because of the logic of their construction, rather than anything that approaches a standard of decency or that can match the profound transformations that have been witnessed around the world over the past half-century.
However, even with the inclusion of a broader range of social needs, the fundamental weakness of these lines remains with the question of social goods such as health and education. Such goods render the comparability of absolute lines very questionable across contexts with very different welfare and social provisioning systems, in particular between those with more universalistic provisioning, free at the point of use and funded progressively through direct taxation, versus the less-universalistic systems, with user fees at the point of use and high degrees of stratified privatised provisioning. Ultimately, such differences cannot and should not be resolved through comparative poverty measures but instead need to be subjected to social and political debate regarding the types of societies we wish to inhabit together.
For these types of reasons, the international comparison line based on the PPP conversions used by the World Bank are to a large extent meaningless for the purpose of actually understanding local realities facing poor people in any particular context. At the very least, they muddy the water much more than they clarify, especially for the comprehension of ordinary people, and they render intangible and inaccessible a subject that should be a matter of national public debate and deliberation. In particular, making the arbitrariness of poverty lines more apparent would provide the basis for contestation by the poor or those representing the poor, whereas the opacity and obscurity of these measures has a tendency to disempower such contestation if only through the force of sheer incomprehension.