Chapter 3
Fund Manager
In this chapter we look at John Templeton’s long career as the manager of mutual funds and attempt to answer a fundamental question: How good was he as an investor? During his lifetime he received numerous accolades. Forbes magazine, for example, described him as “one of the handful of true investment greats in a field of crowded mediocrity and bloated reputations.” Another financial magazine went further, describing him as “the greatest stock picker of the century.” In Money Masters, John Train’s popular book about the giants of the late twentieth century investment business, it is the track record of the Templeton Growth Fund which, he concludes, “proved that John Templeton is one of the great investors.”1 Ken Fisher, CEO of Fisher Investments, says: “To say Sir John is legendary is an injustice to the word legendary.”
Such accolades slip easily into print, but how well justified are they? To answer that question, we focus on the performance of the Templeton Growth Fund, which was launched in 1954 and still exists today. Although he had previously created other mutual funds, and was later to launch others with similar objectives, the Templeton Growth Fund (TGF) is the one that was responsible, after flying under the radar for many years, both for establishing his reputation as an outstanding investor and for laying the foundations of his substantial personal wealth. This in turn made possible the great majority of his many charitable and philanthropic activities. The critical importance of this one fund in shaping his life was something of which Templeton himself was acutely aware, and to which he frequently referred in later years.
As we noted in the previous chapter, Templeton was happy to admit in later life that his biggest regret was not getting into the fund management business earlier. When a young English fund manager traveled to the Bahamas in the early 1990s to ask Templeton for advice on how to succeed as a professional investor, he put a simple question: “Sir John, what is the most important single lesson you have learnt in your long career?” To his surprise, the answer that came straight back had nothing to do with the finer points of stock picking or any other aspect of security analysis. Instead, said Sir John, his answer would be “the importance of distribution” (by which he meant the ability to put his funds into the hands of as many investors as possible).2 The reason for his regret, in other words, was that the economics of the fund business were so clearly superior to that of his earlier profession of investment counseling.
Looking at the data for the performance and size of his flagship fund over the course of his 38 years as a fund manager makes clear the truth of this comment. His involvement in mutual funds had begun, as we have seen, in the early 1950s. The Templeton Growth Fund, launched in 1954, was one of five mutual funds, according to a 1959 press article, in which he was involved in one capacity or another by the end of the decade. The five included the enticingly named Nucleonics, Chemistry & Electronics Shares fund, set up, one assumes, to try to cash in on investors’ enthusiasm for the new technologies and industries that were emerging after the war. (Even in its infancy, the mutual fund business was never slow to spot commercial opportunities for selling shares in funds that invest in new growth industries.)
In 1958 Templeton joined forces with William G. Damroth, a sales and marketing professional, and author of a self-improvement title, How To Win Success Before 40, to issue shares in a joint venture management company, the Templeton Damroth Corporation.3 Asked to justify the hefty front end sales charges (loads), Templeton commented that in his experience “no load” funds, although cheaper, “simply do not grow because few investors take the time to find out about them.” It is clear that Templeton was aware of the importance of marketing his funds, but success seems to have been elusive. While in his public speeches, and in the media, he invariably described himself in this period as an investment counselor, rather than as a fund manager, it is evident that he was well aware of the potential rewards of expansion into mutual funds. “Few businesses,” he was quoted in an article as saying, “had better growth prospects.”
The Templeton Growth Fund was a conscious effort to broaden the base of investors who wished to tap into his firm’s investment expertise. It was also, just as importantly, one of the very first mutual funds to offer investors in North America the opportunity to invest in a diversified portfolio of non-U.S. stocks, something which, for both cultural and legal reasons, investors at the time rarely chose, or were able, to do.4 For tax reasons the fund was initially domiciled in Canada, and for its first few years the portfolio consisted mainly of Canadian stocks and bonds, although the fund from the outset had a mandate to invest up to one third of its capital outside Canada and the United States. The launch followed hard on the heels of a ruling by the Securities and Exchange Commission, in April 1954, which for the first time permitted the sale of shares in Canadian domiciled investment trusts to U.S. investors. Because the fund paid no capital gains tax, and the fund’s initial policy was to not pay dividends, thereby avoiding income tax, a key selling point of this and other funds like it was that they offered U.S. investors the opportunity to roll up gains from Canadian and other global equities free of tax. Gains were only taxed, at the rate of 25 percent, when an investor sold shares in the fund. The SEC ruling was one of the seeds from which the multibillion-dollar global fund management industry we know today was eventually to grow.
Templeton continued to manage the Templeton Growth Fund for 38 years after its launch. An extract from the first annual report of the fund is reproduced in the Appendix. Templeton, Dobbrow & Vance appears as the fund’s investment adviser and Templeton himself as president and a member of the 12-man board. The first annual report notes how, by April 30, 1955, two months after the closing of the public offer of shares, the number of shareholders had increased from 493 to 1,060 and the number of shares outstanding from 302,000 to 340,000. It was a relatively modest beginning. The gross underwriting fee paid to White Weld, as underwriter of the public offer, amounted to 5 percent of the $6.6 million raised. As the investment adviser, Templeton’s investment counsel firm was paid an annual management fee equivalent to 0.5 percent per annum for the first $10 million of assets, reducing to 0.375 percent for the next $10 million and 0.25 percent when (and if) the fund reached $20 million in assets. At the balance sheet date of April 30, 1955 the fund’s net asset value had risen modestly from $20 per share to $20.89 (in U.S. dollars). Just over 60 percent of the fund was invested in equities, 18 percent in preferred stock and around 20 percent in fixed interest securities (including Canadian and U.K. government bonds). The report listed holdings in 27 Canadian equities, of which around a third by value were in forestry and mining. Overall, Canadian assets accounted for 90 percent of the fund’s net worth. See Figure 3.1.
Figure 3.1 Before the Bahamas, 1954 to 1968—36-Month Rolling Returns
Despite impressive capital gains, the Templeton Growth Fund would not have outperformed a global world equity index in its first 15 years, we think, had such an index then existed.
Source: Nairn and Scott (1997).
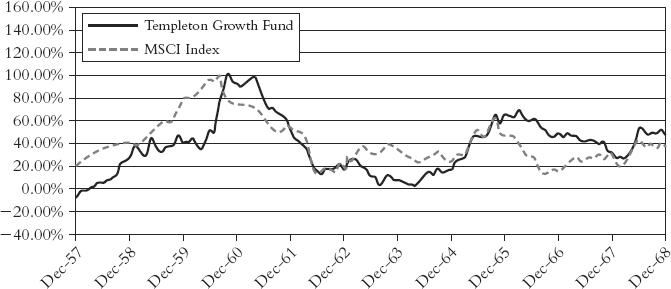
Subsequent annual reports track the steady continued appreciation in the value of the fund, while simultaneously underlining the slow—indeed, snail-like, not to mention periodically negative—rate of growth in the amount of money in the fund, the issue that was to cause Templeton so much future regret. In 1957, for reasons that remain unclear, but presumably in an effort to increase sales, the fund was briefly renamed and reconstructed as the Axe-Templeton Growth Fund of Canada, with shares now being marketed on a continuous basis through a network of investment dealers organized by a Canadian advisory firm, E. W. Axe and Co., which also joined Templeton, Dobbrow & Vance as joint investment advisers. As a result of the reconstruction, more than half the shares in the fund were redeemed, and the net assets of the firm fell to Can$2.9 million, of which more than a third was owned by the directors and others associated with the fund. The net asset value per share also fell. A contemporary book about the investment industry in Canada in 1958 lists more than 30 funds primarily owned by investors from the United States. Only one has fewer assets than the $4 million in the Templeton Growth Fund, while several are 5 or 10 times as large.
It was not until the early 1960s, around the time that Templeton sold his investment counseling firm, that the arrangement with E. W. Axe was unwound and Templeton resumed his role as the sole investment adviser of the fund, this time through a new management company, Templeton Management, Ltd. The 1965 annual report of the Templeton Growth Fund notes that the net asset value of the fund, now $15.14 (Canadian) per share, was more than three times the initial issue price, adjusted for subsequent share issues and redemptions. Yet the net assets of the fund were still only $4.7 million (Canadian), barely 70 percent of the amount initially raised more than ten years before! To make things worse, shares in the fund were no longer being offered directly to U.S. citizens, following a recent decision by the U.S. Treasury to tax purchases of foreign securities by U.S. citizens.5 A new Canadian withholding tax on the fund’s non-dividend income was also creating some difficulties, requiring the fund to make up the difference to shareholders and then create a reserve, which had the effect of reducing the net asset value.
Despite its healthy investment gains, in other words, the first decade of the fund’s life left a good deal to be desired in commercial terms. The only consolation by the mid-1960s was that Templeton’s investment advisory fee from the fund had risen to $21,000 a year. By the end of the decade, this had risen further, to $30,000 a year (Canadian). Yet the same pattern of continued investment advance coupled with modest asset growth remained. By the time of the 1969 annual report, net assets had risen to $6.8 million (Canadian), despite the fact, as Templeton pointed out again in his cursory statement to shareholders, that the value of shares in the fund were now five times what they had been at launch 15 years before. Out of 1.79 million shares issued, more than 1.50 million had been redeemed, meaning that the number of shares in issue was also lower than at the outset of the fund 15 years before. As a result of the redemptions, Templeton disclosed, he himself now owned more than 10 percent of the shares in the fund. If nothing else, Templeton Management, Ltd. was being paid well for looking after his own money. Yet if Templeton was ready to sell the fund at the time of his move to the Bahamas, as we now know he was, it would hardly have been a surprise. The sparseness of his letter to shareholders—eight short sentences, amounting to barely 100 words in total, a fraction the length of his first annual report statement in 1955—could be interpreted as suggesting he may well have been losing interest in the fund business.
What had clearly changed by the 1960s, however, was the composition of the portfolio, reflecting Templeton’s growing interest in international diversification. In his 1967 letter to shareholders he noted that the 12 largest common stock investments in the fund now included two companies from Holland (Phillips and Royal Dutch Petroleum), and one each from Japan, Germany, Sweden, and Great Britain. Other than Canadian government bonds, the largest single holding in the fund was Shiseido, a Japanese cosmetic company. It was the only Japanese stock in the portfolio, but it amounted to 13 percent of the total value of the fund. The fund in 1967 also owned a series of German and Japanese bonds. Overall, however, the fund had fewer than 30 investments. Pointers to Templeton’s maturing style as a fund manager—the global focus, the concentration on high conviction ideas, and the willingness at times to hold high levels of liquidity in the shape of government bonds—were nevertheless beginning to become apparent.
Two years later, in the 1969 report, around the time that Templeton and his wife were packing their bags to live full-time in the Bahamas, the pattern remained broadly similar. Shiseido, the Japanese cosmetic company, was still the largest single holding, now up to 14.5 percent of the fund by value, followed by Ericsson, the Swedish telecom manufacturer. The holdings of foreign and government bonds accounted for more than a third of the value of the fund, reflecting Templeton’s concern at the heightened valuations in equity markets prevailing at the time. Given the size of the fund, he could not, it seems, find more than 20 individual stocks anywhere in the world that met his demanding valuation criteria.
Much has been made in profiles and biographies of Templeton’s brilliant and contrarian move to take big bets on unfashionable Japanese stocks from the 1960s onward. His coup in finding fast growing Japanese stocks that were trading at ridiculously low P/E ratios features prominently in published accounts of his life and career. In fact, Templeton himself had already started to buy Japanese shares for his own account through a broker in the mid-1950s. His clients were also being alerted to the potential in Japan as early as the late 1950s, well before the strength of the postwar Japanese miracle had come to be appreciated by investors in the West. In May 1959, for example, Templeton wrote a long memo to clients pointing out the success that Japanese companies were having in winning export business in the United States and Europe (see the Appendix). He pointed out that bonds of good Japanese companies could be bought for twice the yield on similar U.S. issues (8 percent against 4.2 percent), while stocks yielded 1.0 percent more than the Dow Jones Industrial Average.
Further, he noted that although there were still at that time restrictions on repatriation of capital, the Japanese did not impose a withholding tax on dividends remitted by Japanese companies to U.S. shareholders, meaning they were taxed less heavily than dividends from American corporations. In addition, he pointed out, just 1.59 percent of Japanese shares were owned by foreigners. The five stocks he recommended to his clients in 1959 were not, however, at least ostensibly, the dirt cheap growth stocks in which his fund was to invest in years later. All five, Toyota, Matsushita, Sanyo, Ankyo, and Riken Optical, were trading, according to his memo, on multiples of between 15 and 20 times earnings. Although they had useful dividends, they would not have been obvious bargains to a traditional value investor, at least until it was possible to dig deeper, as Templeton was able to do, into the question of how Japanese accounting rules affected the reported figures, which in many cases had the effect of disguising the true level of profitability. (If he had already identified the way that accounting treatment was disguising the true rate of profitability of these companies, it seems logical to expect that he would have mentioned it in his memo, but he did not—implying that this realization was only to come later.)
Yet, as we have seen, if Japanese stocks were attractive, they did not, apart from Shiseido, figure prominently in the Templeton Growth Fund portfolio until the early 1970s. The important point was that he was more than willing to extend his search for bargains to countries that many other investors at the time were either unwilling or unable to consider. As early as 1955 Templeton had sent a series of letters to clients describing his impressions after a trip to Europe, and in 1959 he repeated the exercise after a 17-day visit that took in six different countries in Europe. “Travel and study of stocks and bonds in other nations,” he observed in one letter, “serves two purposes. Firstly it leads to discovery of attractive opportunities in the securities of those nations. More importantly, a study of the exotic conditions and investment trends in other lands helps us to understand more clearly what can happen in our own nation. It teaches us to question the economic theories and fads popular here. It gives us deeper respect for the fact that the most unexpected things can happen and often do.”6
It was from this and his earlier experience that he began to list the distinctive qualities that made one country rather than another suitable for outside investors. In Japan, he saw a politically stable society that was making a determined effort to recover from World War II and recognized in the country’s people many of the characteristics—hard work, respect for business, thrift—that he most admired and looked for when considering new countries in which to invest.7 Although he invested personally in Japanese stocks, the main obstacle to the fund investing in Japan was its restrictions on capital repatriation, which were not fully lifted until the second half of the 1960s, following Japan’s admission as a member of the OECD. Capital controls were one of several barriers that tended to make a country unattractive as a place to invest in. Others included lack of respect for property rights, populist governments, and socialistic tendencies. “Great prosperity only occurs only when people are free. If we regulate people excessively, we slow down and perhaps prevent—even reverse—the trend towards prosperity.”8 See Figure 3.2.
Figure 3.2 1970s: A Tough Decade—36-Month Rolling Returns
The 1970s was a tough time for equity investors, with a savage bear market in the United States and U.K. John Templeton’s holdings of bonds and Japanese shares were critical in keeping his investors out of trouble.
Source: Nairn and Scott (1997).
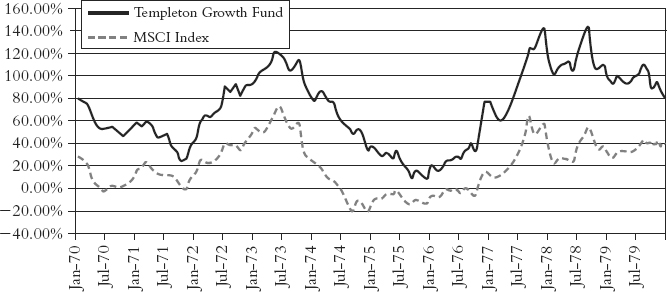
With the exception of Shiseido, it was not until 1971 that Japanese stocks began to appear prominently in the Templeton Growth Fund. It did not take long for the boldness (and wisdom) of his move to become apparent. At its peak in 1974, no less than 62 percent of the fund by value was invested in Japanese shares. Contrary to mythology, many of the most famous Japanese exporters of the time, such as Canon, Toyota, and Sony, never featured in the portfolio. In absolute terms, the fund’s largest single gains came from Sumitomo Trust, a bank, and Bridgestone, the tire company, and from the bonds (not the shares) of Nissan. Drug companies were a particularly strong favorite. Most of the purchases were made in 1972 and 1973, and by 1975, having made significant gains on many of them, Templeton was already turning his attention back to the U.S. stock market, where the market crash was beginning to offer superior bargains. By the time of the 1978 annual report of the fund, the proportion of the fund in Japanese stocks had fallen to less than 10 percent of the portfolio, against 42 percent in U.S. stocks. This was a trend that was to continue well into the 1980s.
Several different factors, it is clear, were in Templeton’s mind at the time of his initial Japanese purchases. It was not just that the stocks themselves were very attractively priced and potential bargains in his way of thinking. Because the fund was so small, and effectively operated without any investment constraints, he was free to make what conventionally would be regarded as an extraordinarily risky concentrated bet on stocks of just one country. Just as important, however, was the fact that by the late 1960s, the stock markets in the United States and the United Kingdom were becoming excessively overvalued in the face of what, it was soon to become clear, was the worst economic crisis the West had faced since World War II. Share prices hit a peak in 1972, but were soon to experience heavy falls as the full impact of the OPEC oil embargo and the inflationary pressures which had been building for many years finally took their toll on economic growth and corporate profitability around the world. The Dow Jones index, already seriously overvalued, fell 45 percent between January 1973 and its nadir in December 1974, and the London market by an even greater amount.
If Templeton had not felt that most U.S. and European stocks were seriously overvalued, it is unlikely that he would have allowed his Japanese holdings to become such a dominant component of his fund’s portfolio. Japan was to suffer more than most countries from the impact of soaring oil prices, yet the growth fund’s Japanese stocks were protected from the worst of the decline by virtue of being so cheap at the point at which they were bought. What he liked about the shares, it seems clear from studying the pattern of his holdings over these years, was not their growth rates, but simply the fact that they were selling on such low multiples of earnings. If ever there was an illustration of one his core ideas as a fund manager, that the shape of a portfolio should be driven by where cheap stocks were to be found, not by preset limits on how much could or should be held in this or that country, or this or that industry, the experience of the early 1970s provided it. (See Figure 3.3.)
Figure 3.3 U.S. and Japanese Market Price-Earnings Ratio, 1970 to 2000
John Templeton switched his attention from Japanese to U.S. equities when their valuations started to diverge in the late 1970s—only to see the gap widen for the best part of another decade.
Source: Thomson Datastream.
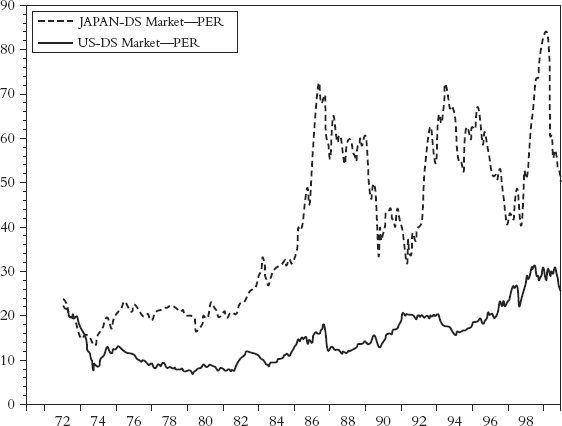
The big weighting in Japanese stocks helped the fund to an exceptional 68 percent gain in the calendar year 1972, the final peak in the global stock market cycle, although it could not prevent the fund losing money in both 1973 and 1974, albeit at a slower rate than the world index. Over the three years 1972–1974, thanks mainly to the Japanese equities and bond holdings, the Templeton fund outperformed the market by more than 60 percent, and crucially left investors still sitting on longer term gains, during a period when the average investor holding the world market index was facing significant losses. When the Japanese stocks owned by the fund returned to more normal multiples, Templeton sold them—only to see them rise even further as Japanese shares were rerated to much higher multiples. This turned out to be a move from which the Growth Fund, ironically, largely failed to profit. By the end of the 1970s the Japanese stock market, on conventional analysis, was already selling at three times the P/E ratio of the U.S. stock market.
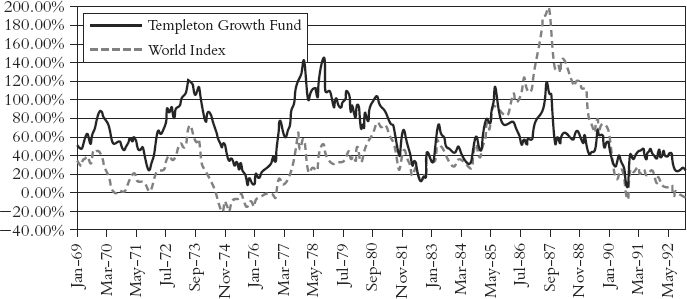
The early 1970s, although one of the darkest periods in recent economic history, proved in hindsight to be the period in which the fortunes of Templeton and his fund finally took off. This success was driven by two new factors. One was the fact that his performance as fund manager improved dramatically after his move to the Bahamas (see Figure 3.4). Templeton discovered that working alone, hundreds of miles from the daily dramas of Wall Street, produced an extraordinary improvement in his ability to pick stocks. The two decades that followed his move, even with only one or two hours a day in which to conduct research, gave full flower to his genius as a stock picker. They were the making, quite deservedly, of his reputation as one of the greatest investors of the century. The move into Japanese stocks was the first of many such moves that revealed both the rigor and the boldness of his methods.
Figure 3.4 The Bahamas Years—36-Month Rolling Returns
After moving to the Bahamas in the late 1960s, Templeton found that his performance as an investor improved dramatically—it was the start of the fund’s most successful years, during which it outperformed the world index by 6 percent per annum.
Source: Nairn and Scott (1997).
The second new factor was the one that was to turn the improved performance of this tiny and still largely unknown fund into a formidable cash generation machine and the bedrock of a global fund management business. As described in Chapter 1, the turning point came in 1974 when a former accountant and airline pilot named Jack Galbraith agreed to take on the task of marketing the fund full-time. It was only now that the fund as a business began to grow rapidly, as the effect of Galbraith’s simple but effective sales and marketing efforts began to bear fruit. In 1974, 20 years after raising $7 million at its launch, the fund still had just $13 million in assets. Adjusted for inflation, the fund had barely grown at all in over two decades. It still had fewer shares in issue than when it started.
This was not because the fund had failed to deliver good performance. On the contrary, the capital value of the fund had grown ninefold in the first 20 years of its existence, a compound rate of return of around 12 percent per annum. The modest size of the fund at this point was a testament both to the trough into which the stock market had slumped in the mid-1970s and the fund’s almost total lack of marketing presence. It remained so small that it barely figured on investors’ radar. The figures show that the fund suffered regular redemptions throughout its first two decades. Although the fund was producing good returns, it is clear that many investors failed to appreciate what a potential gold mine they were sitting on.
Under Galbraith’s energetic leadership, the subsequent growth in the fund was striking, underlining the scale of the opportunity that had been lost for so many years before. His approach was simplicity itself: a heavy focus on the extraordinary track record of the fund, combined with the payment of hefty upfront sales commissions (typically as much as 7 percent), and an active PR campaign, including the first of what were to become regular appearances by Templeton on the popular TV program Wall Street Week. Within four years the assets in the fund had grown more than sevenfold to reach $100 million. By 1980, net assets had reached Can$420 million, or more than 40 times the size of the fund 10 years earlier. With the onset of the great global bull market that developed during the 1980s, it was not long before the size of the fund was being measured in billions rather than millions of dollars. By 1986, the fund had reached Can$2.4 million, at which point Galbraith recommended that the fund should be split in two, to allow for the launch of a sister fund, this one registered in the United States rather than Canada. Following the split, 42 percent of the assets remained in the Canadian entity, with the balance accruing to the U.S. counterpart, which continued to invest in exactly the same way. A change in the U.S. tax regulations, this time the introduction of a foreign tax credit on overseas investment, was an important trigger for this move. See Table 3.1.
Table 3.1 Templeton Growth Fund: Key Figures
Source: Nairn and Scott (1997).

The evidence of Galbraith’s market efforts were to be seen in many ways as the fund grew. The annual reports became both more comprehensive and more boldly illustrated. Each one now invariably appeared with a graphic representation of “the mountain,” showing how far and how fast an original investment in the Templeton Growth Fund would have grown since launch in 1954 (Table 3.1). The fund continued to levy exceptional upfront sales loads, equivalent to as much as 7¾ percent of the amount initially invested; so strong was the track record that these hefty upfront charges proved no obstacle to further sales growth. Of necessity, as the cash flowed in, the number of investments held in the fund grew accordingly. By the time the 1985 annual report was issued the fund had more than 115 individual securities, spread across four continents and 21 different industrial categories. The largest single holding in 1985, American Stores, Inc, nevertheless still accounted for 7 percent of the common stock portfolio, a sign that despite its rapid growth, Templeton was still prepared to place sizeable individual bets on companies that met his valuation criteria.
A year later, in April 1986, the annual report indicated that Templeton was becoming concerned about the extent to which the bull market had run ahead of itself, driving valuations to excessive levels. His strategy as a fund manager from the outset had been to build up holdings of bonds and cash whenever his analysis suggested that equity markets were rising above their “normal” levels. The same discipline that had underpinned his approach to managing clients’ money in the 1950s persisted into his career as a fund manager. While the 1986 annual report makes no mention of the newfound caution, it is evident in the balance sheet of the fund, with bonds, preference shares, and Treasury bills amounting to no less than 28 percent of the total portfolio. Some of this can doubtlessly be attributed to the sheer scale of money flowing into the fund. The following year, with the reporting date now the end of August, the U.S. fund was still reporting 16 percent of its holdings in bonds, cash, and preferred securities. Less than two months later, the October 1987 crash produced the most traumatic two-day decline in stock market history. Having lagged the market index for several months, Templeton’s caution and refusal to overpay in the frothy market that had developed in 1987 once again propelled his fund back into the ranks of top performers.
On this occasion, however, his superior performance was not to endure for long. While it remained an extremely profitable home for fund investors’ money, the second half of the 1980s proved to be the worst period of relative performance the fund was to endure in its 50-year history. The reason was simple. These years marked the tail end of the great Japanese stock market bubble, which by the end of the decade was to take the market capitalization of the Tokyo stock market to 40 percent of the world index, the benchmark against which global equity funds were generally measured. Templeton’s refusal to pay the absurdly high prices for Japanese stocks that this implied meant that his relative performance was bound to suffer as the Japanese market climbed ever steadily higher. From 1987 onward the Templeton fund had no holdings at all in Japan. It was only after 1989, when the Japanese market finally peaked, that the wisdom of Templeton’s refusal to breach his principles became apparent. He was right that the market had become overvalued—but from the perspective of anyone tracking short-term performance, his decision to abandon the Japanese market was way too early. In that sense Templeton’s involvement with the Japanese stock market turned to be not his finest hour, but ironically one of his worst moves.
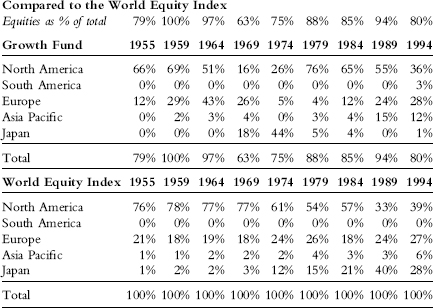
The changes in the makeup of the portfolio that characterized John Templeton’s time in charge of the fund are illustrated in Table 3.2. The top line shows the fund’s commitment to equities at roughly five-yearly intervals. From 100 percent in 1959, the equity component falls to as little as 63 percent in 1969, as he became increasingly nervous about the level of market valuations. These were the so-called go-go years for the stock market in the late 1960s, when a new breed of “gunslinger” fund managers burst on the scene, and investors went wild for any company associated with electronics and other new technologies, driving up stock market valuations to unprecedented levels—an uncanny foretaste of the much bigger technology stock bubble which was to follow 30 years later.9 The remainder of the table shows the holdings of the fund by region. Comparing these to the equivalent weightings in the MSCI World Index, we can see how regularly and by how much Templeton’s holdings deviated from those of the world market. The relative briefness of Templeton’s foray into Japan is very evident from these figures. The disparity between fund and index is an inevitable characteristic of the value-driven investment approach Templeton chose to adopt.
Table 3.2 Templeton Growth Fund Weightings
Source: Templeton Growth Fund annual reports. MSCI World index from 1974 only: previously, author calculations.
By the time this became apparent Templeton’s time in personal charge of the fund was coming to an end. With more of the stock picking already having been delegated to Templeton’s assistant Mark Holowesko, in 1992 Templeton Galbraith Hansberger, as the firm had become, was sold to Franklin Resources, another fund management company, for $440 million. The assets of the fund by now were more than 1,500 times what they had been 18 years before. The effect of Galbraith’s marketing efforts had a dramatic impact on the profitability of the Templeton Growth Fund. In 1972, after 18 years in operation, the fund was earning Templeton and his partners the useful, but hardly princely, sum of $40,000 a year (equivalent to approximately $210,000 in today’s money, adjusting for inflation). By the time the business was sold to Franklin Resources, the annual management fee from the U.S. portion of the fund alone was more than $17.8 million. This was 85 times more fee income than the fee produced 20 years before, according to the annual report—and the fee income was still growing strongly.10 In addition to the management fee charged by the Templeton Management Company, the fund was also paying out more than $3 million a year in sales commission to the Templeton Distribution Company.
Although he continued to take an active role in overseeing the investment performance of his various family and charitable foundations, and his views on investment continued to be widely sought, 1992 therefore marks the point at which John Templeton, by now approaching 80 years of age, retired from full-time professional investing. While his investment experience spanned the best part of eight decades, his professional career as a fund manager and investment counselor can be said to have lasted for 54 years. He continued to make large and mostly successful strategic investment decisions from 1992 until his death, and his views remained keenly sought by the media, but these were mainly on his own account, or for the benefit of his charitable activities, not for the benefit of others in a professional capacity.
Performance of the Templeton Growth Fund
There is no shortage of performance data for the Templeton Growth Fund, which, unlike John Templeton’s investment counseling firm, remains in existence today. We have continuous daily performance data for this fund from 1954 to the present. The 38 years between 1954 and 1992, during which John Templeton was either directly managing or overseeing the performance of the fund, provide the concrete evidence on which we can judge his success as a professional investor.
For many good reasons, care is needed when analyzing fund performance. The fund business has always relied heavily on marketing and sales incentives to win business, and performance claims, naturally presented in the best possible light, are one of the key selling points. For the unwary, interpreting fund performance figures is a hazardous business. What investors think they are buying quite often turns out to be not either what they thought they were getting, or what they had been promised.
The evidence from an analysis of the performance of the Templeton Growth Fund is clear and compelling, however. Our analysis of the TGF’s performance covers the period from 1954, when the fund was launched, to 1992, when the business was sold.11 In the last five years of this period, day-to-day management of the portfolio was in the hands of Mark Holowesko, a qualified investment analyst who had become John Templeton’s assistant in the Bahamas seven years before. From 1987 onward Holowesko carried out most of the specific stock research and suggested trades for Templeton to approve. He worked in an office down the hall from Templeton’s own office in Lyford Cay in the Bahamas and talked to him every day, other than those when the latter was traveling.12 Templeton himself retained overall responsibility for the fund. It was he who set the strategy and was responsible for many of the ideas that were reflected in the portfolio.
The performance of the Templeton Growth Fund over the 38-year period of our analysis is summarized in the tables and graphs that follow. The most important findings that come out of this analysis are discussed here.
Long-Term Outperformance
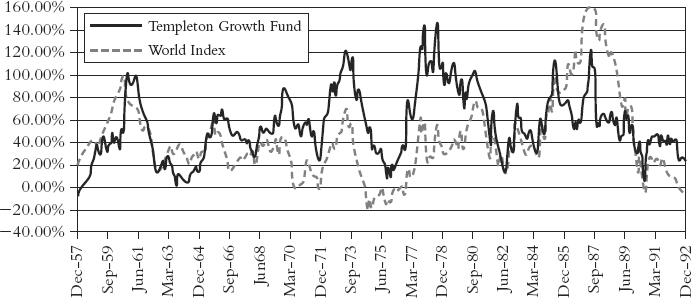
The average 12-month return of the fund in the period 1954 to 1992, measured on a total return basis, was 16.0 percent per annum. This was 3.7 percent per annum more than the return offered by the world stock market over the same period.13 See Figure 3.5. While Templeton was running the fund, in other words, it produced a 12-month return that on average was approximately one third as good again as that recorded by the equivalent global stock market index. Few other professional investors have achieved such a consistent long-term track record of outperformance over a period of so many years.14
Figure 3.5 The Whole Period: 1954 to 1992 (36-month rolling returns)
The Templeton Growth Fund’s record over the 38 years that John Templeton was in charge has rarely if ever been matched for consistent long term outperformance. The fund never employed debt to boost returns.
Source: Nairn and Scott (1997).
While a margin of 3.7 percent per annum may at first sight seem a relatively modest level of outperformance, in fund management terms it is anything but. Only a handful of professional fund managers can boast such a record over 10 years, let alone sustain it over nearly four decades, as Templeton was able to do. A margin of 1 percent per annum is typically enough to earn a fund manager a star rating, and 2 percent per annum, if consistently maintained without the assistance of leverage, is the stuff of which great reputations and great fortunes can be made, so rarely is it achieved in practice.
Every year, for example, Standard & Poor’s calculates the number of professional fund managers in the United States who have managed to outperform their relevant benchmark on a one-, three-, five- and ten-year basis. Only a small handful have consistently outperformed the market over a 10-year period and hardly any have produced a positive real return in every single 60-month period. For many years, as Professor Burton Malkiel noted in early editions of his classic book on the stock market, A Random Walk Down Wall Street, the Templeton Growth Fund was one of the few funds in the entire mutual fund industry that could claim such a long-running record of sustained success. Tables 3.3 and 3.4 show the five yearly returns that were achieved for a single lump sum investment originally made in 1954. The figures are shown in both nominal and real terms, that is before and after taking account of inflation over the relevant period. They show the rate at which an investment in the fund would have compounded, a so-called geometric average. By its nature this figure is slightly lower than the arithmetic average given at the start of this section.
Table 3.3 Single Lump Sum: Nominal Five-Year Return on Investment, 1954 to 1997
Source: Nairn and Scott (1997); Datastream/ICV.

Table 3.4 Single Lump Sum: Inflation Adjusted Five-Year Return on Investment, 1954 to 1997
Source: Nairn and Scott (1997); Datastream/ICV.

One of the most important benefits that flows from consistently superior fund performance, where it can be found, is that it provides disproportionate rewards to long-term investors, those who have the patience to wait for returns to flow through to their accounts. Many years ago Albert Einstein described compound interest as the eighth wonder of the world. In investment the ability to compound positive returns can indeed produce wondrous results, something that the history of the Templeton Growth Fund faithfully illustrates. An investor who committed $10,000 to the fund at its launch in 1954 and held on to that investment for the entire 38 years, during which John Templeton remained in charge of the portfolio, would have had by the end a holding worth $1,736,108, a 170-fold increase in value.
A similar holding in the MSCI World Index, had such a thing been possible through all those years, would have been worth $534,907, less than a third as much.15 An initial investment in the fund would have compounded at the rate of 14.6 percent per annum over the 38-year period, compared to 11.1 percent per annum for the MSCI World index proxy that we use in our analysis.16
For every dollar invested at the outset, therefore, the Templeton Growth Fund generated a final sum at the date of its founder’s retirement that was three and a quarter times greater than that offered by the markets in which it was investing.17 It is true that figures presented in such an impressive fashion can be misleading. As we have seen, by far the majority of the money in the Templeton Growth Fund was invested in the last 20 years of John Templeton’s tenure as the fund manager, and so would not have enjoyed the benefits of such a long period of compounding. (This is a regular feature of fund industry experience: A fund that puts together a strong track record in its early years is then heavily marketed but is unable to repeat the performance for the new wave of money that flows into the fund.)
Nevertheless, the returns from compounding remained significant over shorter periods as well, as is evident from Tables 3.3 and 3.4. Investors in the Templeton Growth Fund on average doubled their money every five years in nominal terms. One reason is that, contrary to normal fund management experience, the margin by which the fund outperformed the market as a whole increased, rather than fell, once the fund began to grow in the 1970s. From its inception until the end of the 1960s, while the fund grew ninefold, as we have previously noted, according to our figures it did little more than keep pace with the world stock market over that period. (We use a proxy for the MSCI World Index, as no global market index existed at that time, reflecting the lack of cross-border portfolio investment during this period and the fact that just two stock markets, the United States and the United Kingdom, dominated the world in terms of market capitalization.)
Between 1969 and 1992, the years when John Templeton lived and worked in the Bahamas, rather than on Wall Street, the margin by which the fund outperformed the World Index increased dramatically, averaging an even more remarkable 6.0 percent per annum. Thanks to compounding, this generated further substantial capital gains for the fund’s investors. The compounding of returns is one of the strongest reasons for considering a disciplined, long-term investment strategy of the kind John Templeton first pioneered and then practiced himself.
Figures 3.6 and 3.7 show the cumulative returns from the fund on both an absolute and a log scale. The latter shows the rate of change in the growth of the value of the fund, rather than the absolute gains. It is no surprise perhaps that Figure 3.6, the one referred to inside the Templeton organization as “the mountain” chart, was the one that was chosen to represent the fund’s performance to potential investors. (It featured prominently, for example, in every annual report of the fund from the time that John Galbraith first became involved in marketing it.)
Figure 3.6 Templeton Growth Fund 1954 to 1996
A chart of the cumulative gains from an early investment in the Templeton Growth Fund, known figuratively inside the firm as “the mountain,” because of its sequence of rising peaks, featured prominently in the firm’s marketing efforts. This is a page taken from one of the fund’s annual reports.
Source: Templeton Growth Fund Annual Report 1996.
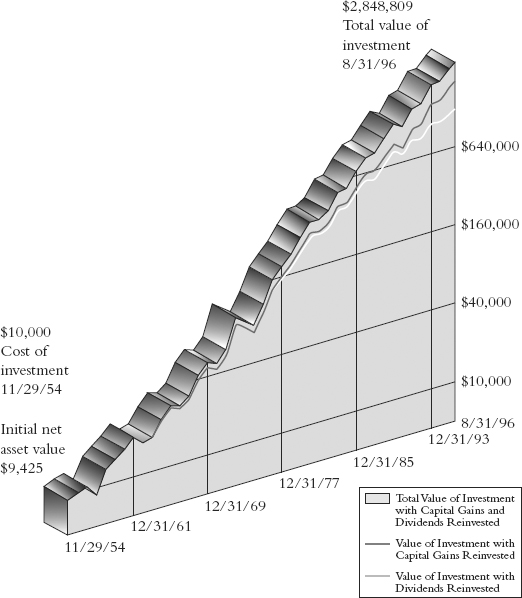
Figure 3.7 Templeton Growth Fund 1954 to 1992, Log Scale Chart
A log scale chart, measuring the rate of growth in the fund’s net asset value per share, gives a more accurate picture of the fund’s progress—and in some ways is an even more remarkable tribute to its founder’s stockpicking skill.
Source: Nairn and Scott (1997).
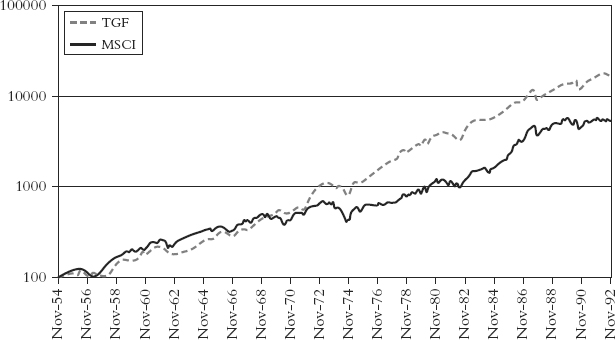
The second, log scale chart, Figure 3.7, is in some ways, though, the more remarkable one, as it shows the consistency with which Templeton’s investment methods succeeded in outperforming the world index over a long period, and particularly from the late 1960s onward. Contrast this, for example, with the performance of shares in Warren Buffett’s company, Berkshire Hathaway, which clearly show the rate of gain declining as the company and its investments grew bigger.
Another notable and possibly unique feature of the Templeton Growth Fund’s performance under John Templeton is the 100 percent consistency with which it achieved positive five-year returns, not just before but also after allowing for inflation. From year to year, the fund inevitably experienced significant volatility. Like all investors, John Templeton had good years and bad years. The fund achieved its best 12-month return in the year to November 1972 (gaining 80.7 percent) and suffered its worst 12-month decline in October 1974 (declining 25.0 percent). Measured in calendar years, the fund produced a negative return in 10 out of the 38 years during which John Templeton was in charge.
However, Templeton himself never claimed to be able to beat the market in every single year, and always emphasized the importance of investors investing for the longer term. His own holding period for an investment was typically four to five years. Five years was also the period over which he urged investors to judge the performance of his fund. The performance of the fund in real terms over five-year periods, which is summarized in Table 3.3, perhaps demonstrates more clearly than any other figure why Templeton was to achieve such renown as a professional investor.
Tables 3.3 and 3.4 show that there was not a single 60-month period in the 38 years during which the Templeton Growth Fund failed to produce a positive return, not just in nominal terms, but also after taking account of inflation. The worst five-year real return of the fund was 8.6 percent, or 1.7 percent per annum, in the 60 months up to and including July 1982. By contrast, over the same 38-year period the MSCI World Index failed to produce a real five-year return on several occasions; and in its worst five-year period, the five years to September 1974, lost a third of its value (33.8 percent) in real terms. Even T-bills, or short term Treasuries, which are widely regarded as the safest form of U.S. government bond, produced negative returns in some 60-month periods at this time. Yet any investor who bought the Templeton Growth Fund and had the patience to hold on to it for five years would have been certain of seeing his or her money grow in value, even after allowing for the effects of inflation.
Not that this always satisfied those investors, or the media. A good deal of focus on fund performance, then as now, was much more short term. On more than one occasion, despite his growing reputation, Templeton was criticized for the poor relative performance of his fund. In the five-year period from 1971 to 1975 inclusive, for example, he underperformed the market in three out of five years. He did the same again in the mid-1980s. Investors who had money in the fund at these points might have begun to wonder whether he had lost his magic touch. Forbes magazine, which had earlier highlighted Templeton’s success in glowing terms, and was one of his most fervent supporters, at one point published a cover article questioning whether the great John Templeton had lost his way (“Has the King Fallen Off the Mountain?” it asked). Hindsight tells us, however, that this was exactly the moment to have put money back into the fund, as the fund subsequently produced one of its best periods of performance—evidence of the old saying that, in investment, just as in sport, form may be temporary, but class is permanent.
Most of the time in investment, higher returns imply higher risk. This was emphatically not the case with the Templeton Growth Fund. Not only did the fund consistently produce higher returns than the MSCI World Index, it did so with less—rather than more—risk than the stock market as a whole, as standard finance theory would suggest should have been the case. Explaining why this was so shows up some of the dangers in applying simplistic statistical tests to fund performance data.
The standard way in which fund analysts compare the risk of competing funds is by comparing the volatility, or standard deviation from the mean, of their monthly returns. On this measure, taken in isolation, there is little difference between the performance of the Templeton Growth Fund and the MSCI World Index. Over the period 1954 to 1992 the standard deviation of the fund’s monthly returns was in fact slightly higher (at 2.94 percent) than that of the World Index (2.70 percent). The same was true with its 12-month returns. On this narrow measure, therefore, while the fund clearly produced more return per unit of risk, it could not be described as being less risky.
The problem, however, as finance theorists themselves now concede, is that volatility is far from a perfect measure of the risk that faces investors. Citing a standard deviation figure gives an indication of how variable the returns from a fund have been, but it cannot distinguish whether the divergence of those returns from the average has been mainly positive, or mainly negative. In statistical terms, we can say that it relies on the assumption that a fund’s returns follow a normal (bell curve) distribution, with an equal number of observations on either side of the average.
While that is roughly, though not precisely, true of the world stock market index, it is certainly not an accurate description of how the Templeton Growth Fund performed. John Templeton’s genius as a professional investor was to discover and then put into practice an investment approach which ensured that his fund produced significantly more above-average returns than it did below-average returns.18 This had the important consequence of reducing the likelihood that the fund’s investors would experience losses.
The simplest way to see this is to compare the distribution of average monthly returns from the fund with that of the World Index over the 38-year period (see Figure 3.8). Plotted as a histogram, it clearly shows (1) how the fund’s returns were more narrowly bunched around their long-term average than those of the World Index, and (2) how the number of above average returns was disproportionately greater than the number of below average returns.
Figure 3.8 Monthly Returns and MSCI World Index Distribution
Plotting the distribution of the monthly returns of the Templeton Growth Fund and comparing them to those of a world equity index underlines how consistently the fund produced more positive returns—reflected in the strong bias to the right-hand side of the chart.
Source: A. G. Nairn and M. F. Scott, “A Data Study of Historic Returns in World Stock Markets 1953–1996” (Templeton Working Paper, 1996).
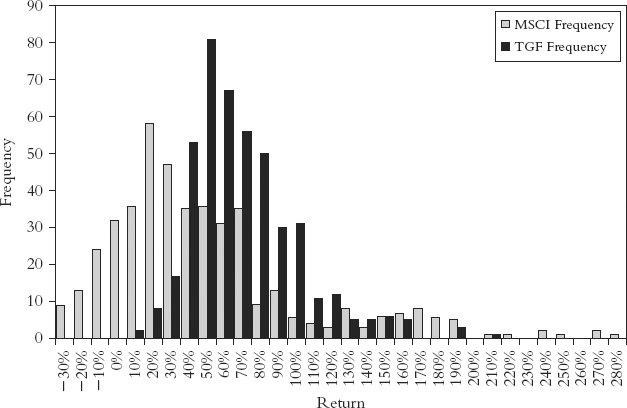
The corollary to this, as the chart also shows, is that there were also periods when the Templeton Growth Fund failed to keep pace with a rising world market. There are fewer data points to the extreme right of the graph for the fund than for the index. So, for example, the best five-year real return that the fund achieved was a gain of 205 percent in the 60 months ending in August 1986. During this period, one of the strongest five-year periods of all time in stock market history, the MSCI World Index rose by an even more remarkable 286 percent. As we have seen, there are good reasons why the fund tended to outperform during the strongest bull markets, just as there are good reasons for its consistently above average performance during bear markets.
As already noted, the Templeton Growth Fund was prevented by the terms of its mandate from using debt to leverage its returns. While the use of debt increases the potential scope of returns, it also significantly increases the risk of significant loss for investors. John Templeton himself retained a lifelong aversion to the use of debt for investment purposes and counseled most investors against borrowing for the purposes of stock market speculation. If he had been able to use leverage, the fund’s returns would have been even higher over time, but so too would have been its losses in the down periods that it did experience from time to time.
The most important point to emphasize, though, is that the periods when the TGF underperformed the market were generally those when the fund was already itself making very good positive returns. The periods when it outperformed the market were typically those when the market was suffering much greater losses. It was this bias against absolute losses—the fact that the fund never lost money over any 60-month period—which is the truly distinguishing feature of John Templeton’s record as a fund manager. This track record can be traced directly to the valuation and stock selection discipline on which Templeton insisted at all times. His mantra, “only buy cheap stocks,” may have cost his fund some performance in bull markets, but it more than earned its keep during bear markets.
As most investors know, the stock market moves through distinct phases when share prices are generally either rising (a bull market) or falling (a bear market). In Tables 3.6 and 3.7, we list the main bull and bear markets that occurred during the period in which John Templeton was responsible for managing the fund, and compare the movement of the world stock market index with that of the performance of the Templeton Growth Fund. Some interesting conclusions quickly become apparent from these figures.
Table 3.6 Templeton Growth Fund: Nominal and Real Returns during Bull and Bear Markets
Source: (i) A. G. Nairn and M. F. Scott, “A Data Study of Historic Returns in World Stock Markets 1953—1996” (Templeton Working Paper, 1996); (ii) Datastream/ICV.
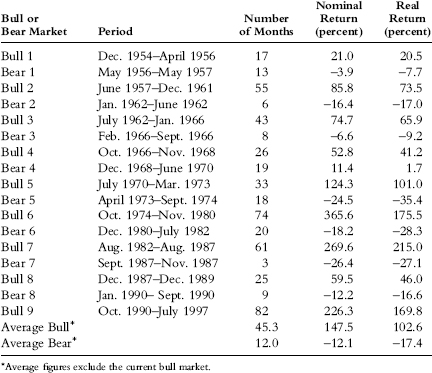
Table 3.7 MSCI World Index: Nominal and Real Returns during Bull and Bear Markets, 1954 to 1997
Source: (i) A. G. Nairn and M. F. Scott, “A Data Study of Historic Returns in World Stock Markets 1953—1997” (Templeton Working Paper, 1997); (ii) Datastream/ICV.
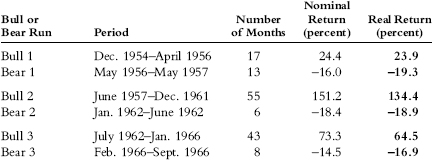
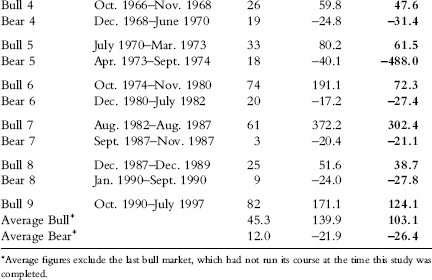
Almost all the Templeton Growth Fund’s outperformance, our analysis shows, came during bear markets. When stock markets started what proved to be a substantial decline, the fund either fell less sharply, or continued to produce positive returns. On average during bear markets, the fund lost money, but on a much less dramatic scale than the market as a whole—minus 12 percent against minus 21 percent. This is an important and significant difference. A fund that has fallen by 20 percent has to recover by 25 percent to regain its former level: One that has lost 12 percent needs to recover by 14 percent to do the same. Bear markets, in other words, unless anticipated, can be serious destroyers of wealth. At all other times, however, while the fund still outperformed the market over five-year periods, the difference was slight. In fact, we can establish no statistically significant degree of under or over performance relative to the world stock market index during bull markets. What is clear, however, is that during the strongest bull markets, and especially during periods of market euphoria, there was an observable tendency for the Templeton Growth Fund to underperform. This feature is characteristic of investors who follow a value approach, and is discussed further in Chapter 5. The Templeton fund’s record supports his contention that the biggest risk investors face is overpaying for what they own.
Table 3.5 Historic Events During John Templeton’s Fund Management Career
| 1950s | |
| •Budapest uprising, 1956 •War of Algerian Independence with France, 1954–1962 |
•Suez Middle East crisis; Nasser blockades the Suez Canal, 1956 |
| 1960s | |
| • Sharpeville massacre in South Africa, 1960 • Fidel Castro and Cuban Missile Crisis, 1962 • Civil rights; Martin Luther King leads march on Washington, 1963 • Kennedy’s assassination, 1963 • 525,000 U.S. combat troops in Vietnam by end of 1967 • Prague Spring, August 1968 |
• Cultural Revolution, China, 1966–1969 • Neil Armstrong walks on the moon, 1969 • Ending of white rule in Africa Independence Nigeria, 1960 Botswana, 1966 Chad, 1960 Mozambique, 1975 Algeria, 1962 Angola, 1975 Kenya, 1963 |
| 1970s | |
| • Kent State University shootings, 1970 • Nixon visits Beijing, 1972 • Yom Kippur War → oil shock, 1973 • General Pinochet coup, Chile, 1973 • Nixon resigns, Watergate, 1974 • Israel/Egypt peace, Camp David accords, 1978 |
• Gough Whitlam dismissed by British Governor General, 1975, Australian constitutional crisis • Pol Pot plunges Cambodia into the Killing Fields, 1975 • Margaret Thatcher elected, 1979 |
| 1980s and 1990s | |
| • Lech Walesa, Gdansk shipyards strike, world watches Soviet response, 1980 • Soviet Army invades Afghanistan, U.S. boycott of Olympics, 1980 • Falkland Islands invaded by Argentina, 1982 • Famine in Ethiopia, 1984 • French agents sink Greenpeace ship, Rainbow Warrior, New Zealand, 1985 • Chernobyl, 1986 • United States strikes Libya in retaliation for sponsoring terrorists, 1986 • Nuclear arms reduction treaty, Gorbachev and Reagan, 1987 • Gorbachev reforms Soviet Union, introduces Perestroika and Glasnost |
• Burmese opposition leader Aung San Sun Kyi placed under house arrest, 1989 • Berlin Wall falls, 1989 • Tiananmen Square killings, China, 1989 • Nelson Mandela released from prison, 1990; South Africa gets new constitution, Mandela elected president • USSR dissolves, becomes the CIS, 1991 • President Bush declares war on drugs, billions spent on stopping drug imports • Bosnia conflict, 1992–1995 • Gulf War, 1990–1991 • First baby boomer president elected, 1992 |
The Templeton Growth Fund weathered many global storms in 38 years.
The relative and absolute performance of the Templeton Growth Fund over the time that John Templeton was directly responsible for it is shown in Figures 3.9 and 3.10. The first chart shows the absolute returns of the fund and a world equity index (the MSCI World Index from 1974, our proxy before that). The dashed line measures the amount of money an investor in the fund made in every discrete five-year period, after allowing for the impact of inflation. As can be seen, only on two occasions did this real return fall below 50 percent. In the best periods the gain was typically more than 200 percent. By contrast, the MSCI World Index, measured by the solid line, produced smaller returns for most of the time, and on more than one occasion produced nothing at all by way of a real return.
Figure 3.9 Templeton Growth Fund and MSCI World Index: Five-Year Rolling Returns
The greatest strength of the Templeton Growth Fund in John Templeton’s hands was that its periods of underperformance typically came when the markets generally were doing well—something that was more than compensated for by his outperforming when the markets generally were weak. As a result the fund’s investors never once failed to generate a positive real return over any five-year period while he was in charge.
Source: Nairn and Scott (1997).
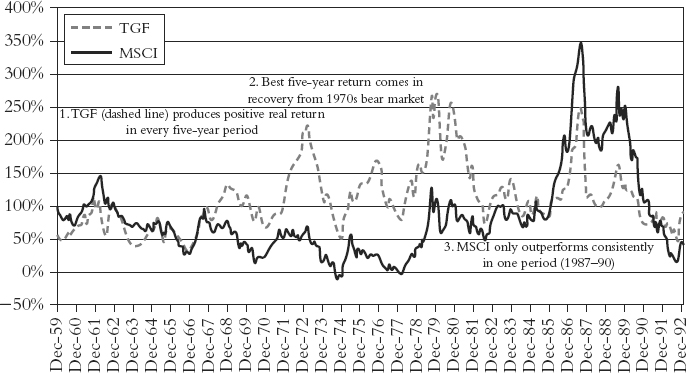
Figure 3.10 Templeton Performance Relative to MSCI
The relative performance of the Templeton Growth Fund against world equity index ebbed and flowed over time. The worst period of underperformance came in the late 1980s when the Japanese stock market, which Templeton had long since abandoned, went on getting more and more expensive; fortunately the U.S. stock market was also booming, so the fund’s investors were still making good absolute returns.
Source: Nairn and Scott (1997).
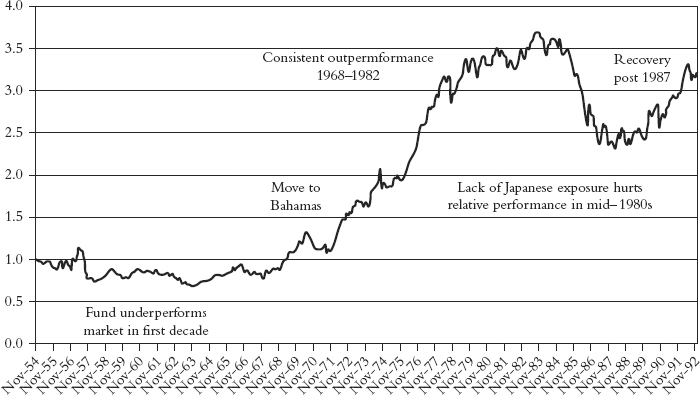
The second chart, Figure 3.10, recasts these two series as a single line, obtained by dividing the performance of the Templeton Growth Fund by the performance of the world index. This line therefore shows the relative performance of the two. When the line is rising, it shows that the fund is outperforming the market, and when it is falling, the reverse is the case. A number of interesting conclusions can be drawn from these two sets of data.
The first is that for the first 10 years of its life, while its performance was good, the fund in fact failed to outperform the MSCI World Index, or its equivalent. As we have seen, Templeton himself noted that his performance improved substantially when he left New York in the late 1960s in order to set up home at Lyford Cay in the Bahamas, then a British colony. The data confirms that this was indeed the case. The years between 1969 and 1992 produced better returns for the fund than before or afterward. See Table 3.8.
Table 3.8 Templeton Growth Fund, 1954 to 2003
Source: Nairn and Scott (1997).

Secondly, it is evident from Figure 3.10 how badly the fund underperformed in the world market index in the second half of the 1980s. This, as we have seen, was the period during which Templeton reduced his significant holdings in Japanese stocks and increased his holdings in the United States, which he believed (and said publicly) was poised for a multiyear bull market. He was right, but his timing for this move proved to be way too early, as the Japanese market continued to rise strongly until it peaked at the end of 1989, several years after Templeton had reduced his holdings in Japan to a minimal level.
One consequence of this was that the Japanese stock market’s share by value of the world index remained at more than 40 percent throughout this period, making it virtually impossible for any professional investor without a large holding in Japanese equities to beat the index. The stocks that Templeton was buying in the United States were materially cheaper than their equivalents in the Japanese market, and indeed performed very strongly. Japanese shares continued to power ahead even faster, however, taking the Tokyo market to an all-time peak in 1989, an absurdly inflated level from which it has still, more than 20 years later, to recover. During the second half of the 1980s, the Japanese stock market was trading on a P/E ratio of more than 60, which was at least four times the equivalent rating for the U.S. stock market. At the worst point, the Templeton Growth Fund was lagging the world index by more than 100 percent over five years. Investors in the fund were, however, still receiving good portfolio returns. It was just that the world index, inflated by the Japanese bubble, was doing even better. When the bubble burst, Templeton’s investors had good reason to be grateful for their manager’s conservatism. At the time, though, many were not slow to complain.
To sum up, therefore, we can clearly see that the performance of the fund was indeed exceptional. The risk of losing money in either nominal or real terms for any investor prepared to hold the fund for five years was, in practice, nonexistent. More notable still was that it improved rather than deteriorated over time, and for many years, under Templeton’s personal stewardship, proved immune to the normal phenomenon in the fund world that popularity is inimical to continued good performance. Closer analysis shows that almost all its outperformance came during bear markets, when its losses were smaller than those of the market as a whole. This in turn reflected the fact that Templeton’s understanding of what constitutes risk in investment was deeper and more profound than that encapsulated in the analytical tools widely adopted in modern investment practice.
Notes
1. John Train, Money Masters of Our Time (New York: HarperCollins, 2000), 53.
2. Private conversation. March 2011.
3. Lewis J. Rolland, “Investment Background,” in Financial World, 1959.
4. It was not until the passing of the ERISA legislation in 1974 that U.S. pension funds and other types of professional investment institutions were permitted to invest in overseas stocks.
5. Shares in the fund could still be purchased by U.S. citizens from existing shareholders in the fund, provided the seller could produce a Certificate of American Ownership.
6. Templeton letter, December 12, 1961.
7. See, for example, William Proctor, The Templeton Prizes, 73.
8. Proctor, The Templeton Prizes, 73.
9. This period in Wall Street history has been well covered in books such as The Go-Go Years, by John Brookes, and The Money Game by George Goodman, writing under the pseudonym Adam Smith.
10. At Galbraith’s suggestion, the fund had been split in two in the 1980s, with 58 percent of the assets going into a new U.S. fund of the same name, and the remainder staying in the original Canadian entity.
11. This research was initially published as a Templeton Working Paper by A. G. Nairn and M. F. Scott (1997, updated 2003), “A Data Study of Historic Returns in World Stock Markets 1953–1997,” subsequently “1953–2003.”
12. Interview with Mark Holowesko, June 2003.
13. Most performance analyses use the MSCI World Index as a proxy for the performance of the world’s stock markets. Unfortunately, the MSCI index only dates back to 1988; for the proxies we have used for earlier years, and more technical details about the analysis. See Nairn and Scott, op.cit.
14. Those who can claim to have outperformed by an even greater margin over such a long period include Warren Buffett and George Soros, but their investment vehicles are not directly comparable, since both use financial or operational leverage to enhance returns, something that the Templeton Growth Fund, like most mutual funds, was prohibited from doing. Celebrated stock pickers, such as Peter Lynch of Fidelity, may have produced greater margins of outperformance in some of their funds, but managed money for much shorter periods.
15. It was not until the 1970s that investors were first able to acquire an index fund, enabling them to hold all the shares of a market index in a single tradable entity.
16. These figures measure the geometric rate of return from the fund and index, and consequently they are slightly lower than the average annual return figures (16.0 percent and 12.3 percent respectively) mentioned earlier.
17. These figures are calculated on a pre-tax basis. One of the genuine advantages of mutual funds is that tax on any capital gains that the fund makes is only payable when the fund is sold (redeemed).
18. In statistical jargon, the returns from the fund can be said to follow a log-normal, not a normal distribution.