To experiment with test life cycles, we need a way to go beyond test results. We’ll need to examine detailed test logs, the information the tests write to the console output. Let’s go over how to see these logs.
Add a second test, test_methodTwo, that invokes methodTwo:
| | func test_methodTwo() { |
| | let sut = MyClass() |
| | |
| | sut.methodTwo() |
| | |
| | // Normally, assert something |
| | } |
With two tests in our suite, press ⌘-U to run tests. Then let’s go find the log so we can read the nitty-gritty details of this test run.
You can see the console output of the latest run by going to the Xcode menu and selecting View ▶ Debug Area ▶ Activate Console. But we can do one better.
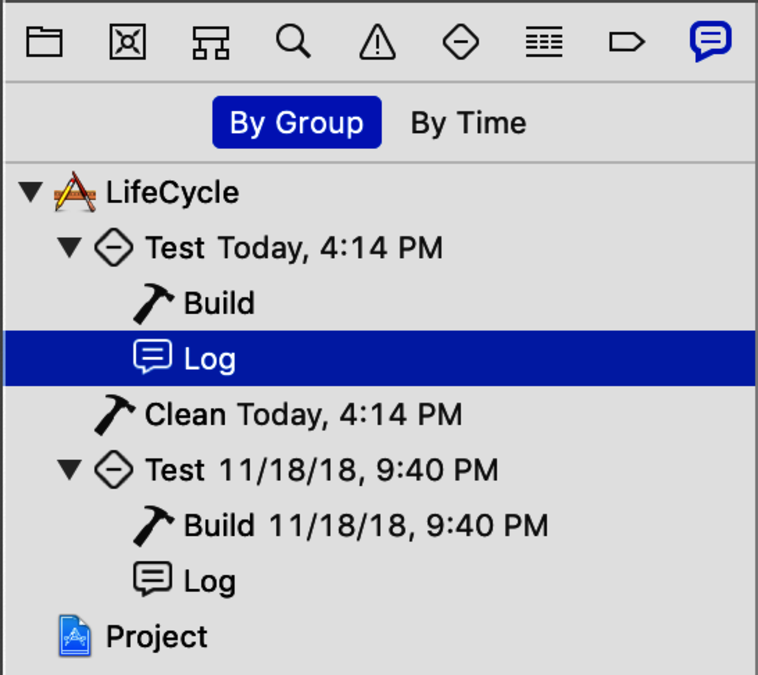
In the Xcode menu, select View ▶ Navigators ▶ Show Report Navigator (or press ⌘-9). The Navigator column on the left will show a history of recent activity. Find the latest test run and click on its log. It will look something like this:
This allows us to see not only the latest output, but also any recent test run (and other activities).
In the central panel, select the “All Messages” filters at the top. Then select the line that says, “Run test suite All tests.” A log icon will appear on the right side, as shown in the image.
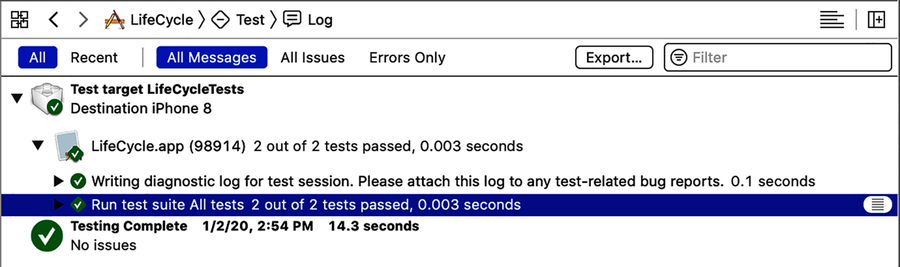
Click this icon to reveal the transcript. It will look something like this:
| | Test Suite 'All tests' started at 2019-06-22 19:08:40.422 |
| | Test Suite 'LifeCycleTests.xctest' started at 2019-06-22 19:08:40.422 |
| | Test Suite 'MyClassTests' started at 2019-06-22 19:08:40.423 |
| | Test Case '-[LifeCycleTests.MyClassTests test_methodOne]' started. |
| | >> methodOne |
| | Test Case '-[LifeCycleTests.MyClassTests test_methodOne]' passed |
| | (0.002 seconds). |
| | Test Case '-[LifeCycleTests.MyClassTests test_methodTwo]' started. |
| | >> methodTwo |
| | Test Case '-[LifeCycleTests.MyClassTests test_methodTwo]' passed |
| | (0.000 seconds). |
| | Test Suite 'MyClassTests' passed at 2019-06-22 19:08:40.426. |
| | Executed 2 tests, with 0 failures (0 unexpected) in 0.002 (0.003) |
| | seconds |
| | Test Suite 'LifeCycleTests.xctest' passed at 2019-06-22 19:08:40.426. |
| | Executed 2 tests, with 0 failures (0 unexpected) in 0.002 (0.004) |
| | seconds |
| | Test Suite 'All tests' passed at 2019-06-22 19:08:40.426. |
| | Executed 2 tests, with 0 failures (0 unexpected) in 0.002 (0.005) |
| | seconds |
What does this show? First, that we have several test suites. Like Russian dolls, each suite contains another one, until we reach MyClassTests.
Within MyClassTests, we have our two test cases. Don’t be afraid of the funny notation:
| | -[LifeCycleTests.MyClassTests test_methodOne] |
That’s in the style of Objective-C logging. The minus sign indicates a message to an instance. The square brackets show the message, with the recipient on the left and the content on the right.
So first we see that test_methodOne started. The transcript shows any output, especially messages from failed assertions. In our case, it shows the output from the print(_:) statement, showing that the test successfully ran methodOne. Then it reports whether the test passed or failed, along with the time it took.
We get a similar report for test_methodTwo. Then counts of how many tests passed or failed bubble up to each test suite level.
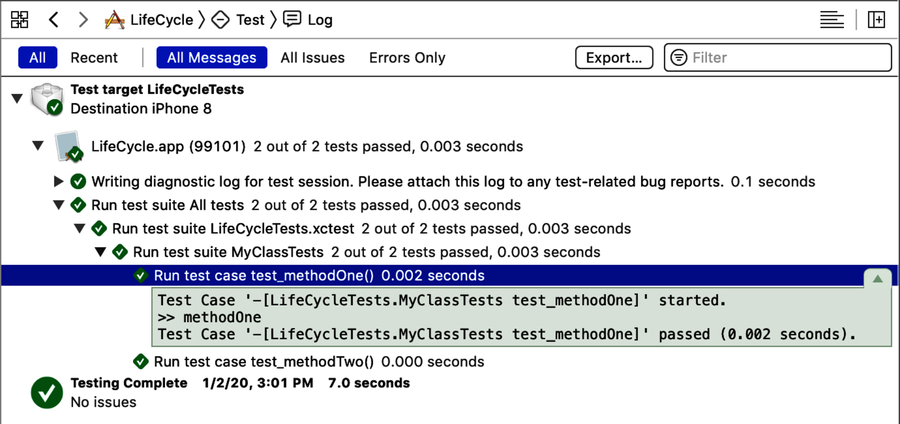
We can also look at the output for individual tests only. Click the up arrow on the right side to collapse the “All tests” transcript. Then option-click the disclosure triangle to the left of “Run test suite All tests.” A regular click will expand one level, while an option-click expands all levels. Click on a test case to reveal the log icon, or hover your mouse along the right until it appears. Then click the log icon at this level to see the transcript for a single test case, like this:
Let’s review this method of examining reports. In the Navigator column, we can select which report we want to examine. For that report, we can filter by the following options:
Then, by using the disclosure triangles, we can select how much of the transcript we want to see—even down to individual test cases. So while you can view the full console output of the latest run, the Report Navigator offers history and granularity. Choose whichever works best for your needs.
Now we’re ready to run experiments to learn about object management. First, we’ll see how tests have separate phases and how this relates to objects being created and destroyed. Then, we’ll try a common Swift approach to properties in XCTestCase and observe how it breaks the object management rules. We’ll learn how XCTest actually manages test cases in memory. Finally, we’ll fix the problem by using the setUp and tearDown methods.