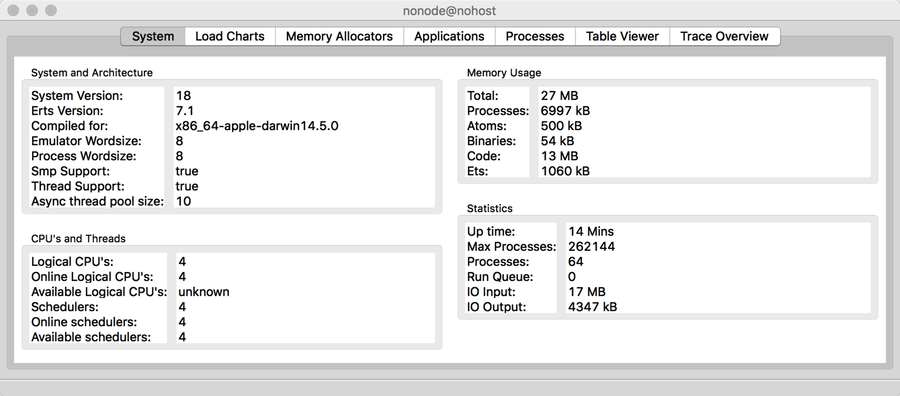
Basic system information:
As you might expect from a platform that has been running demanding and critical applications for 20 years, Erlang has great server-monitoring tools.
One of the easiest to use is already baked in. Inside IEx, run
| | iex> :observer.start() |
Use this to get insight into…
Basic system information:

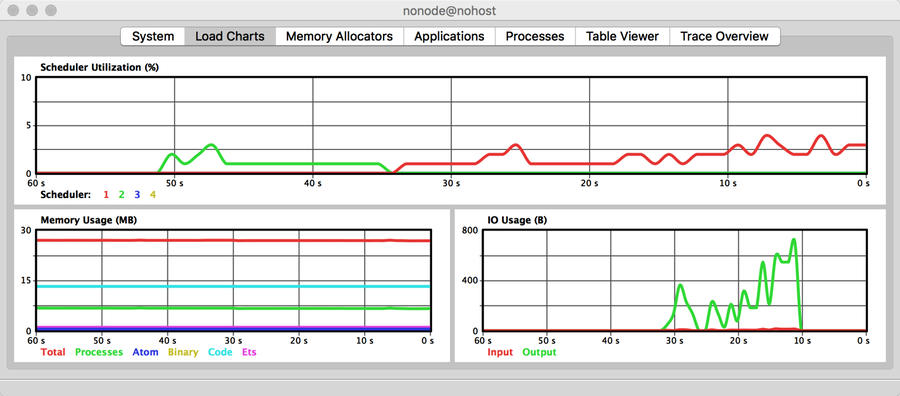
Dynamic charts of load:
Information and contents of Erlang ETS tables:

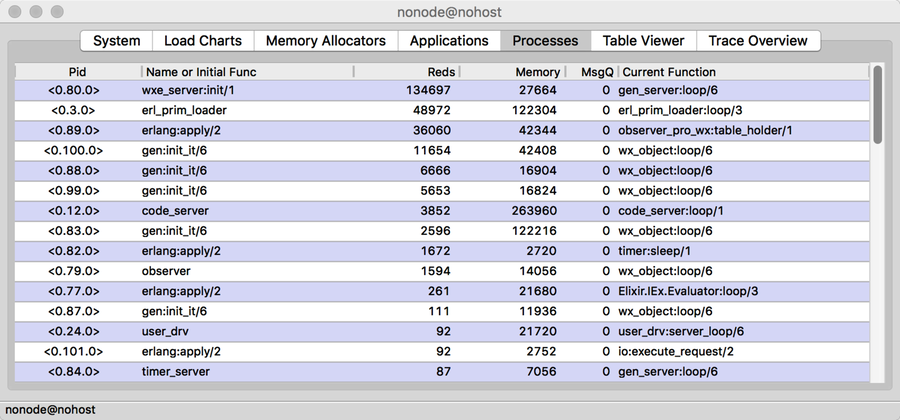
Running processes:
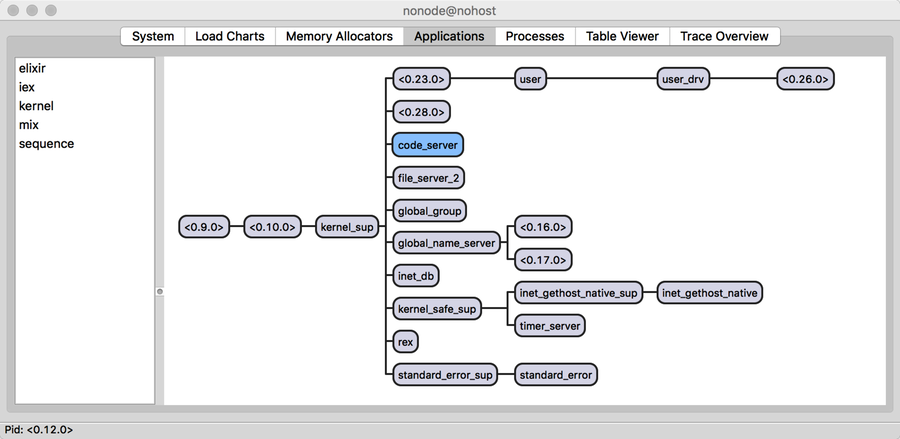
Running applications:
Memory allocation:
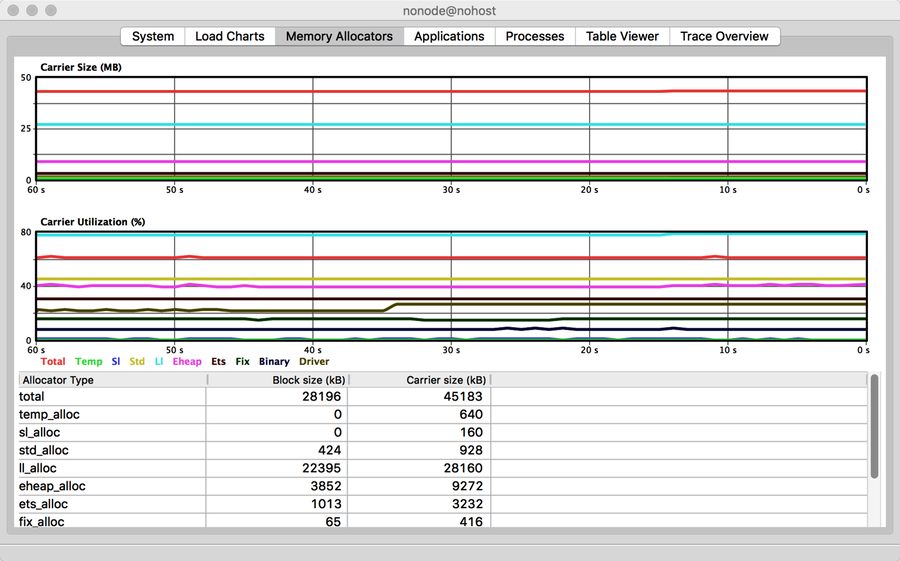
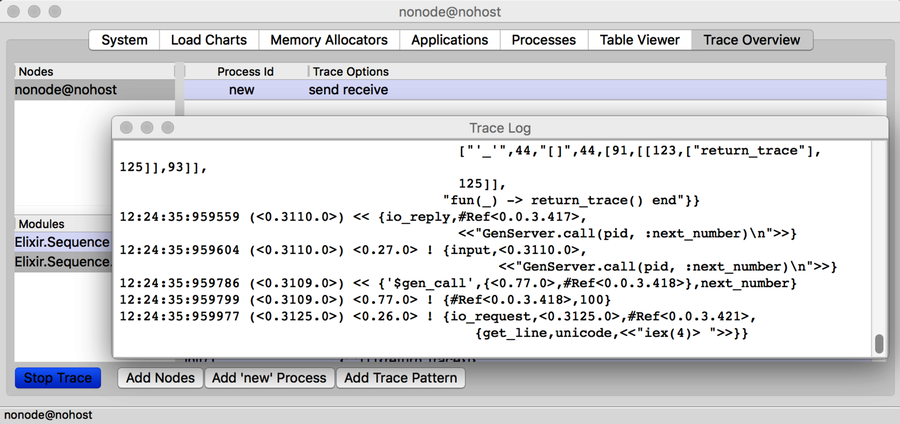
And tracing of function calls, messages, and events:
For application-level monitoring, you might want to look at Elixometer from Pinterest.[31]