1 Introduction
A botnet is a group of devices called bots interconnected over the Internet that have been compromised via malicious software [1, 2]. These devices can be computers, mobile devices [3], and even Internet of things (IoT) devices [4], which are remotely accessible by the intruder [5]. Among the many reasons botnets are created for, the most representative ones are launching distributed denial of service (DDOS) attacks [6], phishing and ransomware distribution [7], identity theft, or using the powerful computational resources of the network on a wide range of malicious distributed tasks [8]. Although botnets have been on the rise for about two decades [9], they still represent one of the biggest challenges that security researchers and analysts must face [10]. The economic lost caused by the breach of digital networks rise as much as several millions of dollars every year [11].
Several types of research on botnets detection techniques have been developed based on different botnets characteristics, including their communication protocols (HTTP, P2P, IRC, etc.) [12], target platforms [13] and size of the botnet [14, 15]. These approaches have provided cybersecurity analysts with resources like network tracing and packet capturing tools for detecting and mitigating botnet attacks [16]. However, even though these techniques have helped to prevent several attacks, many researchers on the field have continued being carried out due to the non-stoppable increment of botnets attacks, originating especially from IoT devices [17, 18].
The study of botnets is a domain of analysis and investigation of botnet features to come up with new approaches to prevent, detect and react to botnet attacks [19]. In this respect, it is worth mentioning that the achievements obtained from research in this domain are significant as can be seen for example in studies such as [11] botnet detection using big data analytics framework or [20, 21] which explain machine learning approaches for identifying a botnet in a network with dynamic adaptation. Nevertheless, despite the considerable number of articles being published on this subject, as far as we know there is not yet a bibliometric article that reports on the research impacts and trends of such investigations.
Bibliometric methods carry out bibliographic overviews of scientific makings or selections of publications widely cited on patents, thesis, books, journal articles and conference papers to supply a quantitative analysis of publications written on a specific domain [22, 23]. This method has the potential to discover emergent and highest-impact subfields, as well as following the trend over extended periods of time within many areas.
This paper aims to present an exhaustive assessment of botnet detection research practices published from 2009 to 2018 indexed by Web of Science (WoS) with the purpose of demonstrating the growth of botnet detection research. To do this, we have analyzed research topics and publication patterns on botnet detection having in mind the following research questions: (a) What is the trending in publications about botnet detection study? (b) How does this trend help to identify the future course of botnet detection study?
This paper is organized as follows. Section 2 presents the research methodology. Section 3 exposes the findings and gives information on botnet detection studies. Section 4 discuss challenges and future trend of botnet detection study. Section 5 gives the conclusion to the research.
2 Methodology
Bibliometrics is the utilization of quantitative analysis and figures to publications, for instance, journal articles and their running with reference checks. Quantitative appraisal of publications and reference data is presently utilized as a part of all countries around the world [24]. Bibliometrics is used as a piece of research execution assessment, especially in school and government labs, and by policymakers, administrators, information experts and researchers themselves [9]. It includes the estimation of information not necessarily for the content but the amount of information on the particular area of research [11] and it can be divided into two parts by the researcher which include publication analysis and general instructions [25]. Publication analysis talks about the assessment of publication, for example, references, impact factor and publishers. This method has been used for many publications while for general instructions, the researcher briefs readers about how to seek great articles by utilizing search engines to maintain a strategic distance from possible errors in the search process [11].
For successful writing of this research paper, a few techniques were utilized to get the publications and it starts by utilizing “Botnet Detection Techniques” as the fundamental keyword. The keyword is critical because it offers the exact data for the research topic and does not drift from the topic [26]. We used both automatic and manual pursuit technique to break down the recovered publications. A scan for related publications ordered in the Web of Science database confines the search to the previous 10 years i.e. between 2009 and 2018. Thus, we distinguished a total of 341 publications from which are conference papers, book reviews, and articles.
- 1.
Authors,
- 2.
Highly cited articles,
- 3.
Research areas,
- 4.
High efficiency/Productivity,
- 5.
Keyword recurrence,
- 6.
High Impact journals
- 7.
Institutions.

Flowchart showing the analysis of the publication
There are numerous databases used to list articles and other publications, for example, IEEE Explore, Springer, Elsevier’s Scopus, Google Scholar, Science Direct, Association for Computing Machinery (ACM). The three (3) principle Bibliometrics data source for searching literature and other texts are Google Scholar, WoS and Elsevier’s Scopus. These information sources are normally used to class journals as far as their productivity and the total references got to show the journals influence or impact.
In this paper, Web of Science (WoS) was used as the primary search engine. The WoS database was the first bibliometric analysis tool and other search engines were indexed in WoS. The WoS Database is a product of “Thomson Reuters Institute of Scientific Information” and it contains more than 12,000 titles of diaries from multidisciplinary regions. The database offers effective searching and browsing options by enabling many options to help filter out results. Furthermore, the WoS database is additionally able to sort the publications based on parameters like date of publication, highest cited, newest publications, usage count, authors name, and relevance. In addition, refining the outcomes in the ISI Web of Science database likewise empowered certain outcomes to be excluded by type of documents, years, continents, countries authors and institution. Added to that is its capacity to give vital data like quartile, impact factor and citation counts, this made the research easier and more conducive.
3 Findings
This section talks about the finding of the topics that are related to botnet detection. This section is classified into seven sub-points which are productivity, research areas, institutions, writers, impact factor, highly-cited articles and keyword frequency. These discoveries are vital because they demonstrate the publishing rates with bibliometric information. In Addition, it is able to disentangle leading edge research that supports the production of knowledge and to guarantee that the interest in botnet is more extensive than it sounds.
Distribution of research based on continent
Continent | Publications (%) |
|---|---|
Asia | 47.421 |
North America | 32.99 |
Europe | 20.10 |
Australia | 2.577 |
Africa | 2.062 |
South America | 1.031 |
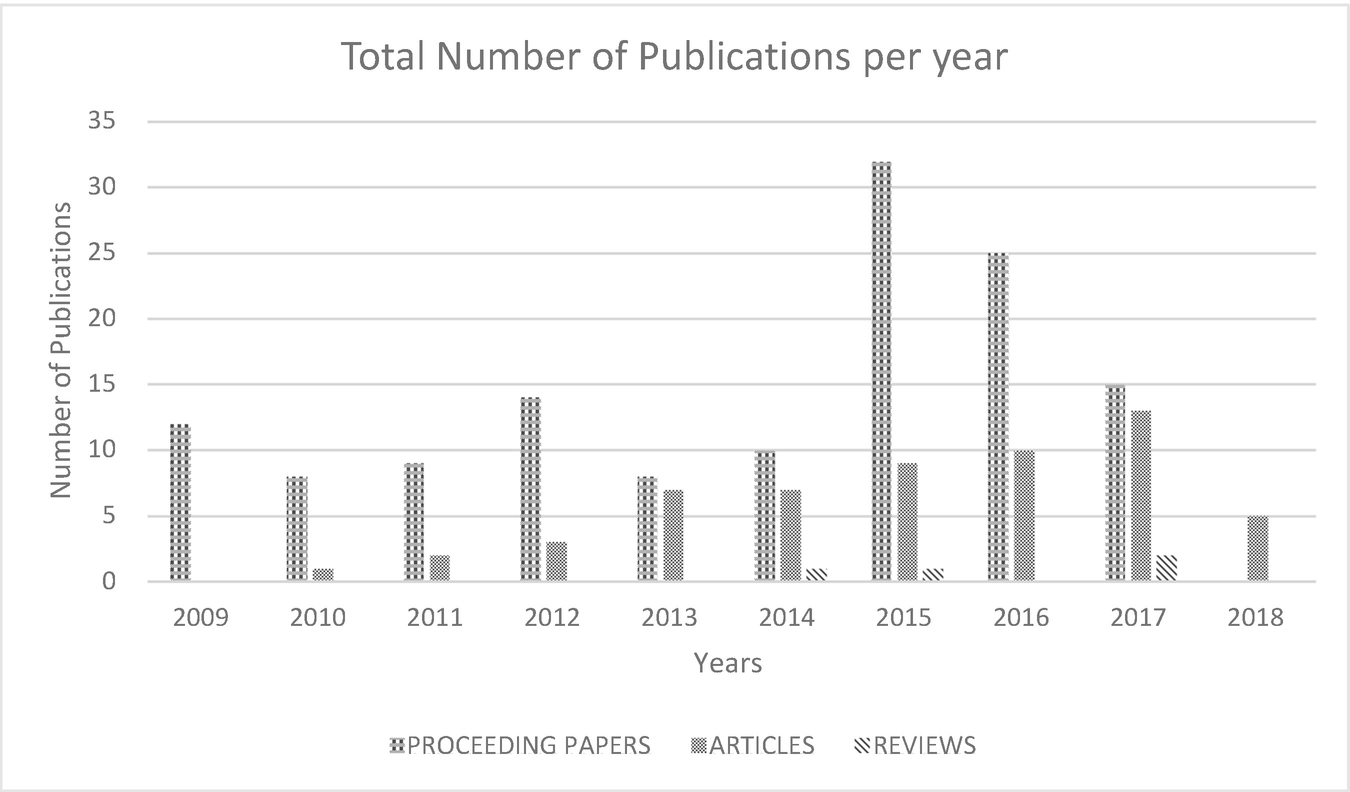
Total number of publications per year
Yearly number of publications
2009 | 2010 | 2011 | 2012 | 2013 | 2014 | 2015 | 2016 | 2017 | 2018 | |
|---|---|---|---|---|---|---|---|---|---|---|
Proceedings | 12 | 8 | 9 | 14 | 8 | 10 | 32 | 25 | 15 | 0 |
Articles | 0 | 1 | 2 | 3 | 7 | 7 | 9 | 10 | 13 | 5 |
Reviews | 0 | 0 | 0 | 0 | 0 | 1 | 1 | 0 | 2 | 0 |
Figure 2 indicates that since 2015, distribution of proceeding papers increased until 2017 then drastically reduced while articles and reviews are slightly increasing. This is likely because of a perceived reduction of botnet attacks. The publication peak year was 2015. This may have affected the publications to concentrate on more critical issues, thereby influencing the number of distributions in the next years. Following this, the increment of conference papers and articles can increase citations.
Citation analysis is utilized to evaluate the recurrence of the publications considering information extracted from the citation index. This is used to assess researchers’ performance in view of citation patterns, particularly for academic purposes. It additionally gives information about researchers to other researchers utilizing similar references while likewise giving an all-encompassing perspective of the topic under research.
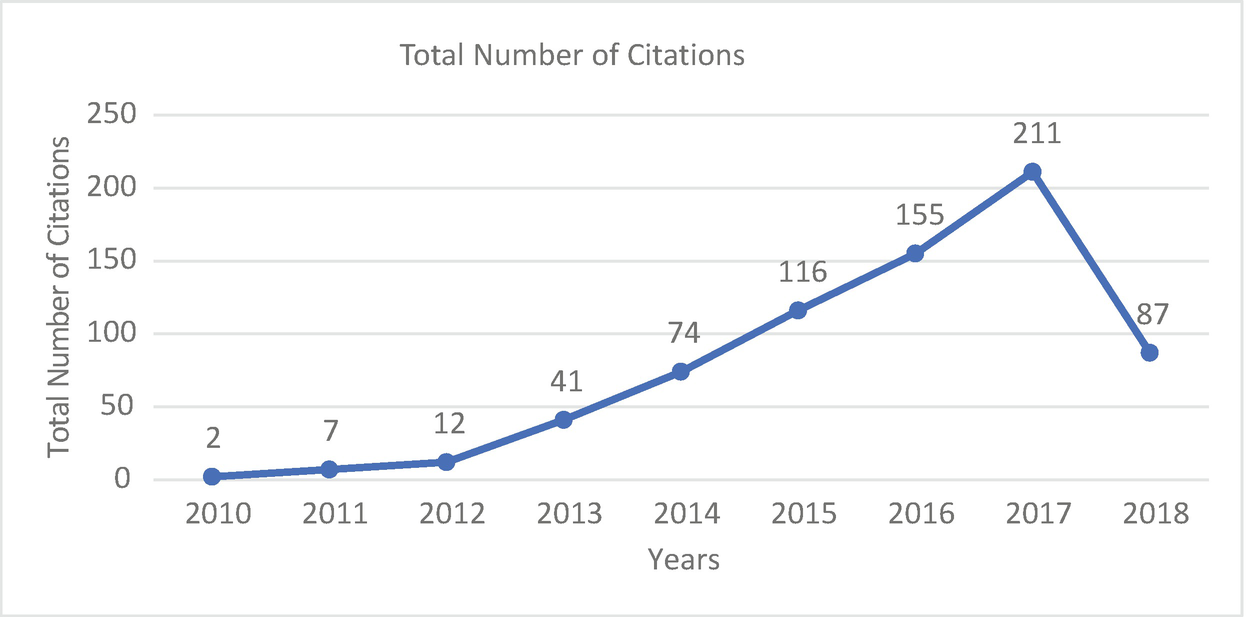
Total number of citations
The normal number of citations gathered by distributed articles is around 78.30% yearly amid the time of 2009–2018. The quantity of yearly references demonstrates a positive multiplication with three peak periods in 2015, 2016 and 2017. There has been an increase since 2012. There was a great increase of 28.57% from 2014 to 2015. 16.67% from 2015 to 2016 and 22.72% from 2016 to 2017 and drastic decrease of 81.81% till date. The references have been expanding from 2015 to 2017 compared to how it was from 2009 to 2013. This is potentially because, in 2013, there was a rise in researchers directing studies to comprehend and solve botnet attacks. Researchers referring to other researchers works had additionally brought about an expansion in the citation. This pattern represents a positive outcome until 2017.
3.1 Productivity of Continents
Productivity of countries and continents
List of continents | Number of articles | Percentage (%) |
|---|---|---|
Asia | 92 | 47.421 |
India | 29 | 14.948 |
China | 19 | 9.794 |
Taiwan | 8 | 4.124 |
Iran | 7 | 3.608 |
Japan | 5 | 2.577 |
Saudi Arabia | 5 | 2.577 |
South Korea | 10 | 5.155 |
Jordan | 3 | 1.546 |
Pakistan | 3 | 1.546 |
Vietnam | 3 | 1.546 |
North America | 64 | 32.99 |
Canada | 16 | 8.247 |
USA | 48 | 24.742 |
Europe | 39 | 20.10 |
Ukraine | 7 | 3.608 |
France | 5 | 2.577 |
England | 9 | 4.639 |
Italy | 4 | 2.062 |
Spain | 4 | 2.062 |
Czech Republic | 3 | 1.546 |
Poland | 3 | 1.546 |
Austria | 2 | 1.031 |
Germany | 2 | 1.031 |
Australia | 5 | 2.577 |
Australia | 5 | 2.577 |
Africa | 4 | 2.062 |
South Africa | 4 | 2.062 |
South America | 2 | 1.031 |
Brazil | 2 | 1.031 |
3.2 Research Areas
This section examines various productions including certain research areas. Research areas aim at building up a scientific understanding of research areas and how these challenge different regions in various segments of different industries. Research areas can be used to quantify the performance of a research depending on publication and reference rates. The performance of any research area demonstrates the pattern of the production in an interval. The Web of Science database contains a list of different disciplines. Some of these research areas include Engineering, Computer Science, Telecommunications, Automation Control Systems, Materials Science, Science and technology topics and others.
Research areas with the highest publications
Research areas | Publication | Publication (%) |
|---|---|---|
Computer Science | 173 | 81.991 |
Engineering | 97 | 45.97 |
Telecommunications | 64 | 30.332 |
Automation Control Systems | 9 | 4.265 |
Materials Science | 4 | 1.896 |
Science Technology Other Topics | 3 | 1.422 |
Business Economics | 2 | 0.948 |
Energy Fuels | 2 | 0.948 |
Physics | 2 | 0.948 |
Chemistry | 1 | 0.474 |
Environmental Sciences Ecology | 1 | 0.474 |
Government Law | 1 | 0.474 |
Information Science Library Science | 1 | 0.474 |
Mathematics | 1 | 0.474 |
Operations Research Management Science | 1 | 0.474 |
Robotics | 1 | 0.474 |
Programming, Website design, algorithms, artificial intelligence, machine learning, Big data analysis and processing, Data mining, Computer and network security are a portion of the sub-regions that go under the term of Computer Science and Engineering. Of the articles distributed, the best article with the most astounding reference in Computer Science zone was “Empirical Evaluation and New Design for Fighting Evolving Twitter Spammers” Since records on detecting botnets use computing and network security, penetration testing, programming, and machine learning.
Table 4 indicates distribution of papers in the computing field. It also demonstrates that most productions came generally from North America and Asia.
3.3 Institutions
Ranking of institutions based on relevant publications
Institutions | Publications | Publications (%) | Country |
|---|---|---|---|
Khmelnitsky National University | 7 | 3.608 | Ukraine |
Korea University | 6 | 3.093 | South Korea |
Dalhousie University | 5 | 2.577 | Canada |
PSG College Technology | 5 | 2.577 | India |
University of Malaya | 5 | 2.577 | Malaysia |
University of New Brunswick | 5 | 2.577 | Canada |
University of Texas System | 5 | 2.577 | United States |
King Saud University | 4 | 2.062 | Saudi Arabia |
Texas A&M University College Station | 4 | 2.062 | United States |
Texas A&M University System | 4 | 2.062 | United States |
Carnegie Mellon University | 3 | 1.546 | United States |
Keene State College | 3 | 1.546 | United States |
Los Alamos National Laboratory | 3 | 1.546 | United States |
Southeast University China | 3 | 1.546 | China |
Tuyhoa Industrial College | 3 | 1.546 | China |
United States Department of Energy Doe | 3 | 1.546 | United States |
University Sains Malaysia | 3 | 1.546 | Malaysia |
Universiti Technology Malaysia | 3 | 1.546 | Malaysia |
University of Electronic Science Technology of China | 3 | 1.546 | China |
University Of North Carolina | 3 | 1.546 | United States |
University of Pretoria | 3 | 1.546 | South Africa |
The University of Texas At San Antonio USA | 3 | 1.546 | United States |
University System Of New Hampshire | 3 | 1.546 | United States |
UTP University of Science Technology | 3 | 1.546 | Poland |
Al Balqa Applied University | 2 | 1.031 | Jordan |
The proceeding five (5) institutions are from Asia and North America: Korea University, Dalhousie University, PSG Coll Technology, University of Malaya and University of New Brunswick. These institutions are situated in China and the United States respectively. It appears that the speed of distribution in China is considerably higher than alternate nations in Asia.
3.4 Authors
Ranking of authors based on relevant publications
Author | Publications | Publication (%) | Country |
|---|---|---|---|
Lysenko Sergii | 7 | 3.608 | Poland |
Savenko Oleg | 7 | 3.608 | Poland |
Kryshchuk Andrii | 6 | 3.093 | Poland |
Anitha R | 5 | 2.577 | India |
Lee Heejo | 5 | 2.577 | China |
Pomorova Oksana | 5 | 2.577 | United States |
Zincir-Heywood A Nur | 5 | 2.577 | France |
Bobrovnikova Kira | 4 | 2.062 | United States |
Haddadi Fariba | 4 | 2.062 | China |
Ghorbani Ali A. | 3 | 1.546 | United States |
Karim Ahmad | 3 | 1.546 | China |
Kozik Rafal | 3 | 1.546 | England |
Kumar Sanjiv | 3 | 1.546 | India |
Lee Jehyun | 3 | 1.546 | China |
Lu Wei | 3 | 1.546 | China |
Yan Guanhua | 3 | 1.546 | China |
Abadi Mahdi | 2 | 1.031 | Iraq |
Almomani Ammar | 2 | 1.031 | Jordan |
Alothman Basil | 2 | 1051 | England |
Alzahrani Abdullah J | 2 | 1.031 | Saudi Arabia |
Anuar Nor Badrul | 2 | 1.031 | Malaysia |
Bin Muhaya Fahad T | 2 | 1.031 | South Korea |
Butler Patrick | 2 | 1.031 | Spain |
Chen Chia-Mei | 2 | 1.031 | Malaysia |
Cheng Guang | 2 | 1.031 | China |
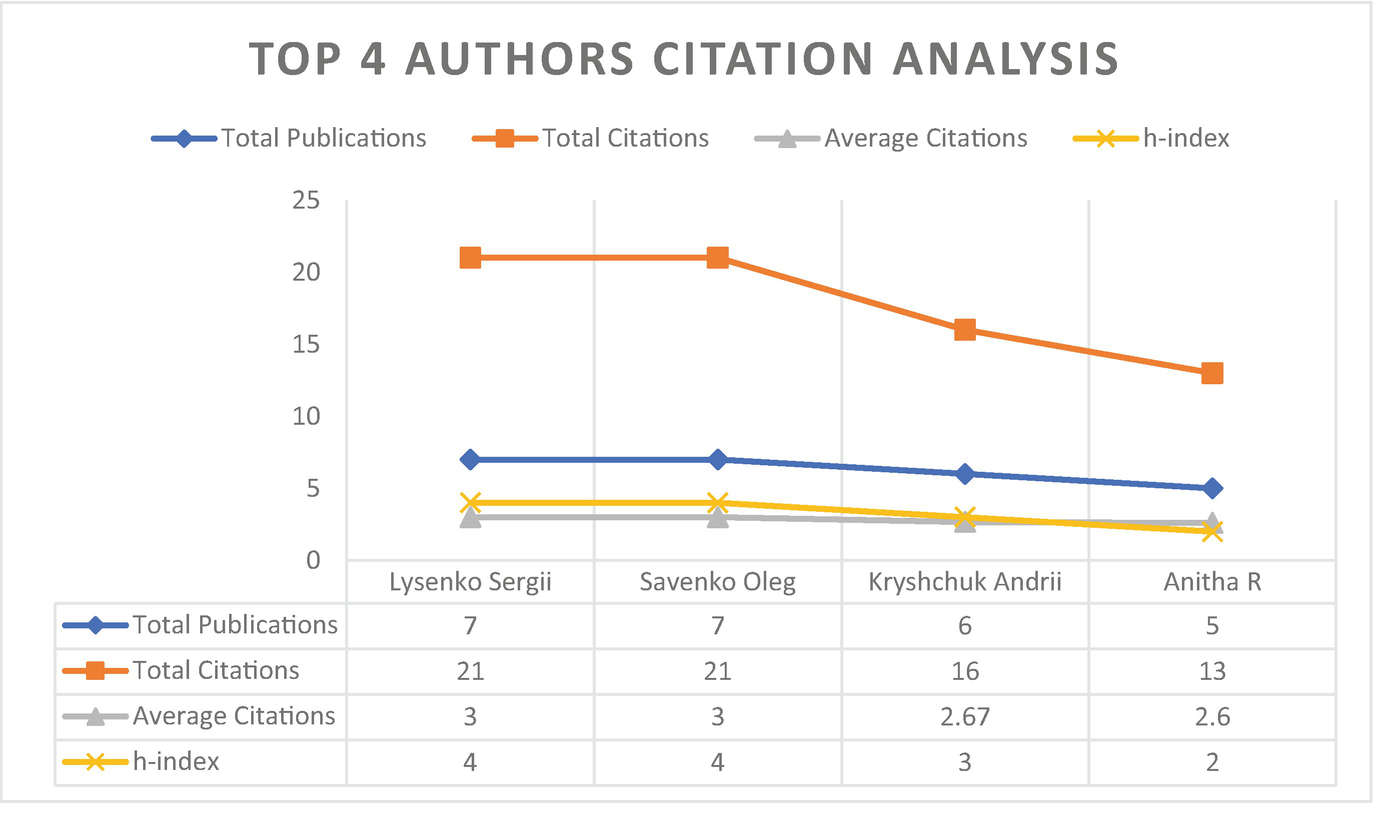
Citation count for the top four most productive authors
3.5 Highly Cited Articles
Top 25 highly cited articles
Title | Total citations | Published journal | Publication year | Research area |
|---|---|---|---|---|
A Survey of Botnet and Botnet Detection | 62 | 2009 Third International Conference on Emerging Security Information, Systems, and Technologies | 2009 | Computer Science |
Empirical Evaluation and New Design for Fighting Evolving Twitter Spammers | 50 | IEEE Transactions on Information Forensics and Security | 2013 | Computer Science |
Trawling for Tor Hidden Services: Detection, Measurement, Deanonymization | 34 | 2013 IEEE Symposium on Security and Privacy (sp) | 2013 | Computer Science |
Identifying botnets by capturing group activities in DNS traffic | 34 | Computer Networks | 2012 | Computer Science |
Detecting P2P Botnets through Network Behaviour Analysis and Machine Learning | 30 | 2011 Ninth Annual International Conference on Privacy, Security, and Trust | 2011 | Computer Science |
A fuzzy pattern-based filtering algorithm for botnet detection | 29 | Computer Networks | 2011 | Computer Science |
A Taxonomy of Botnet Behaviour, Detection, and Défense | 17 | IEEE Communications Surveys and Tutorials | 2014 | Computer Science |
DNS for Massive-Scale Command and Control | 17 | IEEE Transactions on Dependable and Secure Computing | 2013 | Computer Science |
Mobile Botnet Detection Using Network Forensics | 15 | Future Internet-FIS 2010 | 2010 | Computer Science |
DFBotKiller: Domain-flux botnet detection based on the history of group activities and failures in DNS traffic | 13 | Digital Investigation | 2015 | Computer Science |
Botnet detection techniques: review, future trends, and issues | 12 | Journal of Zhejiang University-Science C-Computers & Electronics | 2014 | Computer Science |
DISCLOSURE: Detecting Botnet Command and Control Servers Through Large-Scale Net Flow Analysis | 12 | 28th Annual Computer Security Applications Conference (acsac 2012) | 2012 | Computer Science |
RTECA: Real-time episode correlation algorithm for multi-step attack scenarios detection | 11 | Computers & Security | 2015 | Computer Science |
A botnet-based command and control approach relying on swarm intelligence | 10 | Journal of Network and Computer Applications | 2014 | Computer Science |
Peer to Peer Botnet Detection Based on Flow Intervals | 10 | Information Security and Privacy Research | 2012 | Computer Science |
Active Botnet Probing to Identify Obscure Command and Control Channels | 10 | 25th Annual Computer Security Applications Conference | 2009 | Computer Science |
PsyBoG: A scalable botnet detection method for large-scale DNS traffic | 8 | Computer Networks | 2016 | Computer Science |
Botnet detection via mining of traffic flow characteristics | 8 | Computers & Electrical Engineering | 2016 | Engineering |
Peri-Watchdog: Hunting for hidden botnets in the periphery of online social networks | 8 | Computer Networks | 2013 | Computer Science |
On the detection and identification of botnets | 8 | Computers & Security | 2010 | Computer Science |
3.6 Impact Factor
This section discuss about impact factor of journals that published most botnet related papers. This is essential since it determines the most leading articles in publication and the highest citations acquired. From this data, researchers can fortify their work by distributing in great quality journals.
Productivity of journals
Journal title | Impact factor | Quartile | Publications | Publications (%) |
|---|---|---|---|---|
China Communications | 0.903 | Q4 | 735 | 1.22 |
Computer Communications | 3.338 | Q1 | 4865 | 8.08 |
Computer Journal | 0.711 | Q4 | 3214 | 5.34 |
Applied Sciences-Basel | 1.679 | Q3 | 591 | 0.98 |
Computer Networks | 2.516 | Q2 | 9028 | 15 |
Computers & Electrical Engineering | 1.57 | Q3 | 1756 | 2.92 |
Computers & Security | 2.849 | Q2 | 2.489 | 4.14 |
Concurrency and Computation-Practice & Experience | 1.133 | Q3 | 2057 | 3.42 |
Digital Investigation | 1.774 | Q3 | 948 | 1.58 |
IBM Journal of Research and Development | 1.083 | Q3 | 3350 | 5.57 |
IEEE-Inst Electrical Electronics Engineers Inc | 3.244 | Q1 | 1899 | 3.16 |
IEEE Communications Surveys and Tutorials | 17.188 | Q1 | 8654 | 14.38 |
IEEE Internet of Things Journal | 7.596 | Q1 | 938 | 1.56 |
IEEE Network | 7.23 | Q1 | 3014 | 5.01 |
IEEE Transactions on Cybernetics | 7.384 | Q1 | 5553 | 9.23 |
IEEE Transactions on Dependable and Secure Computing | 2.926 | Q1 | 1477 | 2.45 |
IEEE Transactions on Information Forensics and Security | 4.332 | Q1 | 5646 | 9.38 |
Information Systems and e-Business Management | 1.723 | Q3 | 342 | 0.56 |
International Journal of Distributed Sensor Networks | 1.239 | Q3 | 3055 | 5.01 |
International Journal of Information Security | 1.915 | Q2 | 564 | 0.94 |
3.7 Keyword Frequency
This section presents an analysis of the kind of keywords frequently used by researchers by looking at trends in the highest occurrence of keywords in our dataset. This discussion is essential as it empowers articles to be associated and therefore detected in present and past topics of journal papers. These keywords can be utilized to investigate and identify research patterns and gaps.
Highest occurring keywords and titles
Keyword | Frequency | Title | Frequency |
|---|---|---|---|
Method | 99 | Botnet Detection | 211 |
Traffic | 62 | Network Traffic | 153 |
Activity | 61 | Detection System | 117 |
Host | 61 | Android Botnet | 110 |
Model | 55 | Evasion Technique | 97 |
Service | 43 | P2p botnet | 91 |
Server | 40 | Application | 80 |
Botmaster | 29 | User | 73 |
DDOS Attack | 28 | Implementation | 65 |
Device | 16 | Dataset | 41 |
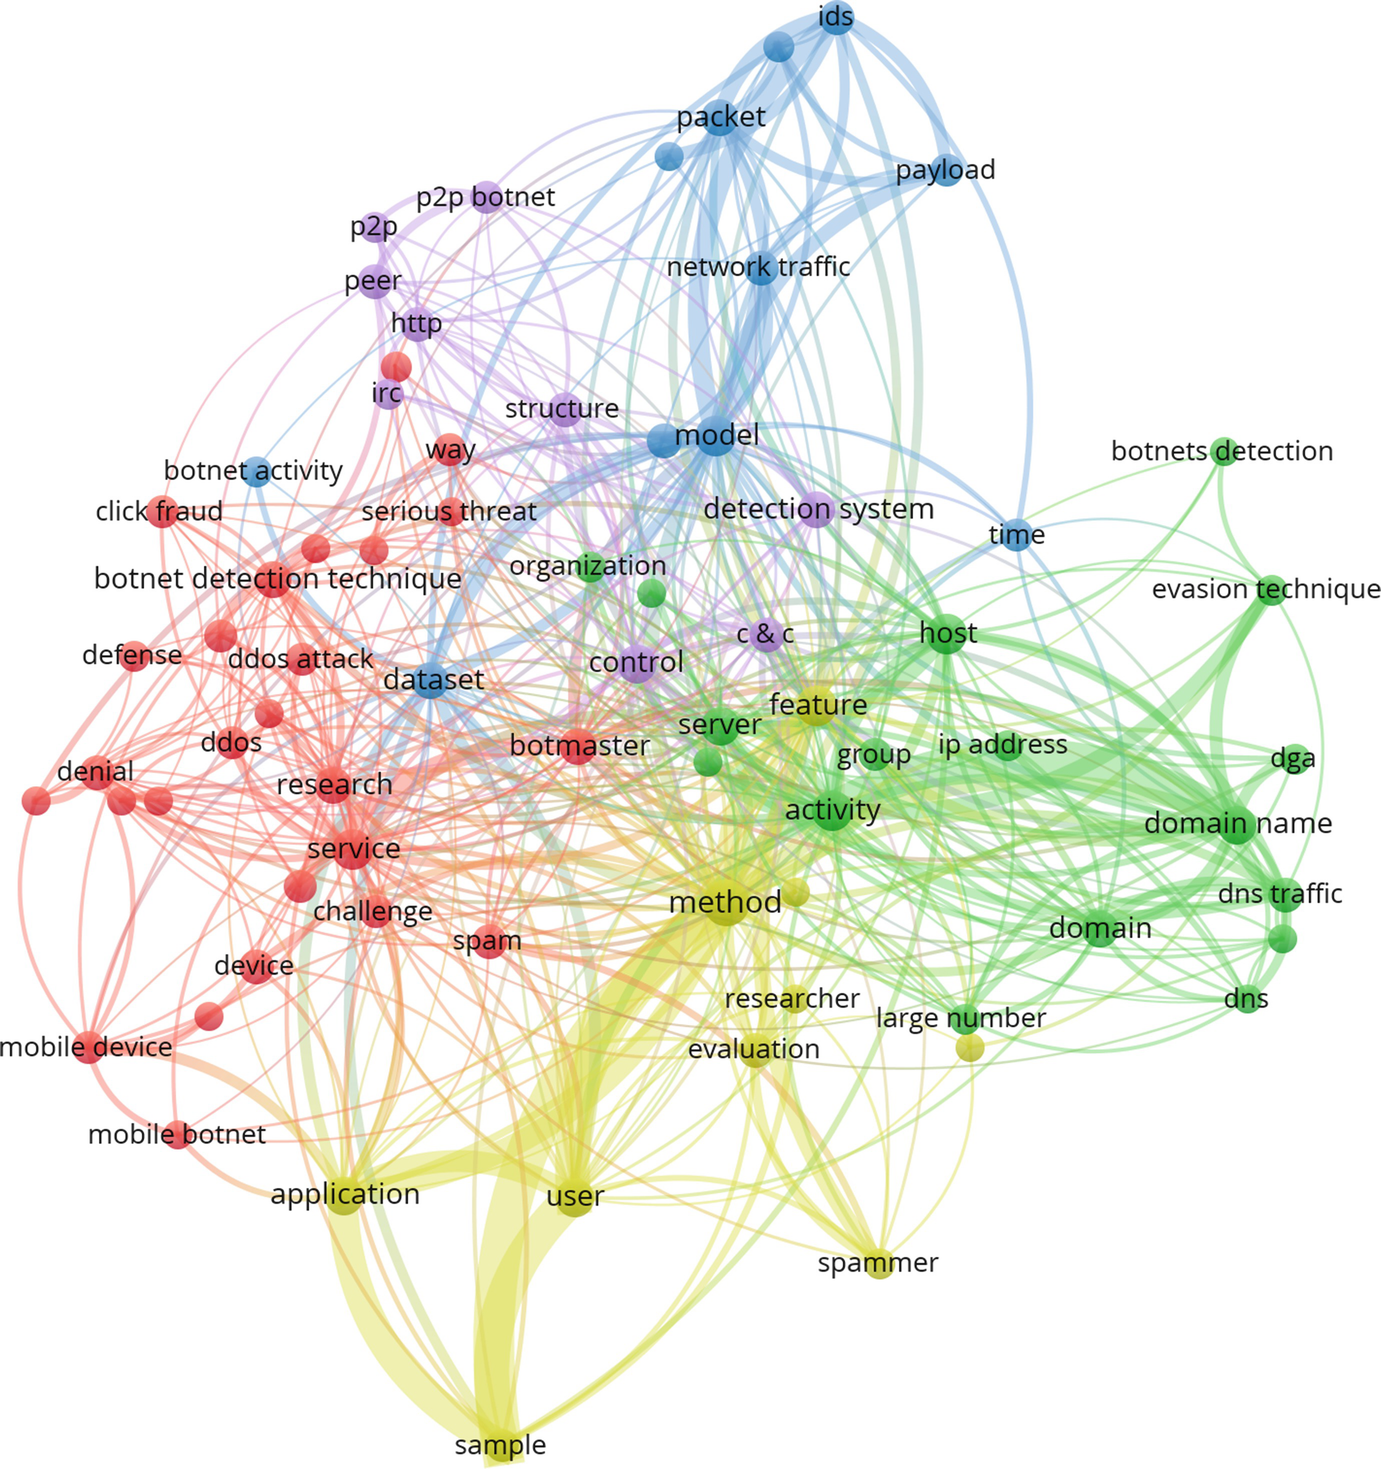
Keywords cluster diagram
4 Research Trends
In this section, we discuss our findings, research trends and the overall outcome of this research. The section focuses mainly on the production of research publications analyzed along the period of study of this paper, from 2009 to June 2018.
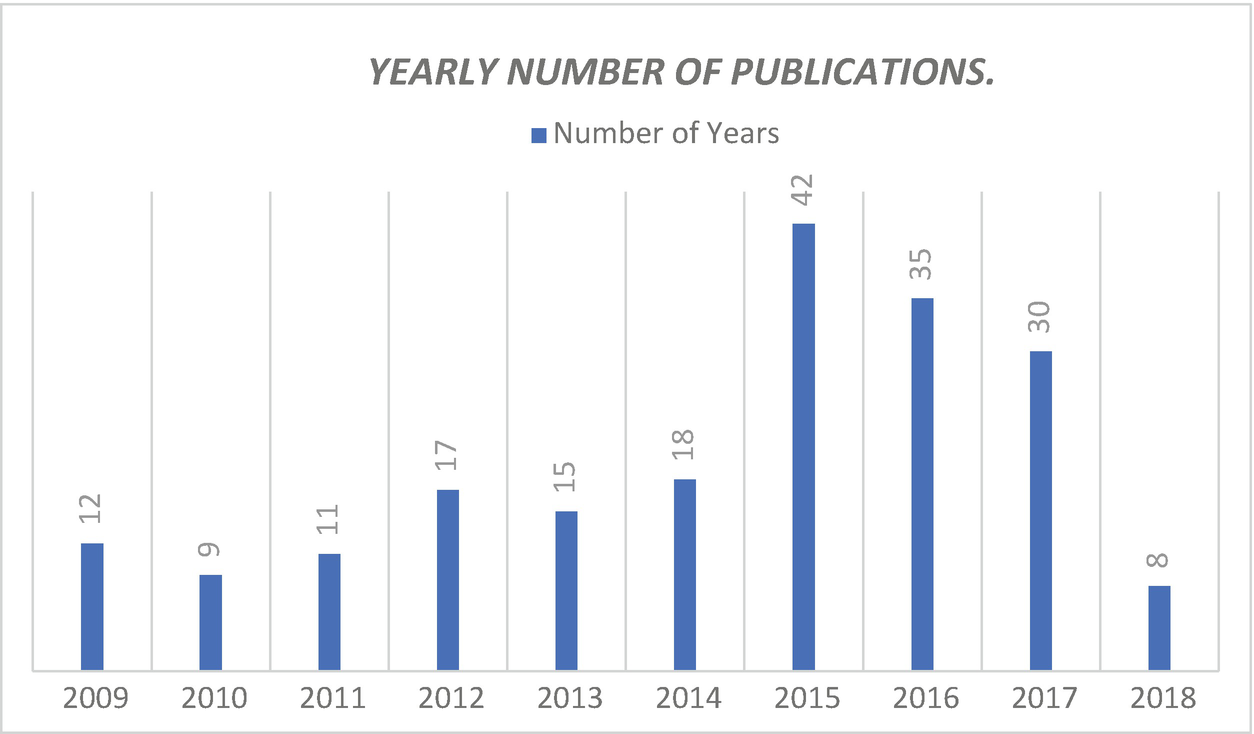
Yearly number of publications

Yearly number of publications based on continents
Continents like Europe, North America, Australia, and Africa have performed not so well. Europe has been very unpredictable, there was a decrease from 2009 to 2010 and kept increasing slowly until 2012 when sharply decreased until 2014 before a massive growth in 2015 that remained until 2017, however it has been falling till date. The figure above summarizes the findings.
It is evident from the results above that 2015 was the peak year for botnet attacks and the year which botnet research had trended the most. Continents like North America, Australia, and Africa did not have a relevant amount of publication until 2014. This also indicates that there was a trigger which led to a sudden interest in botnet detection research.

Yearly number of publications based on research area
Research publications in the area of Computer Science has experienced a continuous growth since 2010. Between 2010 and 2014, the number of publications grew slowly in the aforementioned areas from approximately 14 to 28 articles published. Nonetheless, in 2015 reached a remarkable peak of 64 publications, more than twice the amount of the previous year, showing consistency with the preceding graphs. After that, the growth rate showed a steady decline in bibliography production during the next 2 years, and a sharp drop in growth rate in 2018, although the amount for this last year is not definitive yet. This decreasing behavior of the last 3 years is a general trend in the rest of research areas, Engineering and Telecommunications, although for these two on the previous years to 2015 their amount of publications shows a more fluctuating behavior, which makes difficult to predict future trends.
In conclusion, the author believes botnet research is vital because the trend of publication clearly shows a need for ongoing research to tackle botnet detection techniques. However, the projection in number of publications in a near future is hard to estimate since it is related to attack events that can take place in the future worldwide cybernetic landscape, without mentioning possible advances in technology that are not being contemplated in this work and which may affect the way botnets operate.
5 Conclusion and Future Works
In this work, we used bibliometric analysis to examine botnet detection techniques during the period from 2009 to 2018, which allowed us to expose global tendencies related to bibliography production of botnet detection techniques. In this investigation, we offered seven (7) analysis criteria including productivity, research areas, institutions, authors, impact journals, highly-cited articles and keyword frequency. These criteria led us to note that Asia has the highest number of published articles, followed by North America where the United States stands out with an exceptional number of published articles.
The research area in which most of the articles about botnet detection are published is Computer Science and Engineering. Therefore, the research area with the highest cited publications is Computer Science. In this regard, it was also demonstrated that most productions come generally from North America and Asia.
On the other hand, the institutions that have directed most of the research related to botnets are mainly located, in descendent order of publications, in North America, Asia, and Europe. In the first two continents, most of the authors are from the United States and China respectively. Other countries in Asia like India and Malaysia, along with China, are very active in publishing articles as well.
Regarding the impact factor, the highest number of publications belongs to articles of IEEE Communications Surveys and Tutorials journal followed by IEEE Transactions on Information Forensics and Security and finally IEEE Transactions on Cybernetics. It was pointed out that the publication venue is critical in determining whether a newly published paper will be highly cited or not. It is worth to mention that the year of publication matters regarding the impact of the article, the earlier an article is published the more it is cited.
Lastly, during the analysis of keyword frequency, it was determined that the most applicable titles and keywords for the subject of this paper are respectively “botnet detection” and “method”. These are being used consistently by authors for writing and they have a direct influence on describing the trends and research directions for future study in botnet detection related research.