A Brief History of Data Science
The term data science has a specific history dating back to the 1990s. However, the fields that it draws upon have a much longer history. One thread in this longer history is the history of data collection; another is the history of data analysis. In this section, we review the main developments in these threads and describe how and why they converged into the field of data science. Of necessity, this review introduces new terminology as we describe and name the important technical innovations as they arose. For each new term, we provide a brief explanation of its meaning; we return to many of these terms later in the book and provide a more detailed explanation of them. We begin with a history of data collection, then give a history of data analysis, and, finally, cover the development of data science.
A History of Data Gathering
The earliest methods for recording data may have been notches on sticks to mark the passing of the days or poles stuck in the ground to mark sunrise on the solstices. With the development of writing, however, our ability to record our experiences and the events in our world vastly increased the amount of data we collected. The earliest form of writing developed in Mesopotamia around 3200 BC and was used for commercial record keeping. This type of record keeping captures what is known as transactional data. Transactional data include event information such as the sale of an item, the issuing of an invoice, the delivery of goods, credit card payment, insurance claims, and so on. Nontransactional data, such as demographic data, also have a long history. The earliest-known censuses took place in pharaonic Egypt around 3000 BC. The reason that early states put so much effort and resources into large data-collection operations was that these states needed to raise taxes and armies, thus proving Benjamin Franklin’s claim that there are only two things certain in life: death and taxes.
In the past 150 years, the development of the electronic sensor, the digitization of data, and the invention of the computer have contributed to a massive increase in the amount of data that are collected and stored. A milestone in data collection and storage occurred in 1970 when Edgar F. Codd published a paper explaining the relational data model, which was revolutionary in terms of setting out how data were (at the time) stored, indexed, and retrieved from databases. The relational data model enabled users to extract data from a database using simple queries that defined what data the user wanted without requiring the user to worry about the underlying structure of the data or where they were physically stored. Codd’s paper provided the foundation for modern databases and the development of structured query language (SQL), an international standard for defining database queries. Relational databases store data in tables with a structure of one row per instance and one column per attribute. This structure is ideal for storing data because it can be decomposed into natural attributes.
Databases are the natural technology to use for storing and retrieving structured transactional or operational data (i.e., the type of data generated by a company’s day-to-day operations). However, as companies have become larger and more automated, the amount and variety of data generated by different parts of these companies have dramatically increased. In the 1990s, companies realized that although they were accumulating tremendous amounts of data, they were repeatedly running into difficulties in analyzing those data. Part of the problem was that the data were often stored in numerous separate databases within the one organization. Another difficulty was that databases were optimized for storage and retrieval of data, activities characterized by high volumes of simple operations, such as SELECT, INSERT, UPDATE, and DELETE. In order to analyze their data, these companies needed technology that was able to bring together and reconcile the data from disparate databases and that facilitated more complex analytical data operations. This business challenge led to the development of data warehouses. In a data warehouse, data are taken from across the organization and integrated, thereby providing a more comprehensive data set for analysis.
Over the past couple of decades, our devices have become mobile and networked, and many of us now spend many hours online every day using social technologies, computer games, media platforms, and web search engines. These changes in technology and how we live have had a dramatic impact on the amount of data collected. It is estimated that the amount of data collected over the five millennia since the invention of writing up to 2003 is about 5 exabytes. Since 2013, humans generate and store this same amount of data every day. However, it is not only the amount of data collected that has grown dramatically but also the variety of data. Just consider the following list of online data sources: emails, blogs, photos, tweets, likes, shares, web searches, video uploads, online purchases, podcasts. And if we consider the metadata (data describing the structure and properties of the raw data) of these events, we can begin to understand the meaning of the term big data. Big data are often defined in terms of the three Vs: the extreme volume of data, the variety of the data types, and the velocity at which the data must be processed.
The advent of big data has driven the development of a range of new database technologies. This new generation of databases is often referred to as “NoSQL databases.” They typically have a simpler data model than traditional relational databases. A NoSQL database stores data as objects with attributes, using an object notation language such as the JavaScript Object Notation (JSON). The advantage of using an object representation of data (in contrast to a relational table-based model) is that the set of attributes for each object is encapsulated within the object, which results in a flexible representation. For example, it may be that one of the objects in the database, compared to other objects, has only a subset of attributes. By contrast, in the standard tabular data structure used by a relational database, all the data points should have the same set of attributes (i.e., columns). This flexibility in object representation is important in contexts where the data cannot (due to variety or type) naturally be decomposed into a set of structured attributes. For example, it can be difficult to define the set of attributes that should be used to represent free text (such as tweets) or images. However, although this representational flexibility allows us to capture and store data in a variety of formats, these data still have to be extracted into a structured format before any analysis can be performed on them.
The existence of big data has also led to the development of new data-processing frameworks. When you are dealing with large volumes of data at high speeds, it can be useful from a computational and speed perspective to distribute the data across multiple servers, process queries by calculating partial results of a query on each server, and then merge these results to generate the response to the query. This is the approach taken by the MapReduce framework on Hadoop. In the MapReduce framework, the data and queries are mapped onto (or distributed across) multiple servers, and the partial results calculated on each server are then reduced (merged) together.
A History of Data Analysis
Statistics is the branch of science that deals with the collection and analysis of data. The term statistics originally referred to the collection and analysis of data about the state, such as demographics data or economic data. However, over time the type of data that statistical analysis was applied to broadened so that today statistics is used to analyze all types of data. The simplest form of statistical analysis of data is the summarization of a data set in terms of summary (descriptive) statistics (including measures of a central tendency, such as the arithmetic mean, or measures of variation, such as the range). However, in the seventeenth and eighteenth centuries the work of people such as Gerolamo Cardano, Blaise Pascal, Jakob Bernoulli, Abraham de Moivre, Thomas Bayes, and Richard Price laid the foundations of probability theory, and through the nineteenth century many statisticians began to use probability distributions as part of their analytic tool kit. These new developments in mathematics enabled statisticians to move beyond descriptive statistics and to start doing statistical learning. Pierre Simon de Laplace and Carl Friedrich Gauss are two of the most important and famous nineteenth-century mathematicians, and both made important contributions to statistical learning and modern data science. Laplace took the intuitions of Thomas Bayes and Richard Price and developed them into the first version of what we now call Bayes’ Rule. Gauss, in his search for the missing dwarf planet Ceres, developed the method of least squares, which enables us to find the best model that fits a data set such that the error in the fit minimizes the sum of squared differences between the data points in the data set and the model. The method of least squares provided the foundation for statistical learning methods such as linear regression and logistic regression as well as the development of artificial neural network models in artificial intelligence (we will return to least squares, regression analysis, and neural networks in chapter 4).
Between 1780 and 1820, around the same time that Laplace and Gauss were making their contributions to statistical learning, a Scottish engineer named William Playfair was inventing statistical graphics and laying the foundations for modern data visualization and exploratory data analysis. Playfair invented the line chart and area chart for time-series data, the bar chart to illustrate comparisons between quantities of different categories, and the pie chart to illustrate proportions within a set. The advantage of visualizing quantitative data is that it allows us to use our powerful visual abilities to summarize, compare, and interpret data. Admittedly, it is difficult to visualize large (many data points) or complex (many attributes) data sets, but data visualization is still an important part of data science. In particular, it is useful in helping data scientists explore and understand the data they are working with. Visualizations can also be useful to communicate the results of a data science project. Since Playfair’s time, the variety of data-visualization graphics has steadily grown, and today there is research ongoing into the development of novel approaches to visualize large, multidimensional data sets. A recent development is the t-distributed stochastic neighbor embedding (t-SNE) algorithm, which is a useful technique for reducing high-dimensional data down to two or three dimensions, thereby facilitating the visualization of those data.
The developments in probability theory and statistics continued into the twentieth century. Karl Pearson developed modern hypothesis testing, and R. A. Fisher developed statistical methods for multivariate analysis and introduced the idea of maximum likelihood estimate into statistical inference as a method to draw conclusions based on the relative probability of events. The work of Alan Turing in the Second World War led to the invention of the electronic computer, which had a dramatic impact on statistics because it enabled much more complex statistical calculations. Throughout the 1940s and subsequent decades, a number of important computational models were developed that are still widely used in data science. In 1943, Warren McCulloch and Walter Pitts proposed the first mathematical model of a neural network. In 1948, Claude Shannon published “A Mathematical Theory of Communication” and by doing so founded information theory. In 1951, Evelyn Fix and Joseph Hodges proposed a model for discriminatory analysis (what would now be called a classification or pattern-recognition problem) that became the basis for modern nearest-neighbor models. These postwar developments culminated in 1956 in the establishment of the field of artificial intelligence at a workshop in Dartmouth College. Even at this early stage in the development of artificial intelligence, the term machine learning was beginning to be used to describe programs that gave a computer the ability to learn from data. In the mid-1960s, three important contributions to ML were made. In 1965, Nils Nilsson’s book titled Learning Machines showed how neural networks could be used to learn linear models for classification. The following year, 1966, Earl B. Hunt, Janet Marin, and Philip J. Stone developed the concept-learning system framework, which was the progenitor of an important family of ML algorithms that induced decision-tree models from data in a top-down fashion. Around the same time, a number of independent researchers developed and published early versions of the k-means clustering algorithm, now the standard algorithm used for data (customer) segmentation.
The field of ML is at the core of modern data science because it provides algorithms that are able to automatically analyze large data sets to extract potentially interesting and useful patterns. Machine learning has continued to develop and innovate right up to the present day. Some of the most important developments include ensemble models, where predictions are made using a set (or committee) of models, with each model voting on each query, and deep-learning neural networks, which have multiple (i.e., more than three) layers of neurons. These deeper layers in the network are able to discover and learn complex attribute representations (composed of multiple, interacting input attributes that have been processed by earlier layers), which in turn enable the network to learn patterns that generalize across the input data. Because of their ability to learn complex attributes, deep-learning networks are particularly suitable to high-dimensional data and so have revolutionized a number of fields, including machine vision and natural-language processing.
As we discussed in our review of database history, the early 1970s marked the beginning of modern database technology with Edgar F. Codd’s relational data model and the subsequent explosion of data generation and storage that led to the development of data warehousing in the 1990s and more recently to the phenomenon of big data. However, well before the emergence of big data, in fact by the late 1980s and early 1990s, the need for a field of research specifically targeting the analysis of these large data sets was apparent. It was around this time that the term data mining started to be used in the database communities. As we have already discussed, one response to this need was the development of data warehouses. However, other database researchers responded by reaching out to other research fields, and in 1989 Gregory Piatetsky-Shapiro organized the first workshop on knowledge discovery in databases (KDD). The announcement of the first KDD workshop neatly sums how the workshop focused on a multidisciplinary approach to the problem of analyzing large databases:
Knowledge discovery in databases poses many interesting problems, especially when databases are large. Such databases are usually accompanied by substantial domain knowledge which can significantly facilitate discovery. Access to large databases is expensive—hence the need for sampling and other statistical methods. Finally, knowledge discovery in databases can benefit from many available tools and techniques from several different fields including expert systems, machine learning, intelligent databases, knowledge acquisition, and statistics.1
In fact, the terms knowledge discovery in databases and data mining describe the same concept, the distinction being that data mining is more prevalent in the business communities and KDD more prevalent in academic communities. Today, these terms are often used interchangeably,2 and many of the top academic venues use both. Indeed, the premier academic conference in the field is the International Conference on Knowledge Discovery and Data Mining.
The Emergence and Evolution of Data Science
The term data science came to prominence in the late 1990s in discussions relating to the need for statisticians to join with computer scientists to bring mathematical rigor to the computational analysis of large data sets. In 1997, C. F. Jeff Wu’s public lecture “Statistics = Data Science?” highlighted a number of promising trends for statistics, including the availability of large/complex data sets in massive databases and the growing use of computational algorithms and models. He concluded the lecture by calling for statistics to be renamed “data science.”
In 2001, William S. Cleveland published an action plan for creating a university department in the field of data science (Cleveland 2001). The plan emphasizes the need for data science to be a partnership between mathematics and computer science. It also emphasizes the need for data science to be understood as a multidisciplinary endeavor and for data scientists to learn how to work and engage with subject-matter experts. In the same year, Leo Breiman published “Statistical Modeling: The Two Cultures” (2001). In this paper, Breiman characterizes the traditional approach to statistics as a data-modeling culture that views the primary goal of data analysis as identifying the (hidden) stochastic data model (e.g., linear regression) that explains how the data were generated. He contrasts this culture with the algorithmic-modeling culture that focuses on using computer algorithms to create prediction models that are accurate (rather than explanatory in terms of how the data was generated). Breiman’s distinction between a statistical focus on models that explain the data versus an algorithmic focus on models that can accurately predict the data highlights a core difference between statisticians and ML researchers. The debate between these approaches is still ongoing within statistics (see, for example, Shmueli 2010). In general, today most data science projects are more aligned with the ML approach of building accurate prediction models and less concerned with the statistical focus on explaining the data. So although data science became prominent in discussions relating to statistics and still borrows methods and models from statistics, it has over time developed its own distinct approach to data analysis.
Since 2001, the concept of data science has broadened well beyond that of a redefinition of statistics. For example, over the past 10 years there has been a tremendous growth in the amount of the data generated by online activity (online retail, social media, and online entertainment). Gathering and preparing these data for use in data science projects has resulted in the need for data scientists to develop the programming and hacking skills to scrape, merge, and clean data (sometimes unstructured data) from external web sources. Also, the emergence of big data has meant that data scientists need to be able to work with big-data technologies, such as Hadoop. In fact, today the role of a data scientist has become so broad that there is an ongoing debate regarding how to define the expertise and skills required to carry out this role.3 It is, however, possible to list the expertise and skills that most people would agree are relevant to the role, which are shown in figure 1. It is difficult for an individual to master all of these areas, and, indeed, most data scientists usually have in-depth knowledge and real expertise in just a subset of them. However, it is important to understand and be aware of each area’s contribution to a data science project.
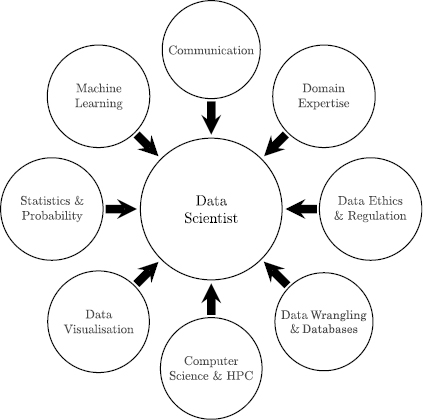
Figure 1 A skills-set desideratum for a data scientist.
Data scientists should have some domain expertise. Most data science projects begin with a real-world, domain-specific problem and the need to design a data-driven solution to this problem. As a result, it is important for a data scientist to have enough domain expertise that they understand the problem, why it is important, and how a data science solution to the problem might fit into an organization’s processes. This domain expertise guides the data scientist as she works toward identifying an optimized solution. It also enables her to engage with real domain experts in a meaningful way so that she can illicit and understand relevant knowledge about the underlying problem. Also, having some experience of the project domain allows the data scientist to bring her experiences from working on similar projects in the same and related domains to bear on defining the project focus and scope.
Data are at the center of all data science projects. However, the fact that an organization has access to data does not mean that it can legally or should ethically use the data. In most jurisdictions, there is antidiscrimination and personal-data-protection legislation that regulates and controls the use of data usage. As a result, a data scientist needs to understand these regulations and also, more broadly, to have an ethical understanding of the implications of his work if he is to use data legally and appropriately. We return to this topic in chapter 6, where we discuss the legal regulations on data usage and the ethical questions related to data science.
In most organizations, a significant portion of the data will come from the databases in the organization. Furthermore, as the data architecture of an organization grows, data science projects will start incorporating data from a variety of other data sources, which are commonly referred to as “big-data sources.” The data in these data sources can exist in a variety of different formats, generally a database of some form—relational, NoSQL, or Hadoop. All of the data in these various databases and data sources will need to be integrated, cleansed, transformed, normalized, and so on. These tasks go by many names, such as extraction, transformation, and load, “data munging,” “data wrangling,” “data fusion,” “data crunching,” and so on. Like source data, the data generated from data science activities also need to be stored and managed. Again, a database is the typical storage location for the data generated by these activities because they can then be easily distributed and shared with different parts of the organization. As a consequence, data scientists need to have the skills to interface with and manipulate data in databases.
A range of computer science skills and tools allows data scientists to work with big data and to process it into new, meaningful information. High-performance computing (HPC) involves aggregating computing power to deliver higher performance than one can get from a stand-alone computer. Many data science projects work with a very large data set and ML algorithms that are computationally expensive. In these situations, having the skills required to access and use HPC resources is important. Beyond HPC, we have already mentioned the need for data scientists to be able to scrap, clean, and integrate web data as well as handle and process unstructured text and images. Furthermore, a data scientist may also end up writing in-house applications to perform a specific task or altering an existing application to tune it to the data and domain being processed. Finally, computer science skills are also required to be able to understand and develop the ML models and integrate them into the production or analytic or back-end applications in an organization.
Presenting data in a graphical format makes it much easier to see and understand what is happening with the data. Data visualization applies to all phases of the data science process. When data are inspected in tabular form, it is easy to miss things such as outliers or trends in distributions or subtle changes in the data through time. However, when data are presented in the correct graphical form, these aspects of the data can pop out. Data visualization is an important and growing field, and we recommend two books, The Visual Display of Quantitative Information by Edward Tufte (2001) and Show Me the Numbers: Designing Tables and Graphs to Enlighten by Stephen Few (2012) as excellent introductions to the principles and techniques of effective data visualization.
Methods from statistics and probability are used throughout the data science process, from the initial gathering and investigation of the data right through to the comparing of the results of different models and analyses produced during the project. Machine learning involves using a variety of advanced statistical and computing techniques to process data to find patterns. The data scientist who is involved in the applied aspects of ML does not have to write his own versions of ML algorithms. By understanding the ML algorithms, what they can be used for, what the results they generate mean, and what type of data particular algorithms can be run on, the data scientist can consider the ML algorithms as a gray box. This allows him to concentrate on the applied aspects of data science and to test the various ML algorithms to see which ones work best for the scenario and data he is concerned with.
Finally, a key aspect of being a successful data scientist is being able to communicate the story in the data. This story might uncover the insight that the analysis of the data has revealed or how the models created during a project fit into an organization’s processes and the likely impact they will have on the organization’s functioning. There is no point executing a brilliant data science project unless the outputs from it are used and the results are communicated in such a way that colleagues with a nontechnical background can understand them and have confidence in them.