| |
Now for how to buy, sell or do nothing under the (Automatic Investment Management) AIM system. This is an important—probably the most important—chapter of the book. You must thoroughly understand and follow this to get the benefits from the AIM system. I'm going to go through it slowly and I want you not only to read and understand it, but also practice it with some stocks of your own until it becomes second nature. And it will! At first it might seem complicated, but it's really incredibly simple. And once you learn it you will be doing exactly the same process every month but the results will be different. Some months the AIM system will tell you to buy and it will tell you how much to buy or how many dollars’ worth of the investment to buy or how many dollars’ worth of the investment to sell or AIM may want you to do nothing because the price of the investment hasn't gone down or up enough for AIM to decide to make a buy or sell. Here's how to do it.
You will see that this example comes from a while ago. Don’t worry about the particular year – the way AIM works is timeless so this is still a good example. As long as prices are moving up or down or holding steady the AIM system tells you to buy or sell and how much to buy and sell or do nothing. This stays the same year after year. When you subscribe to my monthly newsletter you will get the very latest numbers in several portfolios and you will see that the AIM system is still earning great profits after all these years. Imagine if you had started using this system back when this example came from. Don’t have the same regret 20 years from now.
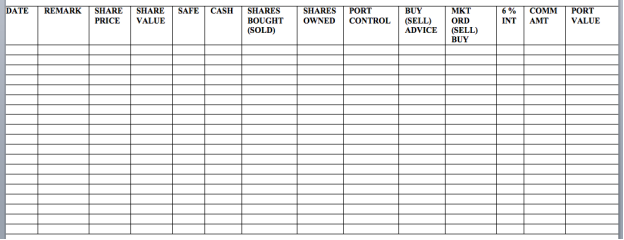
There still may be some old-fashioned investors who don't like computers so this will appeal to them. I have created a paper version of the spreadsheet. You can also do all of these calculations on a spreadsheet and make it easier by putting in a few very simple formulas in some of the columns.
Email me at jeff@jjjinvesting.biz. I will send you a blank sheet for stocks and a separate blank spreadsheet with headings for long-term options (LEAPS). I recommend you print out the blank spreadsheet, copy the first row from the finished spreadsheet, and then copy the date and share price columns. Then do the Claire’s Stores spreadsheet yourself. When you get the same numbers as the printed spreadsheet you understand how to do AIM.
Now a quick explanation of what every column means before we look at two years of one stock and you see the system in action.
Column 1 DATE - The date becomes the month and year (for example 6/16.) You check your stock or LEAP at least once a month or more often if you wish. It might be daily for some of the more volatile investments like LEAPs or leveraged ETF's. In this example I am just going to be checking the stock monthly. And you will see just checking it monthly can still make you quite a nice profit. So 6/16 would be followed by 7/16, followed by 8/16 - I think you get the picture.
Column 2 REMARKS - Here you will list things such as readjust stock/cash ratio, stock splits using different SAFE percent’s (10% is the normal SAFE amount as you'll see later on) but we will use different SAFE percentages in bear markets.
Column 3 – SHARE PRICE - This is the closing price of one long-term option (LEAPS) as reported in the newspaper or the website for the day you’re checking. You can easily find daily prices at http://yahoo.com in the financial section or if you can find websites that will list option prices.
Column 4 – SHARE VALUE - This is the SHARE PRICE from column 3 multiplied by the number of SHARES OWNED which is found in column 8.
Column 5 SAFE – SAFE is an arbitrary 10% of the share value found in column 2. Thus, if your SHARE VALUE is $5,000, your SAFE amount would be $500. You'll see how SAFE keeps you from buying and selling too soon when we go through the actual example stock.
Column 6 – CASH - Originally Robert Lichello said to use a ratio of 50% CASH and 50% shares when you start an AIM investment. So for example, if you started with $10,000, you would have $5,000 in options, and $5,000 in CASH. I have found that we can vary the amount of cash in an AIM investment depending on the volatility of the investment. A quick example is on a LEAP which is a very volatile investment; you would always want to use a ratio of 50% CASH and 50% LEAPs. And on a closed-end fund that you buy for income, you can safely use a ratio of one third CASH and two thirds closed-end fund shares that would mean on a $10,000 investment, you could own $6,677 worth of closed-end fund shares and $3,333 for CASH.
One disadvantage nowadays of keeping a great amount of cash in your broker’s money market account, is that money market accounts pay a very low interest rate, usually less than 1%. This means you're not earning very much on the money, but having cash to buy shares at cheaper prices is an essential feature that will pay off for you later on when your stock or other investment goes down and you need to buy more shares. I have found a way you can make high interest on your CASH balance – put your CASH money into High-Yielding Closed-End Funds like AGNC which pays a monthly dividend and pays more than 6% dividend per year. There are other good high yielding closed-end funds also.
Your CASH total will go up or down every month depending on whether you're buying and selling and earning interest on your cash. Also I view it as optional if you want to deduct the cost of the commissions as you make buys and sells. Personally I wouldn't bother worrying about the commissions; you make enough profits without really worrying about it.
You'll see that the AIM system is very conservative as half of your investment will go to CASH. If you have a buy, then Column 6 (CASH) – Column 11 (MARKET ORDER BUY) X 1.005 (interest) equals next month's cash total. If you have a sell, then, Column 6 + Column 11 (MARKER ORDER (SELL) x 1.005 equals next month's cash total.
Column 7 – SHARES BOUGHT (SOLD) - After you make your monthly check of the option price investment price, you might be buying some options, selling some options or doing nothing. In this column you will record the number of long-term option (LEAPS) contracts you bought or sold for that particular day in time. If you did nothing, put a – (dash) in the column. To arrive at the number of option contracts you bought or sold, you divide the dollar amount in column 11 (MARKET ORDER BOUGHT (SOLD)) by the option SHARE PRICE in column 3. For example, if the system tells you to sell 3 contracts (300 options) and the LEAPS contracts are selling for $350, then you sell 3 contracts for $1,050. Remember to put the “( )” around the sold contracts to keep separate the buy and sell transactions which are sharing the same column.
Column 8 – SHARES OWNED - This is the number of option shares you currently own. This figure will constantly go up and down. Column 8 equals last month’s column 8 plus any option contracts you bought in the previous month minus any option contracts sold in the previous month or day that you did AIM. If the previous month or day that you did AIM and AIM told you don't need to make any buys or sells then column 8 would be the same number of option shares in the row just above the current row you're using.
Column 9 PORTFOLIO CONTROL – This is another important column. When you start, put a dollar amount equal to the dollar amount of option contracts you bought to start (this is only a control number, no money involved with this column). If you start with $1,000 worth of options, your PORTFOLIO CONTROL amount/number is also 1,000. After your initial injection of money, PORTFOLIO CONTROL will only change if you buy more. Every time you buy more options, you add half the amount you bought to your PORTFOLIO CONTROL total. For example, the system tells you to buy $800 worth of option contracts; you add $400 to your prior PORTFOLIO CONTROL total. If no buy, then column 9 is the same as the prior month.
Column 10 – BUY (SELL) ADVICE - Every month you look at your option SHARE VALUE (column 4) and PORTFOLIO CONTROL. If your option SHARE VALUE is higher, you put that figure on top; if your PORTFOLIO CONTROL amount is higher, you put that on top. For example: if your option SHARE VALUE is $5,000 and your PORTFOLIO CONTROL amount is higher, you put PORTFOLIO CONTROL on top. For example: if you're option SHARE VALUE IS $5,000 and your PORTFOLIO CONTROL is $3,000 then you would put the higher value on top like this:
SHARE VALUE |
$5,000 |
- PORTFOLIO CONTROL |
3,000 |
= (SELL) ADVICE |
$2,000 |
Or if PORTFOLIO CONTROL is higher:
PORTFOLIO CONTROL |
$5,000 |
- SHARE VALUE |
$3,000 |
= BUY ADVICE |
$2,000 |
––––––––

Column 11 – MARKET ORDER BUY (SELL) - This is the column that tells you whether you execute an order with your stock broker or not. You take the amount from column 10, BUY (SELL) ADVICE, and subtract out the SAFE (column 5) amount. If the amount is over $300 (this is my new rule of thumb for determining when you make actual buys or sells for options.) This means you go online and tell your broker that you want to buy or sell the dollar amount of your MARKET ORDER by telling the broker the number of long-term option (LEAPS) contracts you want to buy or sell. If you have a sell order, you have to figure out how many option contracts you must sell (column 11 divided by column 3, SHARE PRICE X 100) and tell your broker to sell that many contracts. For example, if your market order was to sell $300 worth of $100 option contract, then you would tell your broker to sell 3 contracts. You would do the same exact thing if it's a buy order, you divide the dollar amount of the buy order by the current price of the option and that determines how many contracts you buy. Always remember investing is an art and not a science, so if the AIM system tells you to buy 2.7 contracts, then you can easily round that off to buy 3 contracts and everything will work fine.
COLUMN 12 – 6% INTEREST - This is the amount of interest earned by your cash total from column 6. The .005 is 1/12 of 6% or the amount of interest you earn in one month. I picked 6% because it's easy to work with over a long period of time. It is a fair average of the interest rate you can earn on high-yield closed-end funds over the long-term and it keeps things simple; monthly interest is always one half of 1%. Remember we are in this for the long haul and if you play AIM over the next 20-30 years, your high-yield closed-end funds will average out to 6% interest. I can help you to earn the 6% by buying High Yield Closed-End funds that pay 6% or higher with your Cash.
Column 13 – PORTFOLIO VALUE/TOTAL - Add the value of your CASH, column 6 + SHARE VALUE column 4, the value of your options or other investment and you have the total current value of your investment. You will notice one nice thing about the AIM spreadsheet. Once you start with the stock you see exactly what you're starting amount is in the very first row when you look at PORTFOLIO TOTAL. In this example we are starting with a PORTFOLIO TOTAL of $10,000. And then in future months you can see how much you are ahead in profits!
So when you compare PORTFOLIO TOTALs in the future rows, you can easily see exactly what your status is, if the PORTFOLIO TOTAL is higher than $10,000 then you are ahead or profitable. If the PORTFOLIO TOTAL is less than $10,000, you currently have a "paper loss". All that means is that the option or other investment is cheaper than when you originally bought it, and possibly AIM is telling you to buy more option shares of this cheap option so when it turns around and goes higher later on you will own more option shares that will go up in value and that will increase your profits.
Now I will go through an actual stock (long-term options hadn’t been invented yet) and show you just how easy it is. Get your pencil, calculator, and 13 – column paper or your spreadsheet. Write all the headings in the proper columns. Now write the name of the stock, for this example I picked Claire’s Stores (CLE), see the completed spreadsheet at the end of this Chapter. Then below the name list the stock exchange. NYSE equals the New York Stock Exchange. The first month in our example is June 1994 (6/94), write that in your date column. Then we are going to imagine that we have $10,000 to invest. Having a calculator will make your figuring easier. We are going to start with June 1994 because that is when I made this example. The numbers would be different today of course but the process is the same.
The first month is June 94 (6/94), write that in your date column. Then we are going to imagine that we have $10,000 to invest. Having a calculator or using formulas in the spreadsheet will make your figuring easier.
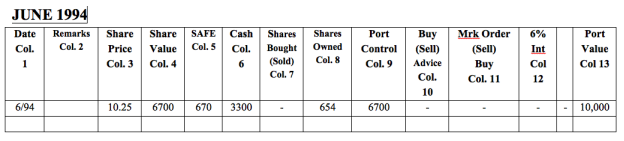
We start with $10,000 to invest. First we look at the price of the stock or option in the newspaper or on the website. A great website to look up stock prices is Yahoo Finance - all you have to do is type in the symbol and you'll see exactly what the current price of any stock or options is. When you actually buy your stock or option, you'll be able to go your account online and see what price you paid. For the original buy price we will use a limit price so we know what price we paid.
LEAPS prices and stock prices can move quickly so you may have put in an online order to say buy Claire’s Stores and Yahoo told you the price was $10.25. You might find when you actually buy it maybe you bought the stock at $10.20 or $10.30 so that is the price you would want to put down when you find your actual buy price. Our stock was selling for $10.25. Write that in column 3. Our first share value will be 2/3 of our $10,000 or $6,700 rounded off. For very conservative stocks we can go 2/3 stock & 1/3 cash but for long-term options (LEAPS) like we use with the Dogs of the Dow stocks we always go 50% LEAPS, 50% Cash. Write $6,700 in column 4. In this example you see I used the liberal idea of two thirds stock and one third cash. Based on the investment you are going to be in (Dogs of the Dow LEAPS) I will recommend that you go 50% cash and 50% long-term options (LEAPS.)
Then in column 5, write $670 because SAFE is always 10% of the SHARE VALUE, in column 4. Then write $3,300 in column 6 because you always start with two thirds of your money in stock and one third in cash on a conservative investment. In column 8 you write the number of shares you own. This is figured by dividing SHARE VALUE in column 4 by the SHARE PRICE – in column 3 - $10.25 equals 654 shares. Always round off, if you get 653.9, then 654 shares, if 653.3, then 653 shares. Then in column 9 PORTFOLIO CONTROL, put in the same number as you had in column 4, SHARE VALUE, 6,700.
Column 10 doesn't come into play yet, and column 11 doesn't either. You haven't earned any interest yet, so column 12 is blank also. Now add up the value of the stock you bought in column 4 and the amount of cash in column 6 and you have your total for PORTFOLIO VALUE. Put $6,700 + $3,300 equals $10,000.
Now let me show you how simple and profitable the system will be for you. Remember to reinvest all dividends into your money market account or closed-end high yield funds. Just tell your broker when you open your account that you always want any dividends placed into your money market account and you do not want to buy additional shares or fractions of shares with any dividends you receive. You will not have this problem with long-term options (LEAPS) because they do not pay dividends on options – only shares of stock or closed-end funds pay dividends.
Now how to use the system in the real world. On July 1 or thereabouts, you pick up your newspaper or look on your computer. You type in the symbol and find Claire’s Stores. From now on I'm just going to say you look on your computer because when I wrote this, newspapers were a lot greater source of stock market information than they are today.
Today everything you want is either on a website or your iPhone on your iPad etc. so now on we would just say we look it up on the web. My new iPhone has this great little feature; all I have to do is press the stock market app on the very opening screen and I can find out all the information on stock prices you ever dreamed of. You can always find any symbol by going to Yahoo Finance. Barrons has information on stocks at http://www.barrons.com. Go down to the bottom and open up either the New York or NASDAQ stock exchange. Go to the first letter of the stock’s name and you will see the symbol right next to the name of the stock.
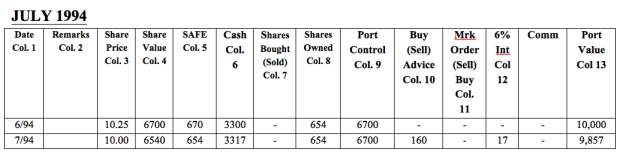
We find Claire’s Stores and see that the price on July 1 is $10, which we write in column 3. Did you remember to put July, 94, - 7/94, in the date column? Now go to column 8 for July 94. Look above in column 8 and you will see you owned 654 shares in June and you didn't buy or sell any in column 7. This is why you leave column 7 blank in the first month. You still own 654 shares. Write 654 in column 8 for July 94.
Also your PORTFOLIO CONTROL amount is still the same (you didn't buy anything in addition to the opening buy in the first month, when you opened your account), so write 6,700 in column 9. Now multiply the number of shares owned (654) by the share price ($10) and you have your SHARE VALUE for column 4. Now CASH, you'll notice, has grown from $3,300 to $3,317. This is because you earned $17 interest (1/2 of 1% for one month) which you write in column 12. If you had bought or sold stocks the preceding month, that would have also affected cash this month.
Now you take your two key amounts – SHARE VALUE and PORTFOLIO CONTROL and look at them. Which is higher? PORTFOLIO CONTROL is higher (6,700) than SHARE VALUE (6,540). Since PORTFOLIO CONTROL is higher, put PORTFOLIO CONTROL on top. You'll be seeing this chart every month. Once you start doing this, you won't need the chart, but it's a good way to learn.
PORTFOLIO CONTROL |
6,700 |
- SHARE VALUE |
$6,540 |
= BUY ADVICE |
$160 |
You now have a potential buy for $160 but it's only potential. Now look at the SAFE amount in column 5 and you find that it is 654 which is higher than your buyer advice in column 10. So you put zero in column 11, MARKET ORDER BUY because your signal isn’t strong enough to give you a market order yet. Put a “–“ (dash) in column 7 since you won’t be buying or selling any stock this month. Be patient, the system doesn't want you to sell or buy too soon. You'll get plenty of chances. Now all you have to do is figure column 13, PORTFOLIO VALUE. You remember, add column 4, SHARE VALUE and column 6, CASH and you have the current value of your investment. This month it's $6,540 + $3,317 = $9,857. If the stock goes up in price, you'll have a potential sell and if it goes down, a potential buy.
Now for August 94. I'll be shorter in my explanations and you'll see you will still understand because you did the same thing every month. While every month is done the same, the outcome can be quite different.
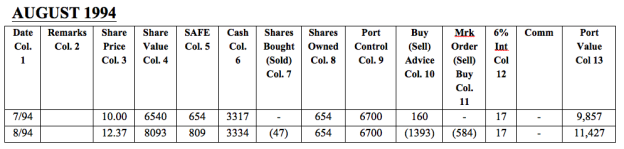
First look up the price of Claire's stock. Claire's price is $12.37. Write in column 3. Then multiply the number of shares owned (still 654 shares since you didn't buy or sell any last month) by the price of one share and that gives you a SHARE VALUE of $8,093. SAFE is always 10% so write 809 in column 5. Again the only thing that affected CASH is INTEREST; you earned another $17. So write $17 in column 12 and add $17 to your CASH. You now have $3,334 in CASH. Since you didn't buy any stock last month, PORTFOLIO CONTROL stays the same at 6,700. Again the magic two numbers, SHARE VALUE and PORTFOLIO CONTROL. Again since SHARE VALUE is higher put that on top. Since SHARE VALUE is higher, you have a potential (sell) signal; now write the higher amount SHARE VALUE on top:
SHARE VALUE |
$8,093 (COL. 4) |
- PORTFOLIO CONTROL |
6,700 (COL. 9) |
= (SELL) ADVICE |
$1,393 (COL. 10) |
Now subtract SAFE from (SELL) ADVICE |
- 809 (COL.5) |
= MARKET ORDER (SELL) |
$ 584 (COL.11) |
You should be writing all these figures on your sample spreadsheet the same as the illustration at the end of the Chapter shows.
As you can see, you're getting your first sell order. Now divide $584 by the SHARE PRICE ($12.37) and you have 47 shares to sell. Write (47) in SHARES BOUGHT (SOLD) column. Now finish your months’ work by figuring out your PORTFOLIO VALUE. It's ($8,093) + column 6 ($3,334) = $11,427. Now you call your stockbroker or go to your online trading account and execute a sell for 47 shares.
You’re ahead $1,427 but better things are still ahead.
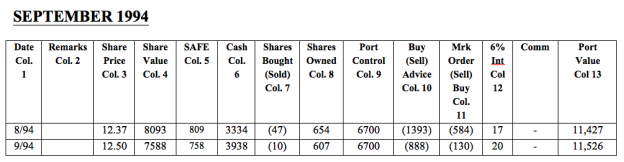
Now let’s go even quicker because I'm sure you understand how simple and repetitive the system is and soon you'll see its power. Try doing September ‘94 on your own. Remember to start by looking up the price of Claire’s Stores. Since this is an example, of course you can't but soon you'll be doing your own stocks and this will be the first step.
Okay, the price has risen and is now $12.50. Write down $12.50 and then fill in column 9 that didn't change since no buying last month. But column 8, SHARES OWNED, did change. We sold 47 shares last month. So subtract 47 from the column 8 total from the prior month (654 - 47 = 607). Write 607 in column 8, SHARES OWNED. Now figure column 6 CASH. You started with $3,334 and must add the $584 you got from selling the stock. So $3,334+ $584 = $3,918 + $20 for INTEREST = $3,938, WRITE in column 6, CASH. Write $20 in column 12, INTEREST.
Then compare column 4 with column 9 and see which is higher. SHARE VALUE is still higher $7,588 To PORTFOLIO CONTROL’s 6,700. You can figure you have a potential (SELL) of $888 that you write in column 10. You glance at SAFE and see its lower than your potential (SELL) ADVICE (888-758 = 130), so you write (130) in column 11, MARKET ORDER (SELL) BUY. You have a sell. Now divide $130 by $12.50 and you find you sell 10 shares. In this example I am making any sells over $100. Many years later I have decided that is too low because it generates too many commissions and so I've basically raised the amount of any buy or sell to a minimum of $300 so you would pay fewer commissions and sell at higher prices and buy at lower prices. Write (10) in column 7, SHARES BOUGHT (SOLD). Add up the value of your portfolio in column 13 – remember it's CASH + SHARE VALUE. Your PORTFOLIO VALUE is $11,526.
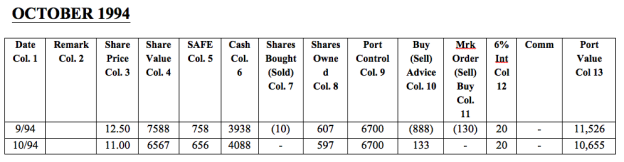
Now October ‘94. Stock price is $11.00 (stock prices do go down). Again write the SHARES OWNED and PORTFOLIO CONTROL numbers in columns 8 and 9. Column 9, PORTFOLIO CONTROL hasn't changed since no buying but SHARES OWNED did change since we sold 10 shares. So go to last month's column 8 total and subtract 10 (607-10 = 597) and write that number in column 8. Now figure SHARE VALUE and you see it's less than $6,700. It's $6,567 to be exact. SAFE is always 10% of SHARE VALUE so fill that in. CASH again was affected by selling. You started with $3,938 and added $130 + $20 INTEREST = $4,088.
Now look at PORTFOLIO CONTROL and it is higher than SHARE VALUE so put PORTFOLIO CONTROL on top. Think P for purchase. You have BUY ADVICE of $133. Before you do anything, you still must compare BUY ADVICE to SAFE. SAFE is going to cancel this market order because it is greater than the BUY ADVICE.
Did you remember not to put ( ) around zero in column 11? I don't bother putting ( ) around 0 in column 11, I just use a –. Again if you haven't given yourself $20 in INTEREST, add $20 to your CASH account and again add SHARE VALUE and CASH to obtain your PORTFOLIO VALUE. Your PORTFOLIO VALUE is $10,655.
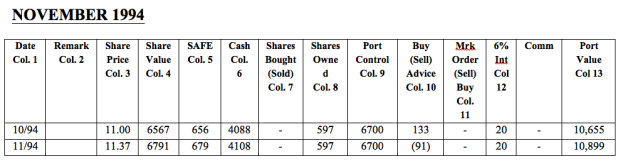
Now November ‘94 and the stock has risen a little. Remember the beauty of the system: buy low and sell high. Watch it work. Okay, SHARE PRICE has risen to $11.37. Write it in SHARE PRICE and number of SHARES OWNED and PORTFOLIO CONTROL, which didn't change since no buying last month. Now multiply number of shares 597 X SHARE PRICE $11.37 and your SHARE VALUE is $6,791. Again SAFE is 10% of SHARE VALUE or 679. CASH has earned another $20 of INTEREST, write that in column 12 and add the $20 to CASH total in col. 6. Look at SHARE VALUE and PORTFOLIO CONTROL and as you thought, SHARE VALUE is higher which could possibly signal a sell. Write SHARE VALUE on top and PORTFOLIO CONTROL below as shown here:
SHARE VALUE |
$6,791 |
- PORTFOLIO VALUE |
6,700 |
= SELL ADVICE |
$91 |
Now compare your (SELL) ADVICE to SAFE and you see that SAFE overrules any selling this month.
MARKET ORDER again is $0 but we use a – instead of writing $0. Again finish off the month by figuring your PORTFOLIO VALUE: SHARE VALUE + CASH or $6,791 + $4,108 = $10,899 or your investment is up $899. Keep thinking long-haul.
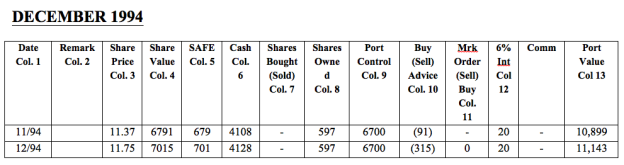
Now December ‘94. Again look up the SHARE PRICE (it’s $11.75). Write it in column 3. Now go to column 8, SHARES OWNED and column 9, PORTFOLIO CONTROL; since you did nothing last month both stayed the same. Now continue business as usual.
Multiply the number of shares (597 X SHARE PRICE $11.75) and your SHARE VALUE is $7,015 write it in column 4. CASH was only affected by INTEREST so add $20 to this month's total and write $20 in column 12, INTEREST. Now compare PORTFOLIO CONTROL to SHARE VALUE. SHARE VALUE is $7,015 and bigger than PORTFOLIO CONTROL so you place it on top. Again remember P for purchase if PORTFOLIO CONTROL is on top and S for sell if SHARE VALUE is on top. Very simple. So do your calculations:
SHARE VALUE |
$7,015 |
- PORTFOLIO CONTROL |
6,700 |
= (SELL ) ADVICE |
$315 |
- SAFE |
701 |
= MARKET (SELL) ORDER |
$ 0 |
You do nothing. Then you figure PORTFOLIO VALUE. Remember how? See this is easy. You added SHARE VALUE of $7,015 + CASH of $4,128 = $11,143. You’re ahead $1,143.
Now we will skip some months. Every month you do the same process and calculations. Here is what things will look like in May 1995.
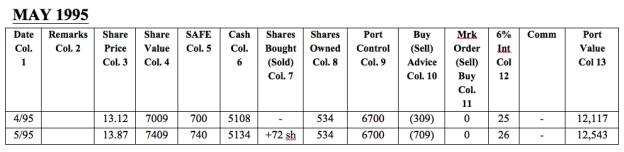

Onto May ‘95. SHARE PRICE is $13.87. Since you didn't buy or sell anything last month, SHARES OWNED AND PORTFOLIO CONTROL remained the same. SHARE VALUE is $7,409 (534 X $13.87), SAFE is 740. CASH was only affected by INTEREST, so add the $26 INTEREST earned ($5,108 X 1.005 = $5,134). Again check PORTFOLIO CONTROL and SHARE VALUE and again PORTFOLIO CONTROL is lower so PORTFOLIO CONTROL goes on the bottom:
SHARE VALUE |
$7,409 |
- PORTFOLIO CONTROL |
6,700 |
= (SELL) ADVICE |
$709 |
- SAFE |
740 |
= MARKET (SELL) ORDER |
$ 0 |
All that's left to figure is PORTFOLIO VALUE ($7,409 + $5,134 = $12,543.)
Readjusting Cash/Stock Ratio
We are going to do an important step to increase our profits – readjust the cash/stock ratio. When we started out, we used 2/3 stock and 1/3 cash. Checking after one year, we find that the percentage of cash has increased. We want to take this excess cash and buy more stock with that. Our PORTFOLIO VALUE was $12,543. 1/3 of that is $4,139. Our current cash amount is $5,134 so: $5,134 - $4,139 = $995 of extra cash. We use that extra cash to buy the + 72 shares you will see in the June 1995 spreadsheet entry. That's why you see (709) in BUY (SELL) ADVICE but the actual BUY (SELL) ADVICE is BUY 995 in MARKET ORDER BUY. I wanted to show you what you will do in this case.
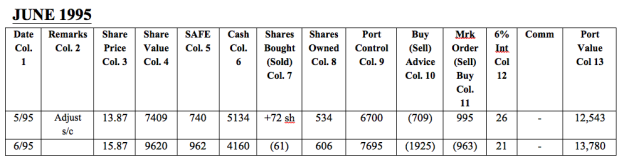
Onto June ‘95. The explanations are becoming shorter because you're getting smarter and seeing how easy this is. The SHARE PRICE rises to $15.87 a share. Write it down and then do columns 8 and 9. Column 8, SHARES OWNED, will increase by the 72 shares we bought last month with the excess cash (534 + 72 = 606). Column 9, PORTFOLIO CONTROL increases BY 100% of the MARKET ORDER BUY amount of $995. Whenever we first buy or add additional money to the system, we increase PORTFOLIO CONTROL by 100% – not the usual 50%. Thus column 9 is 6,700 + 995 = 7,695.
SHARE VALUE is 606 X $15.87 = $9,620. SAFE is always 10% of SHARE VALUE so SAFE is 962. CASH was affected by readjusting our stock/cash ratio. We started with $5,134 - $995 excess cash + INTEREST of $21 = $4,160. PORTFOLIO CONTROL is again smaller:
SHARE VALUE |
$9,620 |
- PORTFOLIO CONTROL |
7,695 |
= (SELL) ADVICE |
$1,925 |
- SAFE |
962 |
= MARKET (SELL) ORDER |
$963 |
You have a (SELL) MARKET ORDER. Divide $963 by the SHARE PRICE of $15.87 and you find that you sell (61) shares. Write in column 7. Then end the month by figuring your PORTFOLIO VALUE. $9,620 + $4,160 equals $13,780.
Let’s skip ahead several months since you should see how easy this works. Again, in my complete book if you ask for it you will see all of these months in full detail. Let’s jump ahead to April 1996.
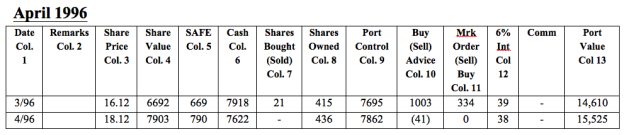
Onto April 96. SHARE PRICE is $18.12, up $2 from last month up. Go to columns 8 and 9. You bought 21 shares last month so your SHARES OWNED has increased from 415 to 436. PORTFOLIO CONTROL will increase since we did buy stock. Divide 334 by 2 and add that amount to PORTFOLIO CONTROL (334 divided by two = 167 + 7,695 equals 7,862). Write these two numbers in. SHARE VALUE is 436 X $18.12 equals $7,903. SAFE is 790. CASH is $7,918 - $334 + $30 INTEREST = $7,622. Again compare PORTFOLIO CONTROL and SHARE VALUE and SHARE VALUE is slightly higher. Do your calculations:
SHARE VALUE |
$7,903 |
- PORTFOLIO CONTROL |
7,862 |
= (SELL) ADVICE |
$41 |
- SAFE |
790 |
= DO NOTHING |
$0 |
All that's left is to figure is PORTFOLIO VALUE. It's $7,903 + $7,622 = $15,525. So on this example that is a real stock, you would be ahead 55% for two years. Study this example and you'll see how you made your profit. The stock went steadily up for almost 2 years. Buy low and sell high shouldn't only be a cliché. It should and is put into practice through the system and produces the results you want from an investment.

Other System Mechanics Worth Knowing
- ADDING ADDITIONAL MONEY
I didn't include an example of adding additional money to a stock. It is very easy. If you have for example an additional $1,000, you tell your broker to buy $500 worth of LEAPS and put $500 in your money market account ( on a 50% LEAPS, 50% CASH type of investment).. Then you increase PORTFOLIO CONTROL by the same amount ($500) you bought LEAPS with. Make a separate line on your spreadsheet to show the increase. Change all the columns that need changing. See chart for Claire’s Stores at the end of this Chapter for an example. It's very easy to add money to an existing stock. You should do it to increase the size of your investment and decrease the cost of commissions and increase profits. As you read later, you should try to build up to 10 stocks, ETFs, closed-end funds, LEAPs to reduce risk. Also I recommend only adding money to an existing stock when the stock price is at or near its 52-week low.
- SKIPPING A MONTH
In several charts in my free full-length book, you'll see dashes across one whole month except for INTEREST. For these months you skipped the system – it's not a rigid system you must do every month or whatever schedule you use to check on your investments with AIM. For these months the only thing that happened was earning INTEREST on your CASH. You only needed to write in the INTEREST earned that month and then you added and then next month you can add two months INTEREST the next month when you go back to the system.
- STOCK SPLITS
Another thing I wanted to tell you. For stock splits, I figured the split after any of the transactions. For example, if you own 500 shares, sold 100 shares and then the stock split 3-for-2 then your calculations were: 500 – 100 = 400 X 1.5 = 600 shares now owned. You only need to change the SHARES OWNED column. I have included a blank spreadsheet you can copy to use at the end of the PDF version of my book that you will receive for free after buying this e-book version.
- READJUSTING THE CASH/STOCK RATIO
One last item. At least once a year, readjust the stock/cash ratio to whatever ratio you are using for your particular type of investment. Different types of investments could have a different ratio between CASH and STOCK. I didn't do that in this chapter except once to keep the example simple. It's easy. Once a year I adjusted the stock/cash ratio back to 1/3 cash and 2/3 stock.
If the CASH balance was higher than 1/3 of the PORTFOLIO CONTROL, I took the excess CASH and bought more shares, and increased PORTFOLIO CONTROL by 100% of the CASH amount I used to buy more shares. Look at how I did it and you'll understand. Do this anytime you readjust the cash/stock ratio.
Remember when we are investing in long-term options (LEAPS) we start with 50% LEAPS/50% CASH. We need to adjust the Cash/LEAPS ratio back to 50%-50% when it gets out of balance – for ex. If LEAPS are worth $8,000 & Cash is worth $12,000 – then we want to get back to $10,000 LEAPS - $10,000 Cash. We take $2,000 from Cash and use it to buy more LEAPS contracts. Normally we can’t get exactly 50%-50% but just get closer to 50-50 ratio by buying closest number of contracts you can.
At the end of Chapter 2 in the PDF free full-length version of my investing book, you will find a spreadsheet showing Claire’s Stores for the entire two years and you will find a blank spreadsheet that you can you can use to set up a Word spreadsheet to do your investing online. Below I am also including the table for all two years of Clair’s Stores and the blank spreadsheet here. Please email me if you would like the actual file that shows these results.


––––––––