Now that we've properly configured our project, let's take a look at the tool itself.
Let's use the following code, for the sake of having a simple, working command-line Hello World! application:
class Hello {
    func world() {
        print("Hello, World!")
    }
}

let hello = Hello()
hello.world() // set a breakpoint here
The preceding code is pretty simple; it just prints Hello, World! in the console.
With a breakpoint set on the hello.world() line, run your program, and, in the Debug toolbar, hit the icon that looks like a graph. It will open the Memory Graph Hierarchy tool:

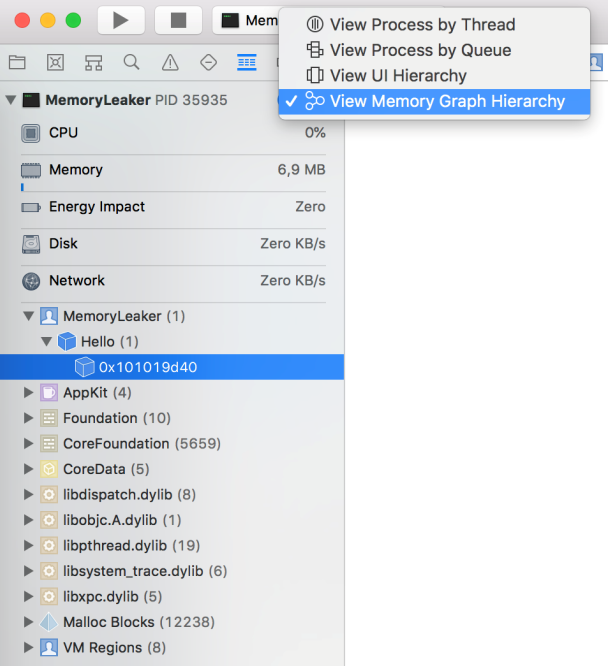
You can also access it from the debug navigator menu, as follows:

Voilà! We get the result shown in the following screenshot:

This is the grandiose memory debug tool. As with many tools within Xcode, the screen is split into three main components:
- On the left, you have a list of all of the allocations that are still living in the process, and our single hello instance is currently selected
- In the center, there's an interactive view of the memory, with the relations that our object has with other objects
- On the right, there's the information panel for the selected object, with some details, and, most importantly, the stack that led to its allocation
There are two very useful shortcuts that are also presented in this screen, shown as follows:

The shortcuts are as follows:
- The first icon, which looks like a book, jumps to the definition of the object
- The second one prints the description in the debugger
This tool is very powerful, and it's very important to master it. It will ultimately help you to better understand how your applications and projects behave. While for the sake of demonstration we used very simple code examples, and they didn't yield any issues, in the next section, you'll see the most common issues that you may encounter while tracking down memory leaks.