CHAPTER 12
INVENTORY MANAGEMENT AND CONTROL
12.1 What is Inventory?
Inventory refers to all items related to the firm's inputs and output, which would be stocked up. It includes three types:
- Raw material for production
- Work-in-process or any partially produced items, which are out of the intermediate phase of production
- Final product that is ready to be sold
Usually, market demand for a product would play a direct and significant role in the estimation of the level of the third type of inventory, the final product. Once this part has been estimated, it should become clear to estimate the required levels of the raw material, and intermediate products that are required to produce and maintain the inventory level of the final product. Inventory is a significant and expensive part of the firm's total investment. Its value could reach to half or more of the value of all assets. This monetary significance is one reason why inventory planning and control is crucial for most businesses. The other reason is its paradoxical role in the general business planning. On the one hand, inventory level needs to be enough to smoothly satisfy market demand and avoid any stockouts and backorders, as well as avoid any potential dissatisfaction by customers who could be lost to competition. On the other hand, any financial manager would like to keep the cost of inventory down by minimizing its level and freeing up funds for other purposes. Furthermore, another kind of contradiction involving inventory level is an administrative one. It stems from different functions of many departments within the firm. While finance departments want to minimize the level of inventory, the marketing department may call for raising it up and be ready for any increase in market demand for the final product. The manufacturing department would hope for an uninterrupted production and wants to keep some leeway in all material and middle products, while purchase departments would be concerned with satisfying the need for raw material, securing its sources, and obtaining better prices.
Inventory management and control aims to achieve the optimum level of inventory that would strike the best possible balance between the firm's conflicting objectives for the inventory. The common managerial tools to achieve such control are the ABC analysis, the economic order quantity (EOQ), and the reorder point (ROP).
Inventory Functions
Basic inventory functions can be described as to help the firm to
- achieve operational flexibility by assuring a smooth, consistently timed, and efficient production, which can run without any delays and interruptions;
- avoid product outages and material stockouts;
- save on purchases with quantity discounts;
- regulate product supply if the need arises;
- store seasonal products, material, and even storing hours of work as they are embedded in the prepared and ready material, and partially produced products.
Inventory Cost
Building and maintaining inventory comes with certain costs to the firm. The following are the major types of inventory costs:
- Cost of the purchased material
- Cost of ordering the material
- Cost of carrying and storing the material and products
- Cost of material outages and product stockouts
Of special interest is ordering cost and carrying cost. Ordering cost is the aggregate cost of all clerical activities and materials related to placing an order. It is fixed and measured as per the order cost, regardless of the size of the order at the time the order is placed. It includes all the costs of
- – preparing and sending purchase orders
- – following up on orders, receiving and inspecting all incoming materials
- – calculating and paying for orders
- – all utilities and supplies involved in the ordering process
- – all payments made to people who handle orders
Carrying cost (also called holding cost) is a per unit cost of holding and storing material in an inventory for a certain period of time. Unlike the fixed ordering cost, carrying cost is variable, and includes the following costs:
- – Warehouses and their utilities, equipment, and supplies
- – Payments for warehouse staff
- – Damaged, stolen, and obsolete units of inventory
- – Insurance payments related to the inventory and its storage
- – Taxes related to the inventory activities
- – Cost of capital
ABC Analysis
ABC analysis is an inventory classification system by which inventory is classified into three groups, A, B, and C. They are ordered based on how much the firm is investing in them. Category A is the most investment-intensive, but it constitutes the least portion of the inventory. The high investment in category A would require the most attention, the most accurate records, and the tightest control. Category B comes next in terms of the amount of investment, but it constitutes a higher portion of total inventory than that of category A. It is, therefore, of less importance than category A requiring a less tighter control. Category C constitutes the majority of inventory and requires the least investment and least control. Table 12.1 shows an example of the distribution in the ABC system.
Table 12.1 The ABC System of Inventory
| Category | % of total inventory | % of total investment | Control Level |
| A | 15 | 75 | Heavy |
| B | 20 | 15 | Average |
| C | 65 | 10 | Light |
| Total | 100 | 100 | Full control |
The idea of the ABC system is based on “Pareto principle” or, as it is called sometimes, the 80–20% rule. It goes back to 1906 when the Italian economist Vifredo Pareto observed that 80% of land in Italy was owned by 20% of the population. It became more intriguing for him to discover that many events had a similar distribution, even regarding the beans in the garden. He noticed that about 80% of the peas came from only 20% of the pea pods. Others started to observe many events in different fields and came up with a confirmation. We should emphasize that the 80/20 proportions do not have to be exact all the time. For example, close percentages such as 77/23 are also valid to be within this rule. In business, people noticed, for instance, 80% of sales are made by 20% of the salespeople, and 80% of product is purchased by 20% of customers. In addition, 80% of profit is due to 20% of investment. The general mathematical formula for this principle is that if the cause is K%, the effect would be (1 − K)%, where K is assumed to be more than zero and less than 50.

12.2 Economic Order Quantity (EOQ)
Economic order quantity is a simple, straightforward, and widely used method of inventory control. Its application goes back to the turn of the 20th century when it was used to calculate the optimum amount of order a firm would place for its inventory items. The method is still used to serve the same purpose with some modifications.
The major objective of the method is to minimize the total cost of inventory. The emphasis is placed on both the ordering and carrying costs, since the cost of ordered items themselves are assumed to be constant.
The annual ordering cost would be equal to the number of orders placed in a year times the cost of placing an order (C0). Number of orders per year is equal to the annual demand on an item (D) divided by the number of units of that item in each order, which is the amount of inventory order (Q).
The annual carrying cost would be equal to the annual inventory order (Q) times the carrying cost per unit (Cc). Since the inventory order amount is assumed to decrease throughout the year at a constant rate in response to the assumed constant demand, it would be wiser to calculate the annual average amount, which would be  . Figure 12.1 shows the average as illustrated by the dashed line, which goes across all of the midpoint of Q as it drops during the year from a maximum (Q), which is the amount of order as it arrives, to zero when it is used up, and a new order is placed.

Figure 12.1 Inventory Level Over Time
Since the annual total cost of inventory is minimized when annual ordering cost equals the annual carrying cost, we can equate Equations 1 and 2 and solve them for Q, which would be the amount of order that achieves the minimum total cost, or as we call it (EOQ). Figure 12.2 of the three costs shows the equality between ordering cost and carrying cost as it occurs in the intersection point e. This point of equality corresponds to point m, the lowest point on the total cost curve. Point e also indicates that this equality occurs when the amount of the order is at point A, which is to be considered the optimum amount that would achieve the minimum total cost, and therefore, level A of inventory would be the economic order quantity (EOQ).
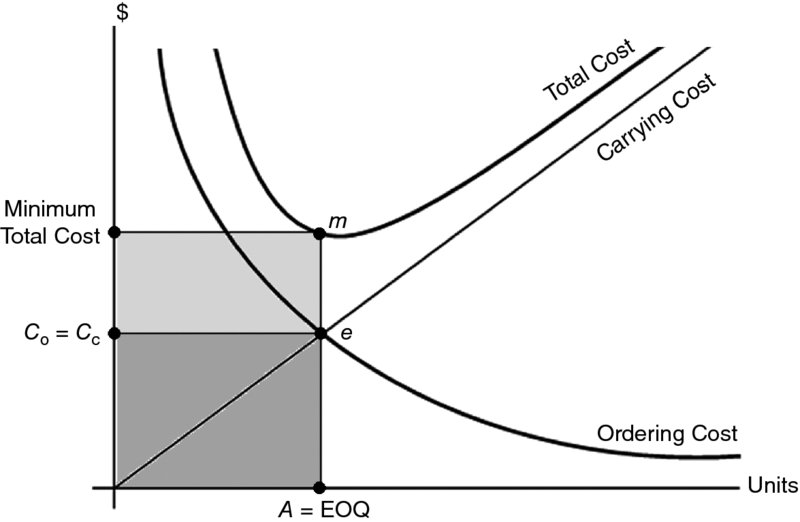
Figure 12.2 Inventory Carrying and Ordering Costs
Let us now depict what happens in point e, mathematically.
Annual ordering cost = Annual carrying cost

where D is the annual demand or number of units of an inventory item which the firm orders per year. C0 is the ordering cost per order. Cc is the carrying cost per unit per year.
Example An appliance company uses one motor per assembled refrigerator. It sells 1296 refrigerators a year. It costs the company $50 in ordering costs every time an order of motors is placed. It also costs the company $4 per unit to store the received motors and have them ready for assembly. What would be the optimal number of motors to order each time?
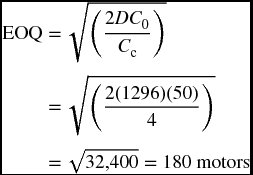
Example Calculate the total cost of inventory for the motors in the last example and verify that the calculated economic quantity of 180 achieves the minimum cost. Also verify that the minimum cost occurs when ordering cost equals the carrying cost.
Since the total cost is a sum of ordering cost and carrying cost, we can calculate it this way:
The minimum total cost is $720, split equally between $360 ordering cost and $360 carrying cost.
In order to prove that $720 is indeed a minimum cost when 180 motors are ordered each time, we should try to calculate the total cost for an order lower and higher than 180 motors to see what happens to the total cost.
Let us try two values for Q, 160 first and 200 second.
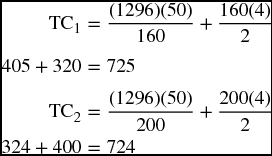
Comparing the total cost of $720 (when Q = 180) with TC1 = 725 (when Q = 160) and TC2 = 724 (when Q = 200) proves that the EOQ = 180 does, indeed, assure the minimum total cost.
It should be noted that sometimes instead of having the company cost per unit (Cc) given in the question, we may be given the total annual carrying cost for all inventory (Cac) and the inventory average value (V). In this case, we get the average carrying cost for the item as a percentage by dividing Cac by V. Multiplying this average by the unit cost of the item (or the purchase price of the item, P), we get the value of Cc.

and the EOQ formula would be adjusted as:
Example Suppose we consider the same situation of the appliance company in the last example but we are given
- the total sale or demand: 1296 units;
- ordering cost per order: $50;
- carrying cost for all inventory: $360;
- total inventory value: $18,000;
- purchase price per motor: $200.
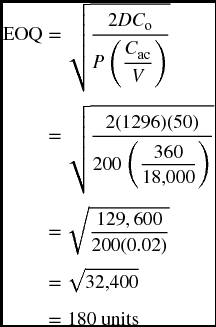
The EOQ would be obtained by using the adjusted formula
EOQ for Quantity Discount
As we have seen in the Economic Order Quantity formula, only ordering and carrying costs were considered as components of the total cost of inventory. The cost of the inventory items was not considered for being assumed as constant, and therefore would not be significant in minimizing the cost of inventory, as it is the major objective of the EOQ formula and the target for inventory management and control.
Quantity discount is an opportunity for the firm to take advantage of a lower price per unit for its purchases if the volume of these purchases reaches a certain level. The possibility of buying at a lower price makes it plausible for the cost of purchased items to be part of the total cost of inventory before trying to minimize it. The total cost of inventory (Equation 4) would be adjusted to

where DP is the new addition to the right side. It is the cost of purchased items, which is obtained by multiplying the annual demand (D) by the price per unit (P).
Suppose that the company that sells motors in our previous examples offers prices lower than $200 per motor for purchased quantities that exceed 180 units:
|
$200 $195 $193 |
for |
0–500 units 501–1000 units 1001+ units |
The first thing we have to do is to calculate the EOQ for each price and, of course, we have to use the EOQ formula that contains the price per unit (P), Equation 5.

The second EOQ (182 units) is still below what is required for the price of $195 which cannot be obtained unless the purchases fall in the second range of 501–1000 units. So, the firm can try to see what if it purchases the minimum just to get into the range! That would be to purchase 501 units at $195 per motor. The same try can be made with the third range so that we can say what if we buy only 1001 units just to get us into the third range and enjoy a price of $193 per motor.
Now, we can estimate the total cost if we actually buy those minimum quantities to get into the ranges. After calculating the total cost using each of the minimum quantities as Q, it will be clear what total cost is the least.
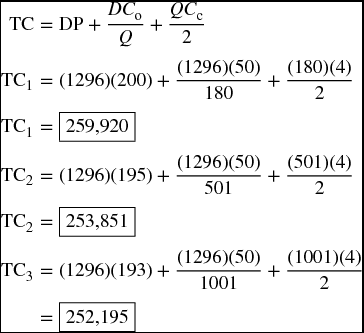
Now, we know that if we purchase 180 motors at $200, total inventory cost would be $259,920. A second option is that we purchase 501 motors at $195 each, with total inventory cost of $253,851, or go with the third which is to purchase 1001 motors at $193 with total inventory cost of $252,195. Here, we can make a choice considering what we gain versus what we lose. Taking the second option means cutting the total inventory cost by $6,069 (252,720 − 259,200) which is 2% of the original cost for having to purchase 321 more motors (1.78%). Taking the third option means cutting the total inventory cost by $7725 (250,128 – 259,200) which is almost 3% of the original cost for having to purchase 821 more motors (4.56%). This is four and a half times more purchases. A wise manager would consider other factors such as the possibilities of damage, theft, conditions of storage, obsoleteness, and all other factors that may become more relevant to buying more than the usual EOQ. Table 12.2 lists all of the related information together for comparison of the three possible prices in order to make the best decision based on inventory cost.
Table 12.2 EOQ and Quantity Discount
| 1 | 2 | 3 | 4 | 5 | 6 | 7 | 8 | 9 | 10 | 11 |
| Quantity | Price Per Unit, P | Order Size, Q | Cost of Purchase, DP | Ordering Cost, Co | Carrying Cost, Cc | Total Cost, TC 4 + 5 + 6 | Change in Total Cost, ΔTC TC2–TC1 | Percent Change in Total Cost, %ΔTC  |
Change in Order Size, ΔQ1 − 3 Q3 − Q1 | Percent Change in Order Size, %ΔQ1 − 3  |
| 0–500 501–1000 1001+ |
$200 $195 $193 |
180 501 1001 |
259,200 252,720 250,128 |
360 129 65 |
360 1002 2002 |
259,920 253,851 252,195 |
−6069 −7725 |
2 3 |
321 821 |
1.78 4.56 |
EOQ for the Production-Run Model
The production-run model refers to the firms which would produce what they need of inputs to their own production instead of buying them from other sources, or contracting out other firms. In this case, these firms would not need to order certain products, as much as they need to make them internally. As for calculating the Economic Order Quantity (EOQ), or as it should be called the Optimal Input Production (OIP), the ordering cost would be replaced by a setup cost that includes the cost of design and setup of equipment, payroll for those who run the production, administrative costs, and all other related expenses. Technically, calculating the EOQ or OIP here remains the same except slight modifications. One notable difference is that the inventory would build up gradually as the input is produced, unlike the previous case where the inventory peaks after receiving the order and declines toward placing another order. This difference requires involving the daily demand, daily production rate, and days of production as new variables. However, the major premise of equating the setup cost with the carrying cost remains the way to minimize the inventory cost.
Recall that the annual ordering cost was equal to  the annual setup cost would be
where the only difference is replacing the ordering cost (Co) by the setup cost (Cs).
As for the carrying cost, we need to modify it further. Let us start with the maximum level of inventory during the production cycle. It should be obtained by subtracting what the firm uses of input products from what is produced during the production run. What is used should equal the production period (t) times the daily demand (d), and what is produced should equal the production period (t) times the daily production (u). That is,

Since ut = Q

then
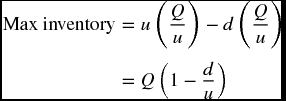
Just like when we previously divided by 2 to get  the average inventory here can be obtained by dividing the maximum level by 2.

and the
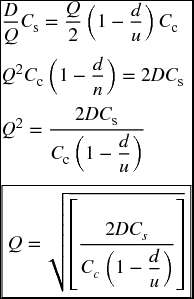
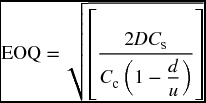
And this Q is in fact the EOQ or OIP.
Example Suppose that our last firm produces freezers too. The annual demand is at 9000 units. Freezers need motors, which is also produced by the same firm at a setup cost of $95 and carrying cost of $5 per unit. The firm can produce 60 motors a day of the 200 days of operation per year.
- What would be the EOQ or OIP?
- How many production runs are required, and how long is each run?
First, let us identify the variables.
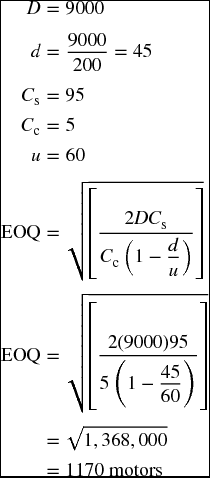
We can get the number of production runs by dividing the total annual demand by EOQ.

Also, by dividing EOQ by the daily production of inputs (u), we can figure out how many days it will take to complete the production run.

12.3 The Reorder Point
After determining the economic order quantity, the next question would be when to place an order for that quantity, and if there is an optimal time to order. The answer is in a simple technique called the ROP which helps identify the point at which an inventory order should be placed. This point is expressed by a number of units of the inventory item. It would basically refer to the minimum quantity of that item that remains on the shelf when it is time to order a new batch of the EOQ. This amount is supposed to satisfy the regular daily demand during the time needed for the new order to arrive, but since there is always a possibility of change, either in the daily demand or in the order delivery time, it would be wise to give some leeway to the estimation and have some more items stored for such a possibility. Therefore, the ROP can be calculated as

where d is the daily demand on the inventory item. L is the lead time, which is the time the new order takes to arrive. It is specifically the number of days that lapses from the time of placing an order to the time of receiving it. ss is the safety stock, which is an additional quantity of inventory items carried to guard against potential increases in sales rate and/or delivery time. The main purpose of holding the safety stock is to avoid any stockout and minimize its economic and non-economic cost.
Figure 12.3 shows that point A represents the EOQ which would be gradually used until it reaches zero at point F. The slope of AF would reflect the rate of sale. The firm would not wait to bring more items until the shelf is completely out at point F. It would place an order earlier at point E. That is where there should be on the shelf an amount equal to C, enough to satisfy the daily demand during the lead time between E and F. At point F,
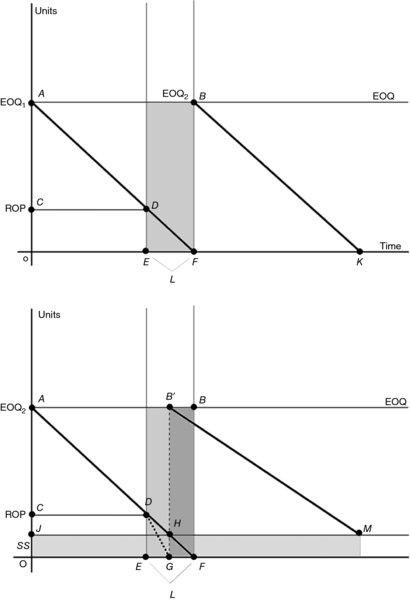
Figure 12.3 The ROP and Inventory Level
the new order would arrive and a full inventory starts again at point B. This process requires perfect conditions on all levels in order to go seamlessly from point zero to F, to point full inventory at B. Since the reality is different, the firm may very well face a higher rate of demand on the product or it could experience some delay in receiving the orders. The lower panel of the graph shows the possibility of facing a higher demand. It is represented by a steeper section of AF, such as DG. If the company sells more during the lead time, it could sell out before the new order arrives. Let us say the shelf would be completely out at point G instead of point F. Here, we can obviously see that point G would determine how much safety stock is needed to fill in the shortage represented by GH or OJ. In this case, it seems as if the new EOQ2 would start coming in earlier at B' instead of B. It would cover the time GF that was swollen already by the increase in sales. The new EOQ would not end at zero like it was at K, but it would end at M where there is still on the shelf an amount equal to the safety stock that will continue to be carried over.
Determining the Safety Stock Level
The most simple and straightforward way to decide how many items to keep as a safety stock is to estimate such a volume based on the log of daily demand throughout the firm's recent history, probably the last three years. If a manager wants to count for the worst case scenario, the safety stock level would be determined by the highest daily demand in the last three years. This would mean that the firm would be able to capture most of the odds. The manager can also consider the median value based on the highest and lowest daily demand in the firm's recent history, say the past 3 or 5 years.
Example If the daily demand on a product is 75 units and it takes 5 days to receive a new order, what would the ROP be given that the highest daily demand in recent history has once reached 105?
Since we are given only a single figure for a previous highest demand, we should use it as the safety stock.

The firm should place a new order when only 480 units of the product is left on the shelf.
However, if the manager wants to determine the safety stock by the median value of daily demand, and if he knows that the lowest is 31 units, then the safety stock estimate would be

and the ROP would be

In a more involved way, the safety stock would be determined using an assumed service level plus the statistical distribution of the daily demand during the lead time. Service level (SL) refers to the days of best customer satisfaction or the days in which no stockout of items faced the firm's customers. It is basically calculated as

where P(sto) is the probability of a stockout.
Suppose that the daily demand of a product is normally distributed and that the mean (μ) and standard deviation (σ) are known, then the safety stock can be determined as

where ss is the safety stock, k the number of standard deviations, and σdt the standard deviation of demand distribution during the lead time
Note that k is based on a service level assumed by management. It would be a percentage that represents the large area under the normal distribution curve. Knowing that area would lead to knowing the number of standard deviations using the normal distribution table in the appendix.
Example Suppose that the daily demand of a product during the lead time is normally distributed with a mean of 126 units and a standard deviation of 7. Given that the management wants the stockout days to be no more than 3%. What would be the ROP?
Here, we need to calculate the safety stock first based on the service level. We are given the stockout level as 3%. This means that the service level is 97%. In other words, if customers potentially face only 3% of stockout, they would enjoy best days during 97% of time. Going to the normal distribution table in the appendix, we look up the area of 97% or the closest. Once we locate it on the table, we can read the number of standard deviations (k) out of the vertical and horizontal values of the table. The closest value to 97% is 0.9706. Looking up the vertical value of 1.8 and the horizontal value of 0.09, we conclude that the number of standard deviations (k) is 1.89. Now we can calculate the safety stock:

In Figure 12.4, we see that the service level occupies the largest area under the normal distribution curve (0.97062) while the stockout level takes only about 3% (0.0294). We can also conclude that knowing ROP, μ, and σ enables us to calculate k as

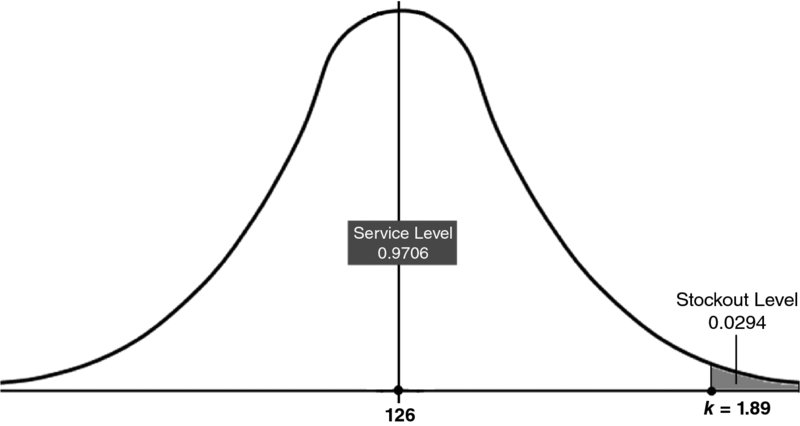
Figure 12.4 Service Level and Stock-Out Level Under the Normal Distribution
Note that μ, the normal distribution mean, is representing the first term in the ROP formula (dL). However, either d, the daily demand on the product, or L, the lead time, can be a variable or a constant. If either is a variable, it would be identified by an asterisk, where the value would refer to the mean of its normal distribution. If it remains without an asterisk, its value would refer to a constant. The safety stock (ss) formula would be adjusted accordingly. The following are three modifications:
First modification

This modification is used when demand is a variable and represented by the mean value of its normal distribution (d*) while lead time is a constant (L). The ROP formula would be
Example Consider a product, the demand of which is normally distributed, with a mean of 250 and standard deviation of 10 and lead time of 4 days. Given that the desired service level is 98%, find the ROP.
First, we have to pay attention that both d and L are given, but d is the mean value and L is a constant. Therefore, the right formula for the ROP would be Equation 9. Second, we need to refer to the table to find k at the closest value to 98%. The table reveals that the closest value to 98% is 0.9803, where k would be 2.06.

which means that the safety stock is only 41 units.
Second modification

This modification is good for the case of having the lead time in a normal distribution and the value of L would be a mean value (L*), while the daily demand remains constant. The ROP formula would be adjusted this way:

Example If the daily demand for a product is 50 units fixed by a contract, the lead time is a variable and normally distributed with a mean of 7 days and standard deviation of 2, how would the estimated ROP be different if we keep the same service lead at 98%?

which means the seven days until the delivery are going to carry the expected demand of 350 units and the safety stock would count for any changes in the lead time by having an extra 206 units.
Third modification

This modification is used when both daily demand and lead time are variables and normally distributed. The ROP formula would be adjusted this way:

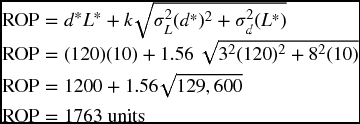
Example The daily demand for a product is normally distributed with a mean of 120 units and standard deviation of 8. The lead time is also normally distributed with a mean of 10 and standard deviation of 3. This company wants to keep the stockout level at no more than 6%. Calculate the ROP.
The closest value to 94% in the table is 0.9406 which means that k would be 1.56.
12.4 JIT-Inventory System
JIT stands for just-in-time. It is a method to minimize the use of storing the inventory and eliminate warehouses. It depends on timing and coordinating the delivery of inventory right at the time it is needed. It has been popularized by the Japanese and known as the “Kanban” system. It is commonly used in production stations and assembly lines. This system successfully reduces the inventory level and its cost to an absolute minimum. With JIT, there would not be a need for the EOQ and ROP because of the shortcut between production or delivery and use of the inventory items. The high efficiency of the JIT system requires a sophisticated design, high level coordination, and precise timing. It would also require an effective system of communication among the related stations from supply, to production, to transportation to assembly. The high success would also mean a high potential failure if the system is not up to par and perfectly operated.
12.5 Summary
This chapter was on inventory management and control. It started out by explaining what inventory is, its basic functions for the firm, its cost, its significance, and the importance of managing and controlling it. This was followed by an explanation of the ABC analysis as a classification system for the inventory based on how much investment is allocated to different types of inventory items. The most important topic in inventory management and control came next. It was the Economic Order Quantity (EOQ) and the ROP. Through these topics, we were able to distinguish between the carrying cost and ordering cost, see them graphically as curves, and have numerical examples to use them in obtaining the economic quantity. We also got to know a variety of issues involving the economic quantity such as calculating the EOQ for quantity discount, and for the production-run model. In the ROP, we got to learn how to calculate the firm's safety stock which refers to the minimum quantity of an inventory item that should remain on the shelf when it is time to place a new order. With numerical examples we saw how the ROP can be differently calculated based on the service level and the statistical distribution of either the demand on item or the lead time. The lead time being the number of days it would take the new order to arrive. Three adjustments were shown to the calculation of the ROP following three different modifications to the available information. The final topic here was a brief description of the meaning and importance of JIT-inventory system, which is a method to minimize the inventory storing function, and synchronizing the production needs of items with their arrival to the production line.
Key Concepts
- Inventory
- Inventory management ABC Analysis
- Economic Order Quantity (EOQ)
- Reorder Point (ROP)
- Ordering cost
- Carrying cost Holding cost
- Optional Input Production (OIP)
- Lead time
- Safety stock
- Service level JIT-Inventory System
Discussion Questions
-
What is inventory and why is it important for the firm?
-
List and briefly explain the inventory functions.
-
What would constitute the inventory cost? List three components of the cost.
-
What is the ABC system of inventory and how did it come about?
-
What is the ordering cost and what is the carrying cost? Illustrate how they are related on a graph.
-
How would the quantity discount affect the calculation of the EOQ? Give a numerical example.
-
How would the EOQ be different for a firm that produces its own inputs internally? Give a numerical example to illustrate the adjustment to the EOQ calculation.
-
What is the ROP? Explain and give numerical example to calculate it.
-
What is the safety stock? Show how its calculation can be different when the demand or lead time becomes either constant or variable.
-
What is JIT-inventory system and how significant is it to reduce inventory cost?


