- Create simple DAX measures (Average, Min, and Max) and then Date Intelligence measures to support a comparison of performance monitoring counters against prior time periods or baselines:
Available Memory MB (Today) = CALCULATE([Available Memory (MB)],
FILTER(ALL('Date'),'Date'[Date] = [Current Date]))
Batch Requests per Sec (Yesterday) = CALCULATE([Batch Requests Per Sec],
FILTER(ALL('Date'),'Date'[Date] = [Yesterday]))
Min Available Memory MB (Today) = CALCULATE([Min Available Memory (MB)],
FILTER(ALL('Date'),'Date'[Date] = [Current Date]),ALL('Time'))
- Create a report page based on the performance monitor counters that addresses top visibility needs such as "How is performance today?" and "How close are we to resource thresholds?"

Performance Monitoring Report Page Leveraging Windows Performance Monitor Counters
Two gauge visuals and two KPI visuals are used to display the highest priority counters relative to predefined thresholds or baselines. For example, Disk Seconds per Read is highlighted in green given the lower value than the goal of .003, and disk seconds per write is highlighted in red due to the higher value than the goal of .004. All four visuals respect the hour filter control (a custom Chiclet Slicer) from the lower left, and a Minute of Day Time data type column from the Time dimension table is used for the KPI Trend. A Today's High and Low Values group of Card visuals ignores the Time filter selection (for example, 9:00 PM from the slicer) but applies the current date filter. CPU (% processor), batch requests per second, and available memory are plotted against the prior day values in the line charts in this example. Seven-day and 30-day average measures are commonly used for the performance baseline.
- Create DAX measures to identify database instance configuration changes:
Config Value = If(AND(HASONEVALUE('Configuration Values'[ConfigurationID]),HASONEVALUE('Date'[Date])),
MAX('Configuration Values'[Configuration Value]),BLANK())
Config Value (Today) = CALCULATE([Config Value],FILTER(ALL('Date'),'Date'[Date] = [Current Date]))
Config Value (Yesterday) = CALCULATE([Config Value],FILTER(ALL('Date'),'Date'[Date] = [Yesterday]))
Config Change (Today) = IF([Config Value (Today)] <> [Config Value (Yesterday)],
"Config Change", "No Change")
Config Changes = IF([Config Value] = [Prior Day Config],0,1)

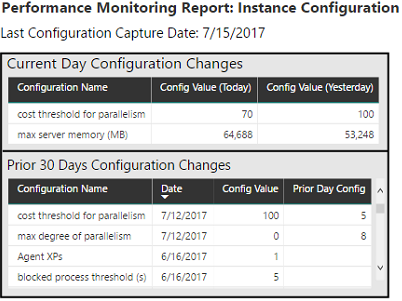
Instance Configuration Report Page: Current Day and Trailing 30-Day History of Changes
The Current Day Configuration Changes table visual uses a visual-level filter on the Config Change (Today) measure created earlier such that only changed configurations (for the current day) are displayed. The Prior 30 Days Configuration Change table visual uses two Visual level filters. One filter is applied to the date column from the Date dimension table and uses the relative date filtering feature to retrieve the past 30 days but exclude the current day. The other filter condition is applied against the Config Changes measure created earlier; this filter is set to is 1.
- Create similar DAX measures for the Wait Statistics table, such as current day average wait seconds.
- On a new page, compare the average of the current day's wait statistics capture data against a prior date.
"Wait statistics are probably the single best way to start troubleshooting a SQL Server performance issue. SQL Server knows why execution is being stalled (i.e. why threads are having to wait) so using this information to identify bottlenecks and avenues for further investigation can dramatically reduce the time it takes to diagnose the cause of workload degradation."
- Paul Randal, CEO of SQLskills, Microsoft Data Platform MVP

Wait Statistics Report Sample: KPIs, Waterfall, and Scatter Chart visuals
In this limited sample of a wait statistics report, relative date filtering is applied at the page level, to only include the past 30 days, and thus the 30 day trend is displayed in the background of the two KPI visuals. Relative date filters are also applied at the visual level to the waterfall and scatter charts to include only the last two days and only the current day, respectively. The breakdown field well of the waterfall chart is used to automatically identify the largest drivers of the change in wait seconds (wait types) from the prior day to the current day.
A high-level wait statistics report can be used as a quick starting point of analysis to identify bottlenecks in a system. Additionally, with mature and predictable baseline data in place, the report can be used to troubleshoot performance degradation issues. For example, a sudden spike in PAGEIOLATCH_EX waits may indicate a missing index issue or related database schema or code change.