Chapter One
Everyone Leaves Online Breadcrumbs
Owen Mundy, an art professor at Florida State University in Tallahassee, became an internet sensation overnight in July 2014 when he launched a website called ‘I Know Where Your Cat Lives’, a data experiment pinpointing the location of pet cats all over the world, using metadata unknowingly provided by their owners. Mundy estimates that there are over 15 million images tagged with the word ‘cat’ shared on Instagram, Flickr and Twitpic currently.1 But what these photographers don’t know is that digital cameras and smartphones embed latitude and longitude coordinates in each image.
Professor Mundy realized that anyone could gain access to the geographic coordinates of the photographs if the users had not protected themselves through the appropriate privacy settings. ‘This wasn’t just my problem; it was the millions of users of social media who didn’t know,’ he said. Iknowwhereyourcatlives.com launched with a million cat snaps mapped to within eight metres of their location. It quickly went viral. The site now has 5.3 million photos of cats.
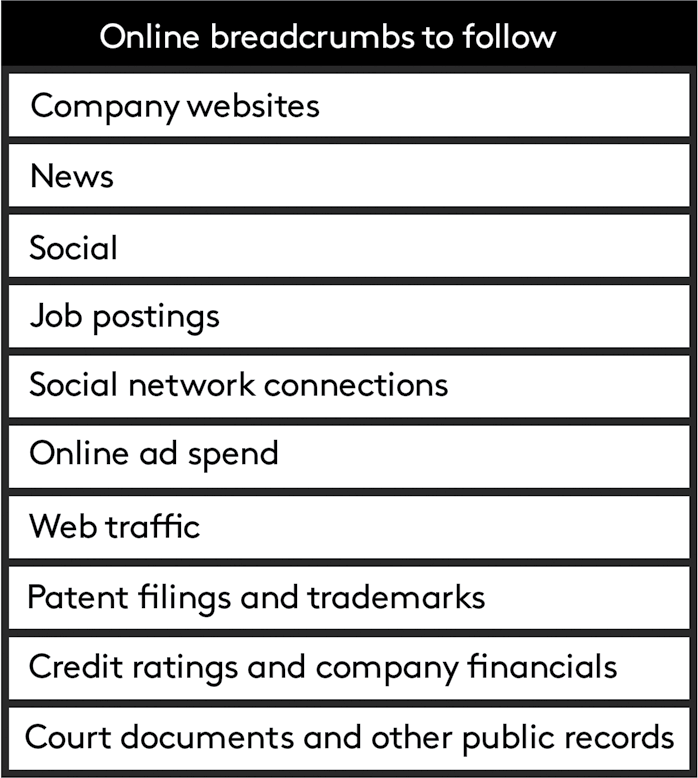
But the owners of the internet’s favourite animal are not the only ones leaving digital trails online. We all leave a rich trail of online breadcrumbs as we go about our lives in a digital world. But unlike Hansel and Gretel, we often leave these details unintentionally.
The internet is awash with photographs. Photoworld (part of Europe’s largest photo company, CEWE) estimated in June 2015 that 8,796 photos were shared every second on Snapchat.2 According to the same report, Instagram and Facebook users upload 58 million and 350 million photos every day respectively. Then there’s Weibo, WhatsApp, Tumblr, Twitter and a whole host of photo-sharing sites. In 2016, in the highly anticipated annual Internet Trends Report, Silicon Valley venture capitalist Mary Meeker, of Kleiner Perkins, estimated that in 2015 people uploaded an average of 3.25 billion digital images on the internet every day.3 With an estimated 3 billion people on the internet today, that represents 7.6 photos per person per week.
And it’s not just photos. We leave many more digital breadcrumbs out in the open with clues about our lives. When we tweet, we share our location, who we are with and what we are doing. On LinkedIn we list our education and work history. On Facebook we broadcast information about our whereabouts, what music we listen to, which brands we like, which organizations we support, which causes we champion, what and where we like to eat and which future events we plan to attend. Beyond the information that we actively produce and post publicly, our phones are full of apps recording our locations, who we talk to and text, and how we spend our time and money.
Every day we produce 500 million tweets,4 upload 350 million photos and click ‘Like’ 5.7 billion times on Facebook,5 write 100 million blog posts and upload 432,000 hours of video on YouTube.6 On Twitter and Facebook alone we share twelve items per week. Each of these items is a record in a publicly available journal documenting our whereabouts and what we are up to.
In this chapter we will take a closer look at what insights can be found by analysing the trail of breadcrumbs each and every one of us leaves online.
NYPD follows the Facebook trail
The wealth of online information that people leave behind has been noticed by the police. Indeed, they are increasingly using digital clues to piece together missing information, using online breadcrumbs as active components in solving crime. Ten years ago detectives would investigate an incident by interviewing witnesses and suspects. But people wouldn’t always tell the truth or would struggle to recall with the level of detail required. Today online breadcrumbs can bring to light crucial evidence.
For example, monitoring of Facebook by a special unit of the New York Police Department (NYPD) helped in June 2013 to convict the murderers of Tayshana Murphy, a teenage girl caught up in a dispute between two gangs. There were no witnesses to the event, but the NYPD was nevertheless able to build a strong enough case to convict two gang members, using evidence from online breadcrumbs on Facebook.7 Ten years ago, without the ability to follow and analyse these online breadcrumbs, the case would have had a very different conclusion.
On the day of the murder two messages were posted on the Facebook account of Carlos Rodriguez, aka ‘Loso’, who was associated with a rival gang of 3 Staccs, which operated out of Grant Houses, where Murphy lived and was murdered. The first read: ‘we had like five brawls in one day and then we left.’ Rodriguez’s second message stated: ‘somebody clapped the chicken girl in the head.’ ‘Chicken’ was Murphy’s nickname.
Although the identity of Murphy’s killer is still unclear – there were no actual witnesses to the event – two men were convicted of the killing. Tyshawn Brockington, twenty-four, was convicted of second-degree murder in June 2013. Ten months later Robert Cartagena, twenty-three, was convicted of intentional murder.
After Cartagena’s conviction, it became clear how significant the monitoring of social media had been to the NYPD investigation. In June 2014 the district attorney for New York County, Cyrus Vance Jr, announced the largest indicted gang case in the history of New York City.8 In total, the authorities arraigned 103 members of three gangs from the Morningside Heights area. The charges included two homicides, nineteen non-fatal shootings and fifty other incidents involving shootings. All of the defendants were charged with conspiracy to commit gang assault in the first degree, a charge that carries a sentence of five to twenty-five years.
To build their case, investigators and prosecutors had followed the usual procedural investigative routes – the gumshoe work of interviewing witnesses and other sources, monitoring 40,000 phone calls made from correctional facilities, combing through hundreds of hours of CCTV footage and phone records. They had also engaged in a form of police work that is becoming increasingly routine: they had reviewed more than a million social media pages. Facebook was the preferred social network of the gangs – in the indictment, the word ‘Facebook’ is used 171 times.9
Companies also leave breadcrumbs
Individuals are not the only ones leaving online breadcrumbs. Companies also leave an online trail. As companies invest in new products, launch marketing campaigns, establish partnerships and roll out other initiatives to increase their competitiveness, they leave a trail of online clues about their intentions, freely available for anyone to analyse.
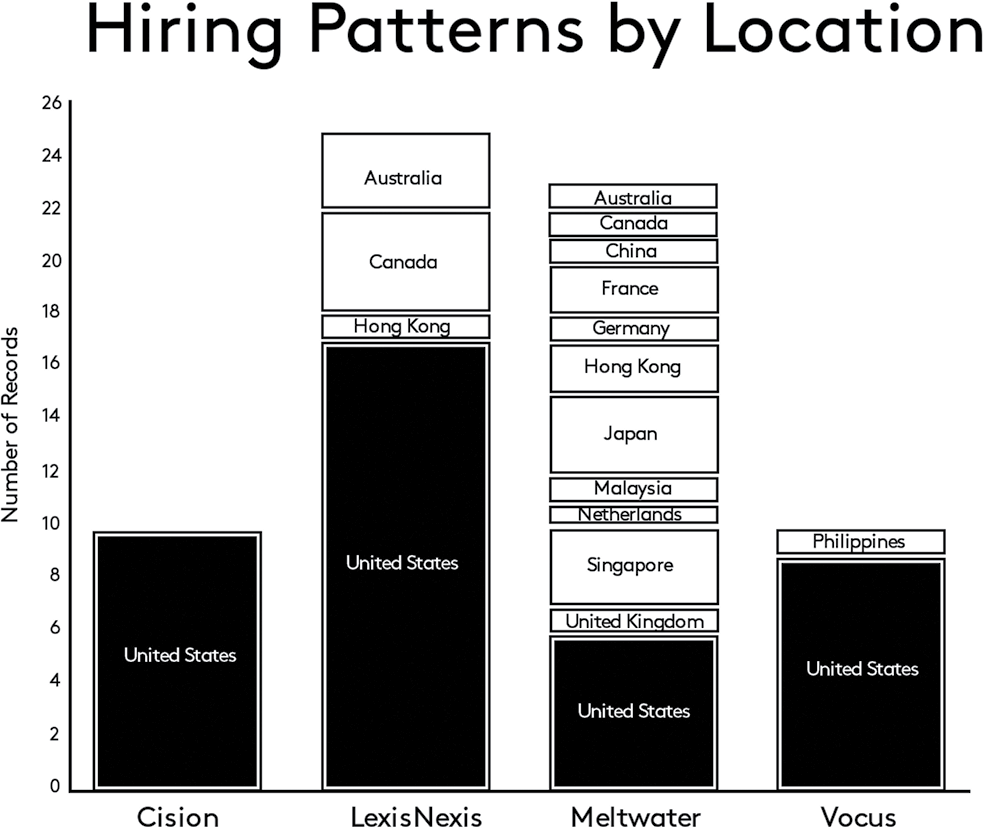
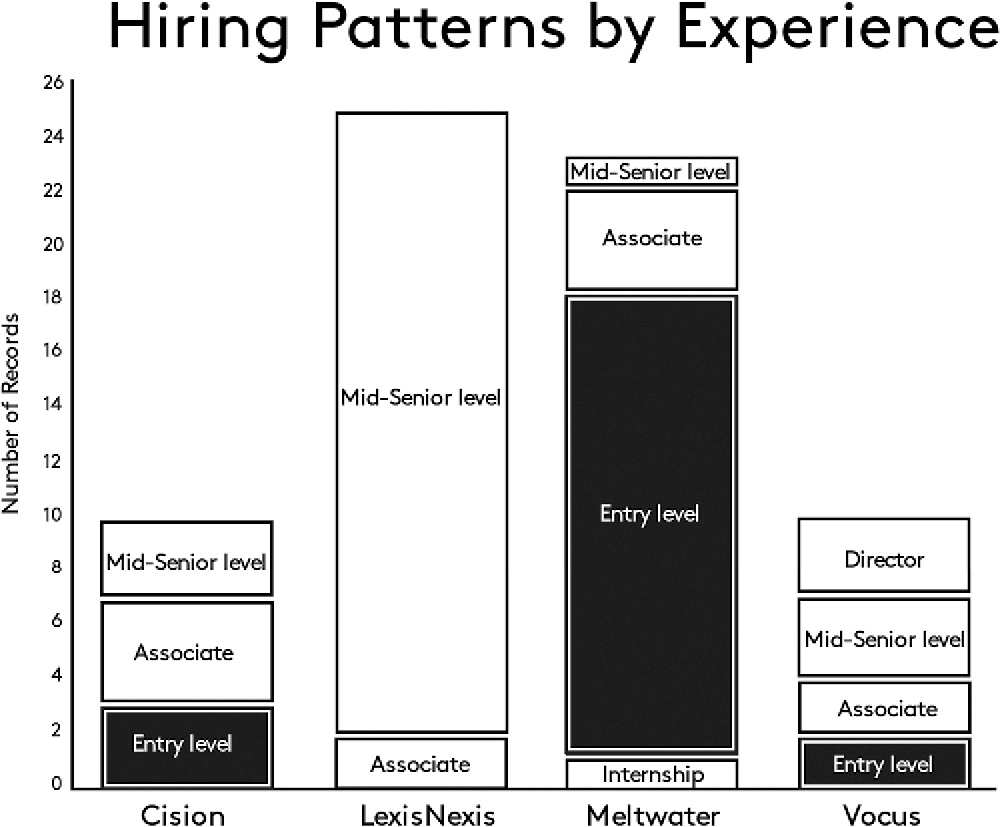
At Meltwater we undertook a small project to investigate what competitive intelligence could be extracted from job postings. We analysed data from all the job postings available on LinkedIn from 15 September to 15 October 2013 for Meltwater and three adjacent companies in our industry: Cision, Vocus and LexisNexis. We broke the data down by location, job type and required experience. It was astonishing to see how much information a simple snapshot of the hiring patterns among the four companies revealed in terms of difference in strategy, operational focus and company DNA.
The first thing that popped out of the data was the difference in rate of growth. Meltwater, Cision and Vocus were all about the same size at the time, but Meltwater had more than twice the number of job openings, indicating a significantly stronger growth rate. Vocus and LexisNexis had similar amounts of openings, indicating that they were growing at similar rates. LexisNexis was about twenty times the size of Meltwater, but had a comparable number of published job postings, indicating a significantly slower growth rate.
Studying the job postings by geography revealed very different market approaches. Cision only hired in the US and was clearly US-centric. Vocus also had most of its job openings in the US but had a few openings in the Philippines. This was a big surprise for us, but later we learned that Vocus offshored some lower-level work to the Philippines to reduce costs. Two-thirds of job openings at LexisNexis were in the US, with the rest in Australia, Canada and Hong Kong – all English-speaking markets. Meltwater had a distinctly different pattern. Our biggest single country of hiring was the US, but otherwise recruitment was very international, with openings across Australia, Canada, China, France, Germany, Hong Kong, Japan, Malaysia, the Netherlands, Singapore and the UK. Looking at the data, Meltwater was clearly more global in its approach than its peers.
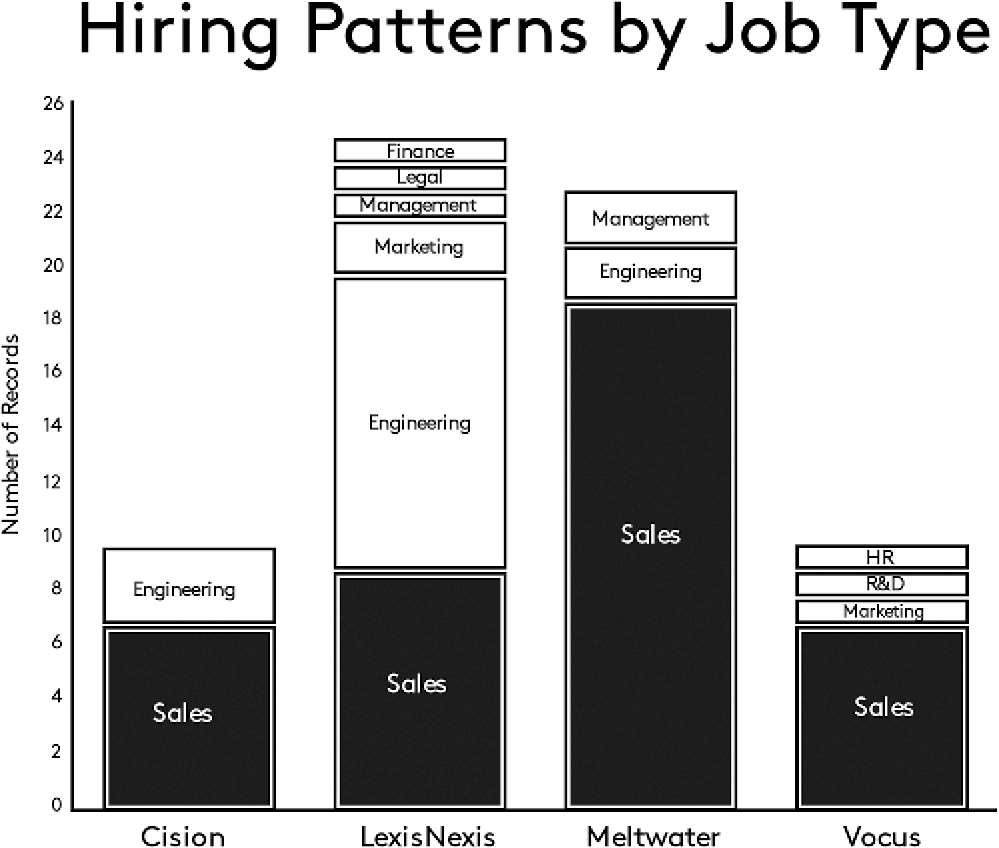
Studying the job postings by job type, a new and interesting pattern emerged. The majority of job openings in Meltwater, Vocus and Cision were in sales and marketing – 80 per cent, 80 per cent and 60 per cent respectively – whereas LexisNexis lagged behind with 44 per cent. Meltwater’s focus on growth was evident because we had roughly as many openings in sales and marketing as the rest of the peer group combined. Examining investment in engineering, the order was reversed. LexisNexis had as many openings in engineering as the rest of the group combined, signalling investments in new products.
Studying the job postings by experience level revealed more differences again. Vocus and Cision were both well rounded in the sense that they hired evenly across all experience levels. Meltwater primarily hired entry-level people, whereas LexisNexis recruited almost exclusively at mid- to senior level. Combining the data on LexisNexis’s focus on senior hires alongside product investment indicated that changes were on their way. It was later confirmed that LexisNexis was developing a strategic companywide new technology platform powering all its future content products.
This study was based on very limited data and represented only a single snapshot at a particular point in time. That said, this data snapshot tells a fascinating tale about four very different companies and their outlook.
The value of job postings doesn’t stop with competitive intelligence. Imagine if you also analysed the job postings of key clients, important vendors and other important stakeholders in your ecosystem. Used in a systematic and rigorous fashion, job posting data can help you understand your competition, which clients you should invest in, which suppliers to choose and which companies to partner with.
The indiscretion of LinkedIn connections
Another trail of online company breadcrumbs is generated from the connections created on social networks such as LinkedIn and, increasingly, Facebook. If the CEO of your company suddenly establishes a number of relationships on LinkedIn with buy-out firms, don’t be surprised if the company is for sale. If the CEO also establishes links with sell-side advisers, the significance could hardly be spelled out more clearly. If the latest relationships come from Goldman Sachs and JP Morgan, it is likely you are preparing for an IPO (Initial Public Offering). New relationships on LinkedIn can represent a chance encounter at a dinner party or signal the early stages of a new client, a new partner or a new employer relationship. If more than one relationship is created with a company, that is a tell-tale sign that this is about more than a chance encounter.
I try to be very careful about how I use social media. For example, recently I was in the process of evaluating whether or not to buy a data science start-up from Uruguay on behalf of Meltwater. A few months previously I connected with the company’s founders on LinkedIn – reluctantly at the time, but I thought it was rude not to accept the invitation. We met the company originally in order to evaluate a potential outsourcing job, which in itself was not a hypersensitive issue. However, anyone who discovered this connection and subsequently studied the start-up could see that the company had developed a successful developer community around a data science platform. If this was important enough for key executives of Meltwater to get involved in, it wouldn’t be hard to conclude that a data science developer community was a potentially important strategic roadmap for Meltwater.
Once we got to know this company better, we concluded that we wanted to explore a full acquisition of the company instead. As part of the due-diligence process I travelled to Montevideo, a good sixteen-hour journey from San Francisco, to visit the thirty-strong team. During my travels I was careful not to post my location on Twitter or Facebook. There were several group photos taken during my stay, but none was posted on social media. Before and after the trip I was cautious when speaking about it, and I was deliberately vague about my exact whereabouts and what I was up to.
The tales of a company’s website
The corporate website is an obvious place to look for clues about what is happening inside a company. There you can read about big client wins, awards and other significant accomplishments. Similarly, any changes to the executive team will be covered and fleshed out on the page containing management bios.
Companies use their website to share all the latest positive updates with their clients. In the process they are also inadvertently broadcasting that information to competitors and suppliers.
When Meltwater launched in 2001, one of the great selling points of our service was that we could notify you of changes to any web page. This was a very simple service, but it turned out that our clients loved it and used it to track their competitors with a lot more rigour than they had previously done. Using this service, they would be notified immediately if a competitor issued a press release, changed the prices of their products or launched a new sales campaign.
The messaging on a company’s website is carefully crafted by communication professionals. Studying what is being said and not being said can tell you a lot about a company’s market positioning and strategic intention.
Let us take a look at the front pages of the websites of four of the biggest tech companies in the world today and study how they position themselves.
In August 2016 Apple smears a photo of its newest iPhone across the whole page. There is no doubt about what they are pushing. Apple is, today more than ever, first and foremost the company behind the iPhone.
The message on the HP website is: ‘The 3D printing revolution starts now.’ HP positions itself as an innovative future-oriented company, building on its legacy as the world’s leading printer company.
IBM has a more complicated message: ‘IBM X-force, changing the way to act and share on global threat intelligence.’ Their positioning seems to be around intelligence and offering their clever algorithms to solve your problems.
Microsoft surprisingly sports a shining new computer on their website. Their message is simply ‘Introducing Surface Book’. The world’s largest software company is clearly keen to break away from its traditional software revenue. With Surface Book it is signalling its intention to fight it out with the Mac and iPad.
Companies put a lot of effort into crafting the messaging and communication on their website. Carefully analysing the changing content on your competitors’ websites will give you a lot of valuable competitive intelligence.
The social media buzz
As social media moved from obscure guest pages in the mid-1990s to increasingly popular online social hubs a decade later, companies suddenly lost control of the communication around their brands and services. With the rise of services such as Twitter, Facebook and LinkedIn, a new reality was born in which a single client could set the agenda while the whole world was sitting ringside watching how the company handled itself.
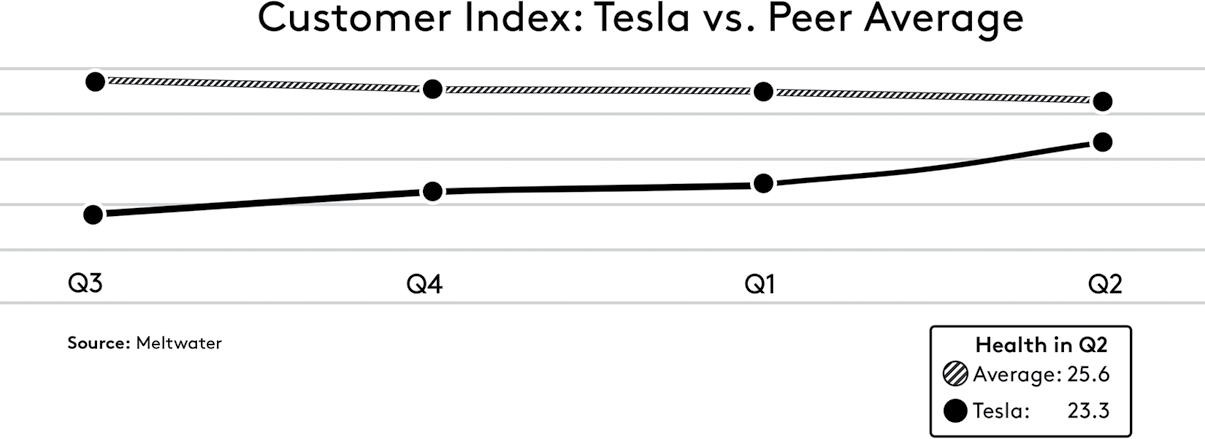
A company’s website reveals how a company wants to be perceived by the rest of the world. Through social media you can tune in directly to the voice of a company’s clients. Through social media you can get a real-time insight into how well a company is doing in terms of product, customer support and general customer satisfaction. The example below shows customer satisfaction over time for Tesla benchmarked with its peer group, consisting of Mercedes, BMW and Audi. Customer satisfaction is measured as a function of the sentiment on the respective companies’ Facebook pages. Interestingly, in spite of all its media coverage, Tesla has been lagging when it comes to the happiness of its customers. The trend, however, is very positive, and by Q2 2016 Tesla’s score is comparable to that of the others.
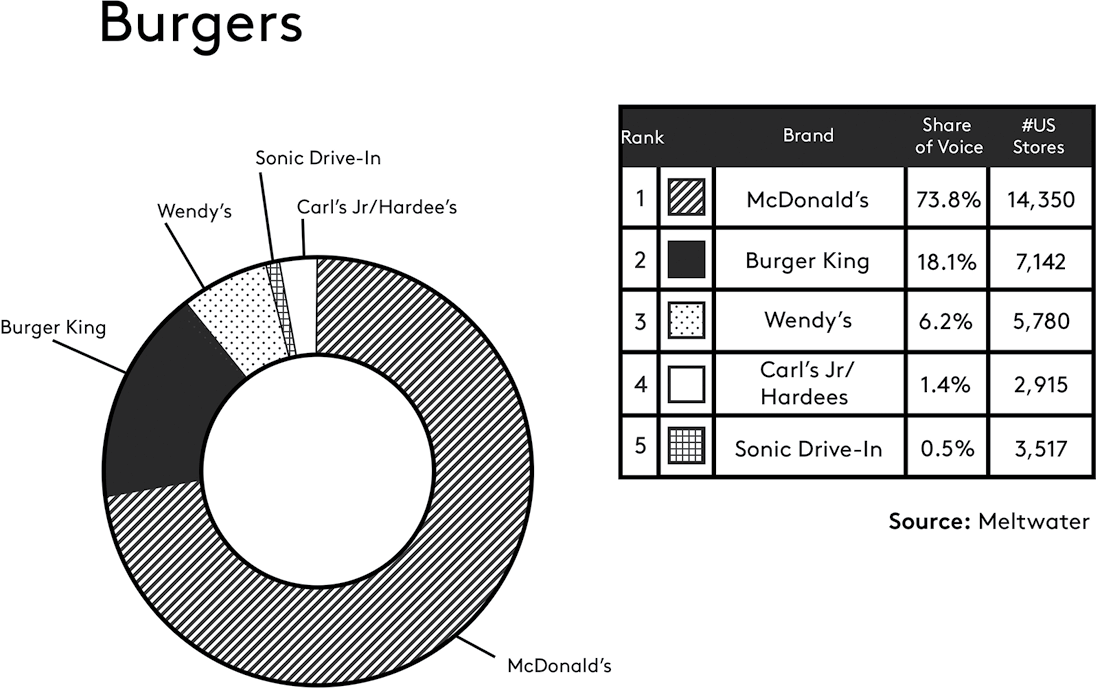
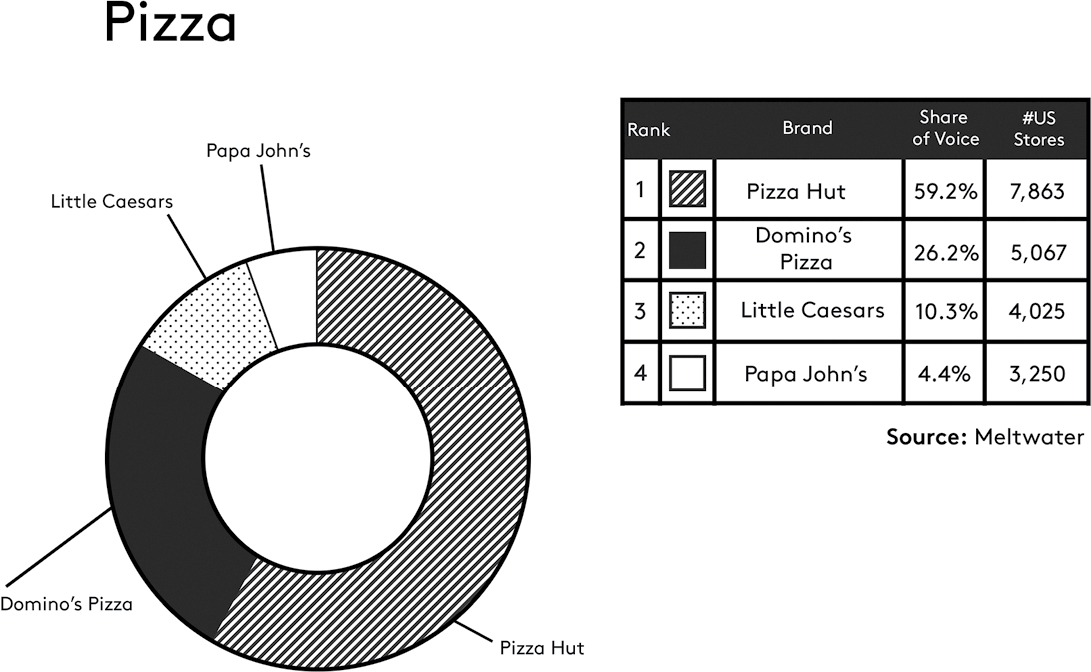
Social media are also very suitable for measuring the strength of a brand. Below is the relative footprint of competing fast-food brands on Twitter and Instagram from May 2015 to May 2016. From the pie chart we can see that McDonald’s has four times more social media coverage than its closest rival, Burger King, despite only having twice the number of physical outlets. Similarly, one can see that Pizza Hut has twice the coverage of its competitor Domino’s, with only 50 per cent more restaurants.
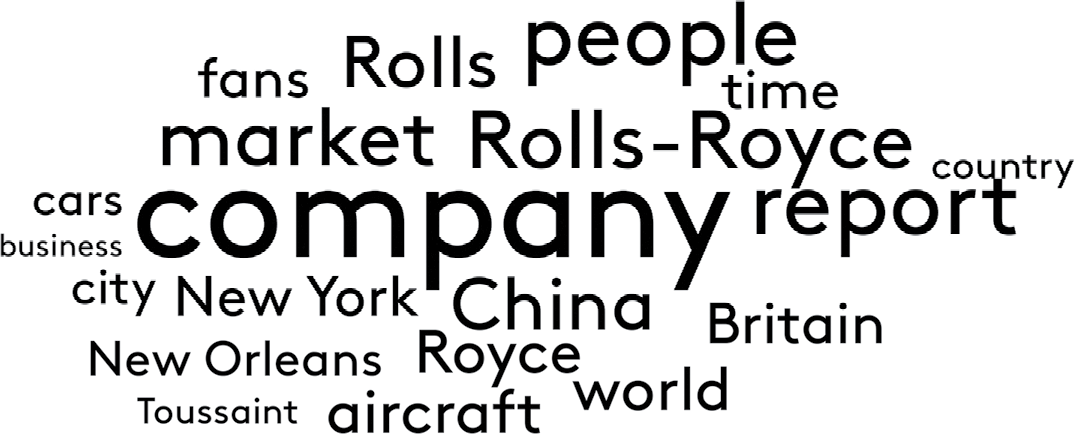
Social media can also be used to understand the main focus of a brand. Consider the word clouds of the car brands Aston Martin and Rolls-Royce created by news and social media coverage during 2015. The size of the words illustrates how much they have dominated conversations. We can see the different priorities of the two brands straight away. While Aston Martin’s word cloud illustrates an emphasis on ‘celebrity’ and endorsements, Rolls-Royce’s is primarily concerned with export markets and industry. To understand this difference it is important to appreciate that Rolls-Royce is much more than just a car brand and that it is focused on promoting a range of products, including aero engines, power systems and nuclear plants.

Online ad spend
Another interesting trail of online breadcrumbs to follow is search engine marketing (SEM), or so-called pay-per-click (PPC) spending. Such spending can be estimated because online search terms are auctioned out in real time, where everyone can see the inventory and going price. eMarketer estimates search spend to have been nearly half (46 per cent) of the total $58.12 billion digital ad-spend market in 2015,10 so although search spend doesn’t tell the full story, it is a very interesting metric to track for most companies.
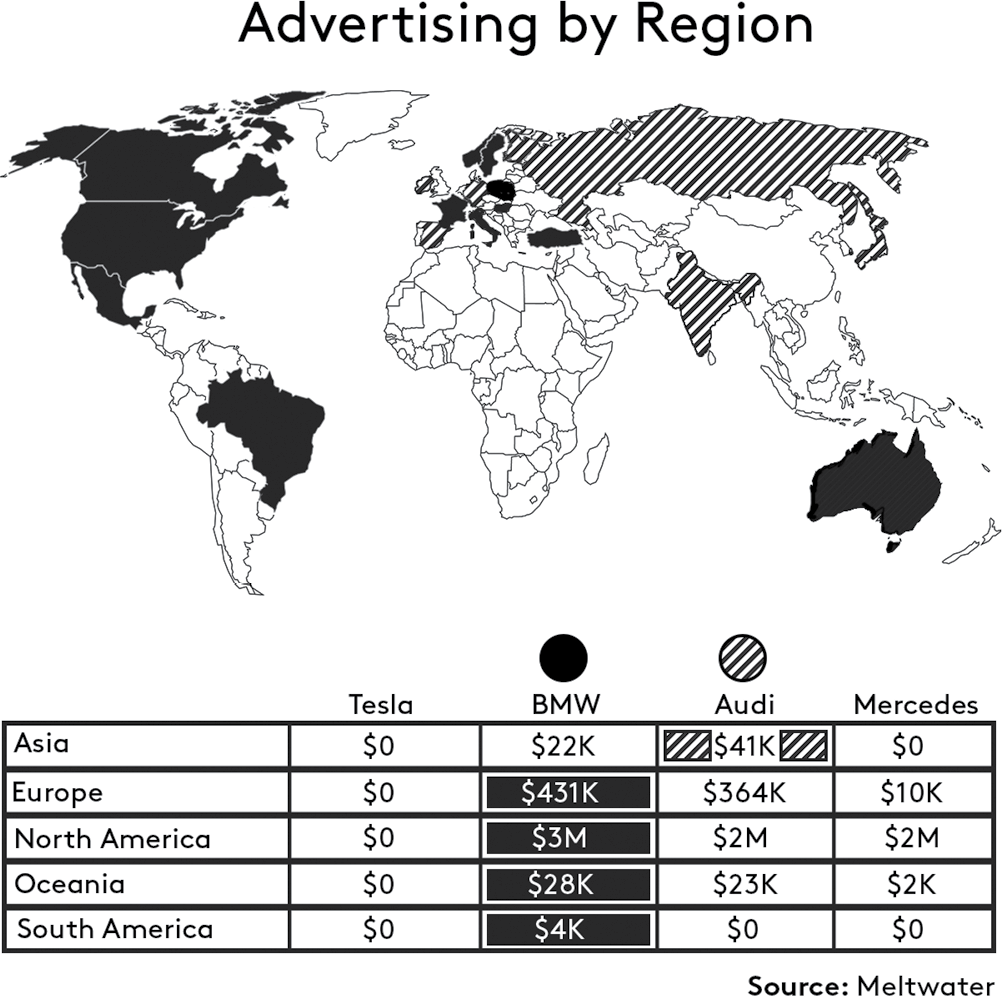
Tracking your competitors’ search spend and how it is trending over time and broken down by countries and product lines can provide invaluable competitive insights. The illustration below estimated SEM spend by Tesla and the same peer group we saw earlier in Q2 2016. Interesting to note is that Tesla is spending almost nothing on online advertisements. BMW, however, is outspending all its competitors on nearly all continents.
Web traffic and app downloads
Another commonly used metric for competitive intelligence is web traffic. Web traffic data is not easy to get hold of, but there are third-party companies such as Comscore that estimate website visits. In a similar fashion you can use Google AdWords to see how often your company brands are searched. Compare this data with that of your competitors. If app downloads are important to you, a commonly used service is App Annie. Web traffic, search volume and app downloads are all measures of the level of demand for your products.
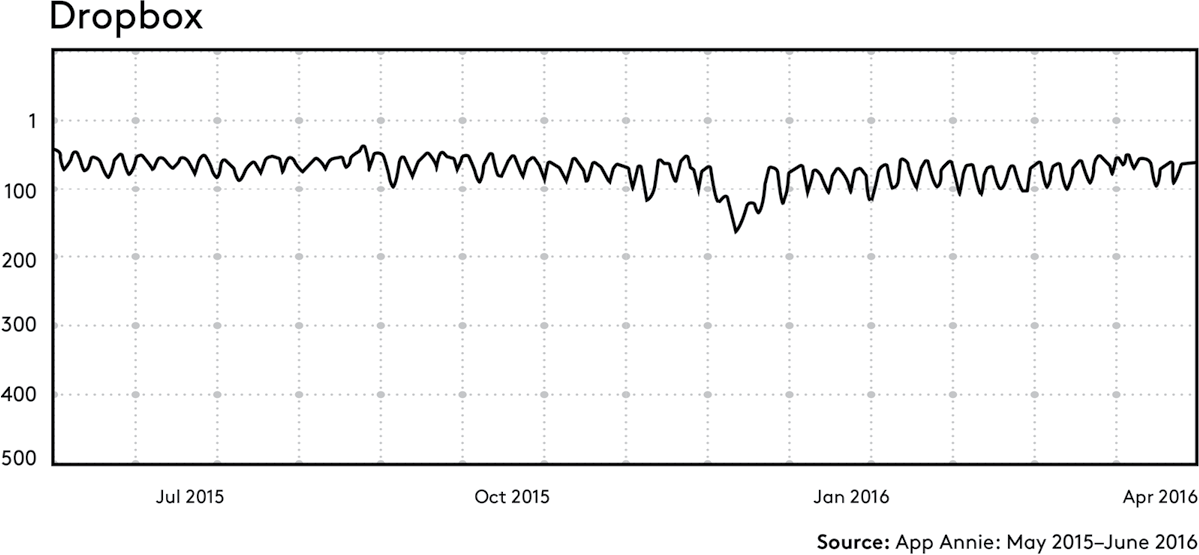
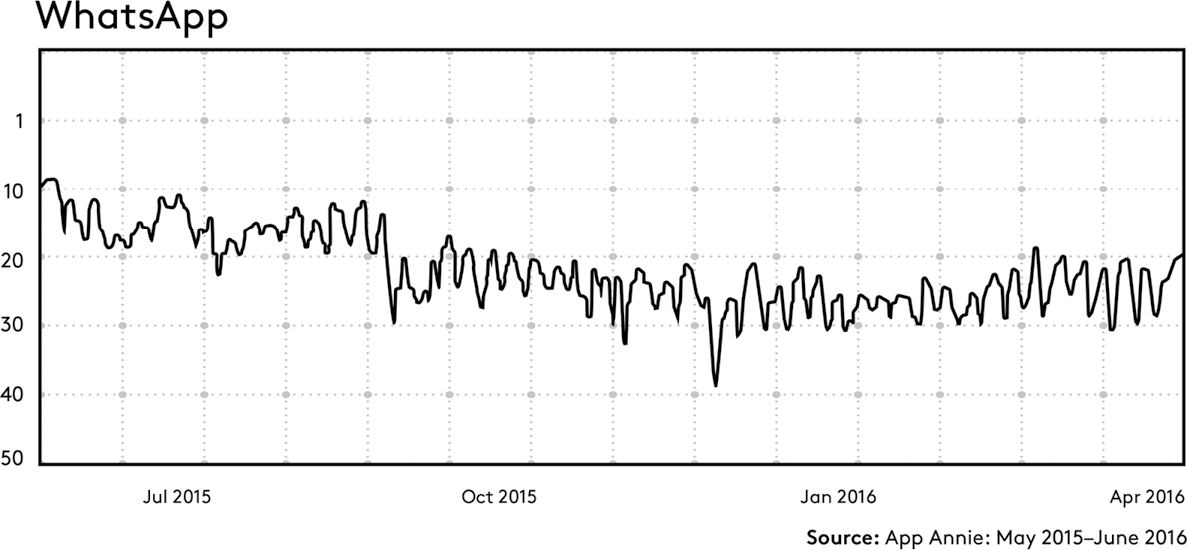
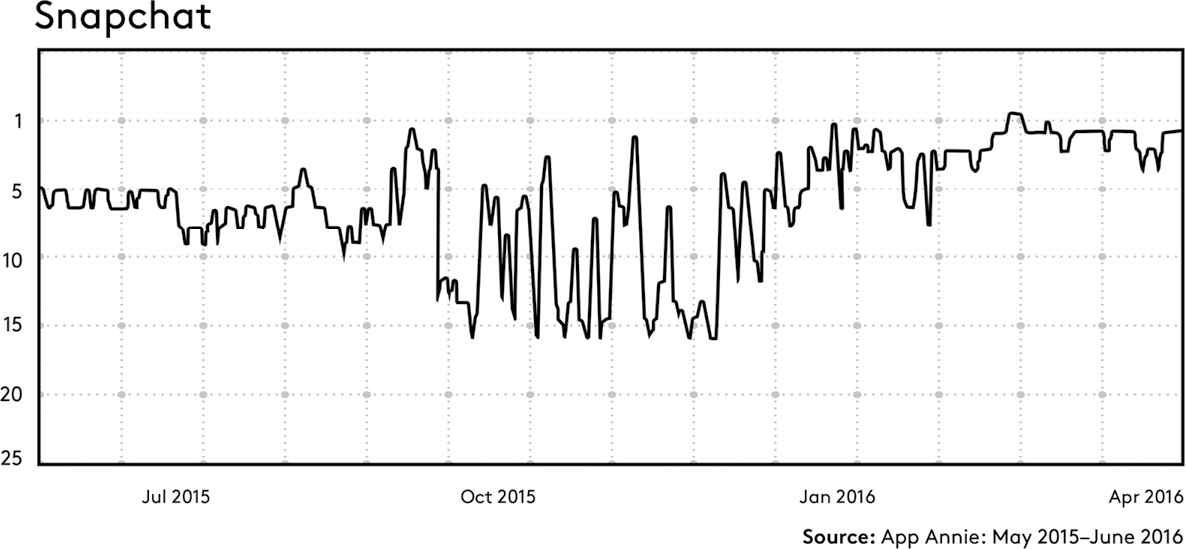
Below is last year’s ranking history from App Annie for downloads of a handful of popular apps. The ranking is a measure of how popular the apps are, compared with other apps in their category. Such ranking development is an indicator of whether an app is on the up or not.
It is clear that Evernote is on a downward trend, moving from around 500 in popularity down to 1000. WhatsApp is also dropping, although not so drastically, slipping from 10 down to around 25. Dropbox is pretty steady, but looks like it is on a slow downward trend. The only app showing a positive trend is Snapchat. A year ago it was ranked 5. In Q4 2015 it went through a phase where its ranking jumped up and down, but since Q1 2016 it has seen a steady improvement.

Tracking patent applications, credit ratings, litigation and import declarations
In addition to the data types we have discussed so far there is a whole range of data available online containing valuable business insights. To create an exhaustive list of such data types is beyond the scope of this book, as any such list will vary widely from one industry to another. The continual appearance of new data online adds a further level of complexity to the task of compiling such a list. For this reason I will limit myself to pointing to a few additional data types that could contain business insights relevant for most industries.
One pretty straightforward data type in this regard is patent and trademark applications. They are readily searchable in most countries, although there is a lag of a few months from their initial filing date. The value of tracking patent applications is self-evident: it offers an understanding of your competitors’ strategic purpose. Patents and trademark applications are both laborious and time-consuming and consequently expensive. A company won’t normally pursue a patent application unless it thinks it is important. Patent applications can signal new product launches or the arrival of new challengers encroaching into your area. Studying patent applications can also identify acquisition targets and, in some instances, predict acquisitions.
Another information trail worth following is credit ratings and company financials. Many companies regularly track the credit ratings or financials of their key and new clients. Credit ratings are equally valuable for keeping tabs on suppliers, partners and other companies in your sphere of business. One of the weaknesses with credit ratings is, of course, that they are not an exact science and that they are lagging indicators.
Litigation is sadly becoming almost a normal practice when running a business – particularly in the US. Information about litigation is often accessible online. The possible gains from studying legal processes are multiple. First, the disputing parties are required to reveal information that might otherwise not be publicly available; second, litigation can send a strong signal that something is to be gained or protected; and third, litigation represents a financial risk for one or both of the parties. And if your business is dependent on a company that is involved in litigation, then it’s worth staying on top of the issue.
In the US, shipping companies have to register the contents of the containers they’re moving via a document known as a Bill of Lading. Other countries have similar practices. This public record identifies the importer or exporter, including a brief description of the goods or commodities or their commercial value. Import–export data is useful in complex businesses such as the auto industry, which rely on large shipments of raw materials, often across long distances. Such information can be used, for example, to predict future sales volumes of Tesla cars. If you know what the company is importing, it’s possible to compare this with historic sales and raw material data and extrapolate what will happen further down the line. For example, a big spike in raw materials will mean that eight months later (the general time-lag between raw materials and the finished car) there will be a certain number of new Tesla cars on the road.
The remarkable tale of Apple told by its boilerplate
So far in this chapter we have discussed the trail of online breadcrumbs that we leave behind, as individuals and as companies. To end this chapter I will show how powerful a simple analysis of such trails can be over time.
For my analysis I will limit myself to an obscure little fingerprint that every company inserts at the bottom of its press releases. It is a short description of the company and is often referred to as a press release ‘boilerplate’.
The reason why this boilerplate is interesting is that it gives a very condensed description of what the company does or aspires to do, and is usually limited to a few sentences. These sentences are crafted very deliberately to convey strategic positioning and intent.
Studying the boilerplate in Apple’s press releases is a fascinating read, capturing fifteen years of consumer technology history. Apple is highly structured in its approach, consistently using two to three sentences to describe its business. Tracking the development from year to year, we can see how the tech company’s strategy and product focus have evolved from computers to personal computing devices. We can also see how Apple’s struggles and successes shine through in the choice of tone and language.
In 1997 Apple was in dire straits. Stock was trading at a ten-year low,11 the Macintosh was outdated, its personal digital assistant (the Newton) had flopped, and the company asked its second CEO in two years to leave. Steve Jobs was brought back to save the company, but Apple was in serious financial trouble and running out of money. A helping hand came from the most unlikely of sources when arch-nemesis Microsoft secured the long-term viability of Apple by investing $150 million and pledging support for the Office Suite for the Macintosh platform for the next five years.12
In January 2000 the difficulties and lack of confidence were evident in the Apple boilerplate:
Apple ignited the personal computer revolution in the 1970s with the Apple II, and reinvented the personal computer in the 1980s with the Macintosh. Apple is now recommitted to its original mission to bring the best personal computing products and support to students, educators, designers, scientists, engineers, businesspersons and consumers in over 140 countries around the world.
The boilerplate starts with a reference to historic accomplishments dating back thirty years and moves on to its recommitment ‘to its original mission’. It’s as though Apple is telling us, ‘Remember how great we were? Now we are working hard to become as great as we used to be.’
Over the next four years Apple experienced a lot of ups and downs. It made progress on renewing its product portfolio, but financials were bumpy. In 2004 Apple ended a seven-year period of stagnation with a solid 33 per cent revenue growth and produced its highest revenue figures since 1996. This increased confidence was evident in the new boilerplate:
Apple ignited the personal computer revolution in the 1970s with the Apple II, and reinvented the personal computer in the 1980s with the Macintosh. Today, Apple continues to lead the industry in innovation with its award-winning desktop and notebook computers, OS X operating system, and iLife and professional applications. Apple is also spearheading the digital music revolution with its iPod portable music players and iTunes online store.
Apple was still clinging to its old laurels, but the language had become noticeably bolder in describing the current state of affairs. Also noteworthy is the introduction of a third sentence, highlighting the iPod. Interestingly the reference to the iPod came three years after its actual launch. In future Apple would be a lot more confident about referring to its new product.
On 29 June 2007 the iPhone was launched, receiving universal rave reviews for its ground-breaking design and technology. Apple’s revenue grew to three times that of the record-breaking 2004. The good times were back. Sales and profits were soaring, and it showed in the choice of language. In July that year Apple proudly added a proclamation of its iPhone to its boilerplate:
Apple ignited the personal computer revolution in the 1970s with the Apple II, and reinvented the personal computer in the 1980s with the Macintosh. Today, Apple continues to lead the industry in innovation with its award-winning computers, OS X operating system and iLife and professional applications. Apple is also spearheading the digital media revolution with its iPod portable music and video players and iTunes online store, and has entered the mobile phone market this year with its revolutionary iPhone.
On 26 May 2010 Apple’s market value overtook that of Microsoft. In Q3 Apple’s revenue exceeded for the first time that of its Seattle-based rival. In December 2010 the Apple boilerplate received an overhaul. The language was radically changed. References to historical glories were dropped and replaced by an upbeat description of present-day accomplishments. The hesitation of the past was replaced with language boasting about its ‘revolutionary’ and ‘magical’ products:
Apple designs Macs, the best personal computers in the world, along with OS X, iLife, iWork, and professional software. Apple leads the digital music revolution with its iPods and iTunes online store. Apple is reinventing the mobile phone with its revolutionary iPhone and App Store, and has recently introduced its magical iPad which is defining the future of mobile media and computing devices.
In April 2015 Apple became the most valuable company in the world, with a market value of $770 billion.13 Its share price had risen 24,500 per cent from its lowest point in 1997. The boilerplate was once more rewritten, and in June 2015 it read:
Apple revolutionized personal technology with the introduction of the Macintosh in 1984. Today Apple leads the world in innovation, with iPhone, iPad, Mac, Apple Watch and Apple TV. Apple’s four software platforms – iOS, OS X, watchOS and TVOS – provide seamless experiences across all Apple devices and empower people with breakthrough services including the App Store, Apple Music, Apple Pay and iCloud. Apple’s 100,000 employees are dedicated to making the best products on earth, and to leaving the world better than we found it.
The language has come full circle: the historic accomplishments are brought back to describe Apple’s heritage. The Apple of today is described as a supreme global ruler of a tightly knit consumer ecosystem of devices, software, platforms and services. The forward-looking third sentence is now replaced with a (continued) dedication to making the world better, a statement that Apple fans would find reassuring and that Apple sceptics would describe as hubris.
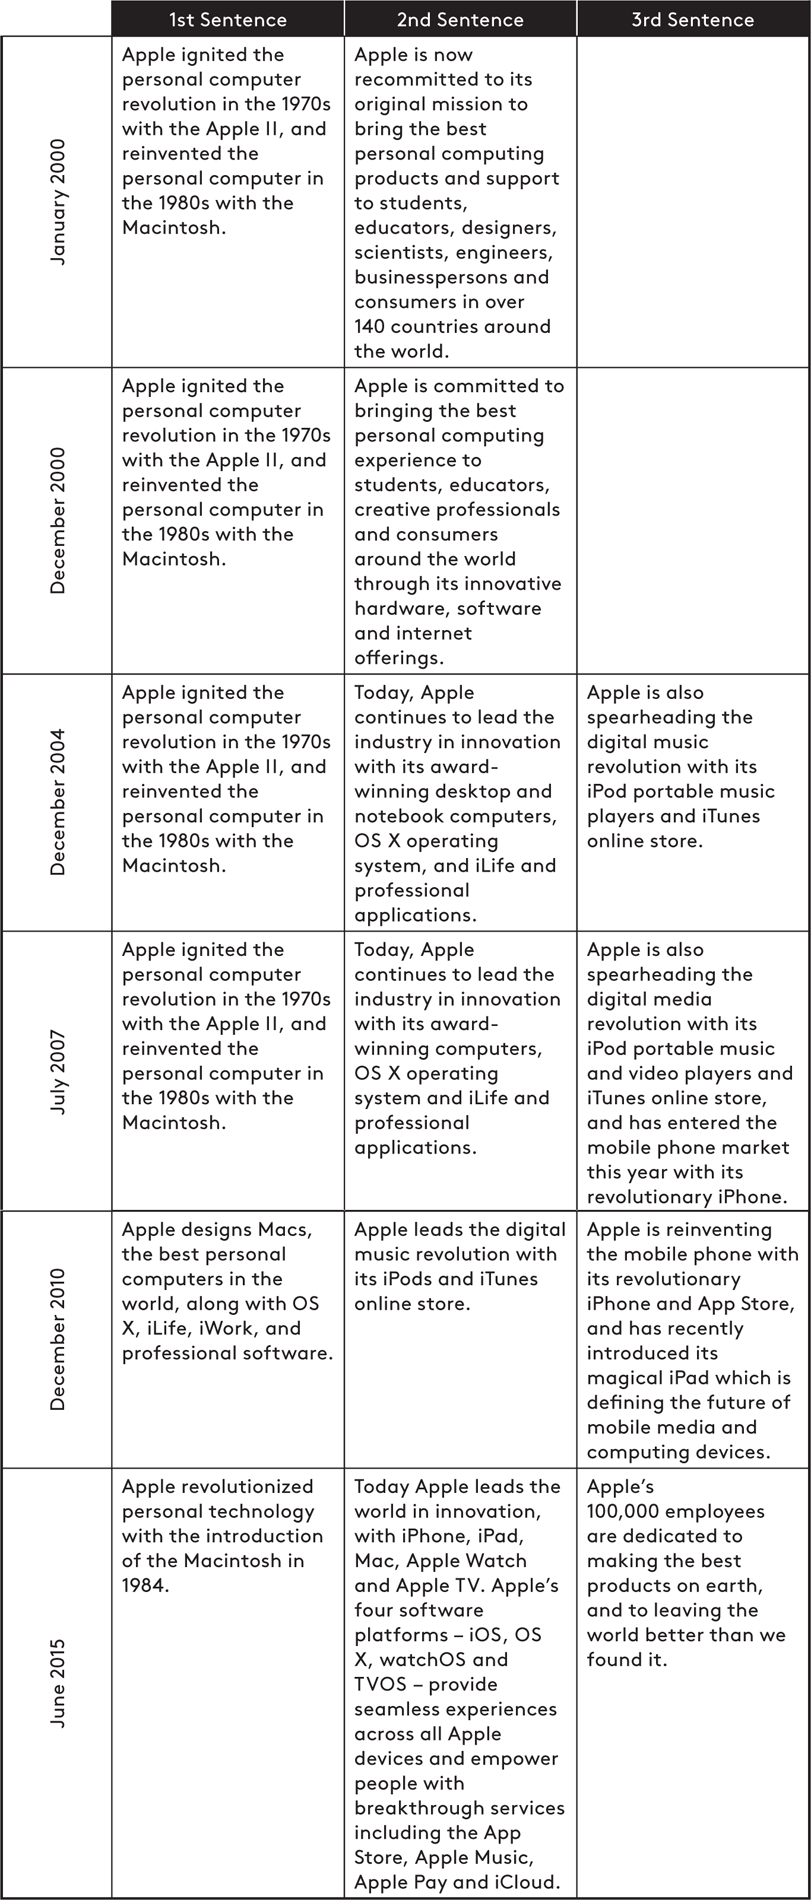
The analysis of Apple’s boilerplate shows how much information can be found in the online trails companies leave behind. The world has changed. Today we have access to information online that we did not have just a few years ago. The internet has become a treasure trove of business insights ready to be mined.
In the rest of the book we will study how analysis of online breadcrumbs will transform corporate decision-making and the way that companies are run and governed.
