MARCH ALMANAC
 STOCKS AND BONDS
S&P 500 has shown a tendency to see strength after February weakness. March marks the end of the first quarter; we have seen funds taking profits prior to the end of the quarter, adding to potential late month weakness (page 140). Beware the Ides of March because St. Patrick’s Day mid-month bullishness typically fades as the month concludes. Beware because the 30-year Treasury bond price has a tendency to continue its decline (page 142) and trade in synch with stock prices, as the quarter draws to a close. Historically, this is still the time to be short by selling into mid-month strength.
 ENERGY
After January and February weakness, crude oil begins to strengthen in March at the outset of its best seven months, March–September. The seasonal best trade from February is still long through mid-May (pages 26 and 126). Natural gas prices also remain firm through March; the seasonal best trade from February is still long as well, heading into late April (page 32).
 METALS
Gold posts bottoms during March, and this is the time to cover the seasonal best trade short position from February (page 126). Silver is still in decline, as our seasonal best trade is holding a short position until late April (page 30). Copper prices can run higher in March and April, depending on the price gains from December through late February, which is our best trade time frame to be long (page 112). Look for a seasonal peak in April or May (page 48) to make trading decisions.
 GRAINS
Soybeans during March are still in our best trade long scenario (page 24), but this month can produce consolidation or a pause in any strong price gain due to anticipation of the quarterly grain stocks report and the farmer planting intentions report. Wheat prices are still in a seasonal decline mode heading into the June harvest lows (page 18). Corn prices tend to defy gravity and continue higher into late April and early May (pages 100 and 158).
 SOFTS
SOFTS
Cocoa begins a seasonal decline, instituting a short position in our seasonal best trade category (page 34). Coffee prices tend to see mild corrections after big up moves in February. This is the “frost scare” season in South America. Coffee is susceptible to higher prices until the seasonal peak in May (pages 52 and 170). Sugar prices continue to decline (page 173).
 MEATS
MEATS
Front-month live cattle prices tend to post a seasonal high in March. Producers are liquidating inventories because packers and processors are preparing for BBQ season (pages 60 and 176). Lean hog prices tend to rise during March because demand for ham increases for Easter (page 179).
 CURRENCIES
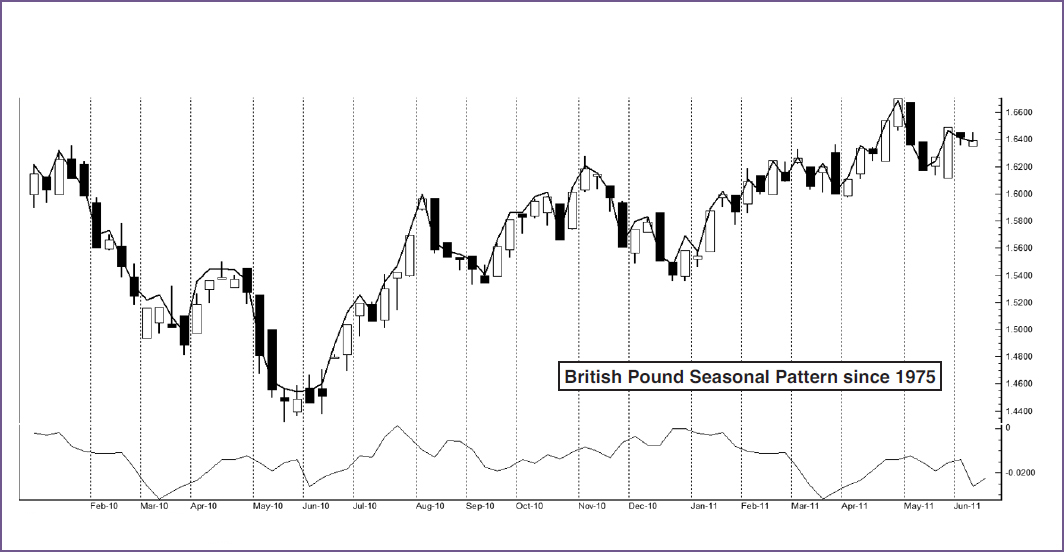
The euro currency has revealed a tendency to decline during the second half of March, 8 out of 13 years (page 126). The Swiss franc also has a tendency to see price declines from mid-March through mid-May (page 187). The British pound has a distinct pattern of doing the opposite of the euro and Swiss franc; it has a strong tendency to move up against the U.S. dollar in mid- March (pages 36 and 182). The yen has a strong seasonal tendency to sell off in mid-March through early April (page 126).


SILVER TARNISHES IN FEBRUARY
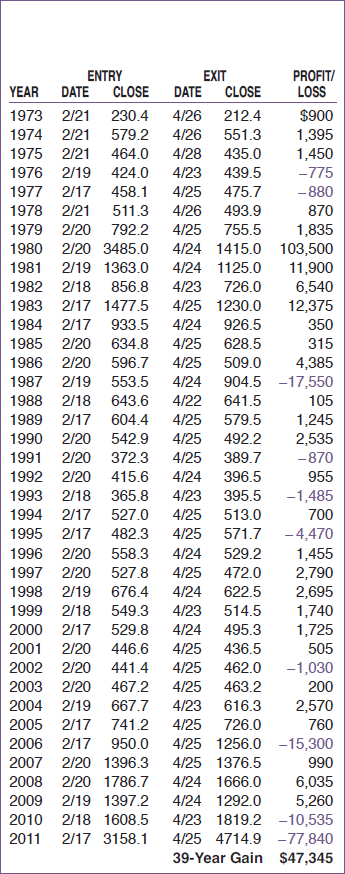
Over the years silver has peaked in February, most notably so in 1980 when the Hunt Brothers’ plot to corner the silver market was foiled. Our seasonal study shows that selling on or about February 17 and holding until about April 24 has worked 29 times in the last 39 years, for a win probability of 74.4%. As you can see in the short silver table, the usual February silver break was trumped by the overarching precious metal bull market of 2002–2011 three times in the last nine years.
Last year this trade was victim to a speculative fever that pushed prices to new all-time highs, illustrating the importance of using additional timing tools and stop losses. The bubble burst when margin requirements were raised, but not before handing this trade its worst loss ever of $77,840 on a single futures contract.
Silver is considered the “poor man’s” gold, and it does in fact tend to mirror the price move of gold. It is an industrial metal, so in periods of declining economic conditions silver can remain weak. However, it does have a demand base for jewelry, and it is also used in the electronics industry because of its high electrical conductivity and its extreme resistance to corrosion. It is still used in some photo processing applications, but demand in this area has declined with the rise of the digital age of computer imaging.
FEBRUARY SHORT SILVER (MAY) TRADING DAY: 13—HOLD: 45 DAYS
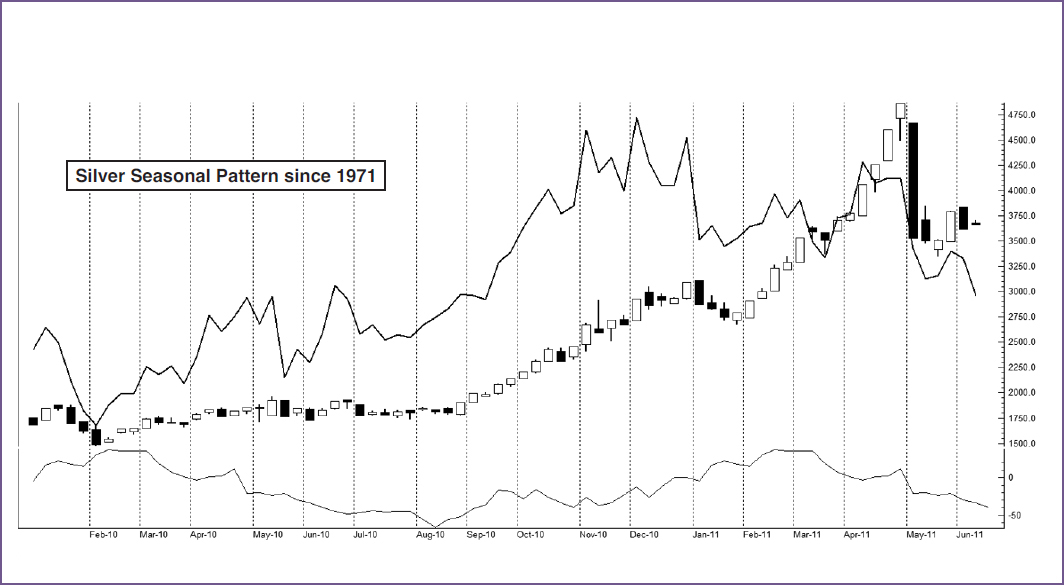
The chart below of silver has the closing price of ASA Limited (ASA), a mining company that produces silver, overlaid on top. The bottom line is the average seasonal tendency of silver. ASA fairly closely mirrors silver’s price moves. See pages 133–138 for additional correlated trades.
SILVER (SI) BARS AND ASA LIMITED (ASA) CLOSES (WEEKLY DATA JANUARY 2010–JUNE 8, 2011)
Chart courtesy TradeNavigator.com
NATURAL GAS SURGES
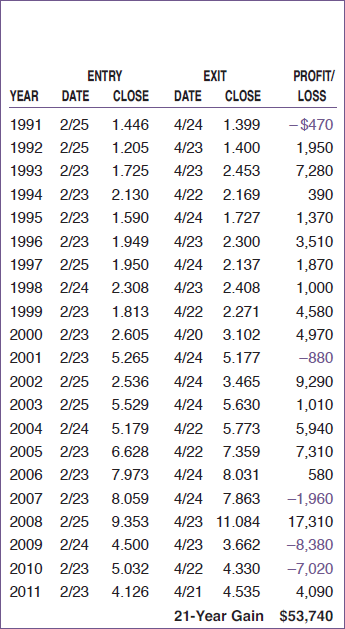
Our long natural gas trade from late February to late April boasts a 76.2% success rate, gaining 16 out of the last 21 years. One of the factors in this seasonal price gain is consumption driven by demand for heating homes and businesses in the northern cold weather areas in the United States. In particular, when December and January are colder than normal, we see depletions in inventories through February. This has a tendency to cause price spikes lasting through mid-April.
This best trade scenario has a holding period of approximately 41 trading days lasting until on or about April 23. It is at this time that inventories start to replenish and demand tapers off until mid-July, when demand for generating electricity is highest in order to run air conditioners during heat spells.
The chart below is natural gas (NG) with the United States Natural Gas (UNG) ETF overlaid, displaying the strong correlation in price moves. In addition, the bottom line shows the average seasonal price tendency since 1990, illustrating the bottom that occurs in February. See pages 133–138 for additional correlated trades.
FEBRUARY LONG NATURAL GAS (JULY) TRADING DAY: 16—HOLD: 41 DAYS
Since the summer of 2008, the natural gas bear market, caused by a glut in the United States from increased supplies and decreased demand due to ideal weather conditions, has put a damper on this trade in two of the last three years. Using risk management techniques, such as stop loss orders and options strategies, should have prevented catastrophic losses from occurring. Furthermore, utilizing technical timing tools, as we illustrate on pages 121–125, should not only improve results but also help keep you out of the seasonal trade when macro trends override seasonality.
NATURAL GAS (NG) BARS AND UNITED STATES NATURAL GAS (UNG) CLOSES (WEEKLY DATA JANUARY 2010–JUNE 8, 2011)
Chart courtesy TradeNavigator.com

COCOA PEAKS BEFORE ST. PATRICK’S DAY
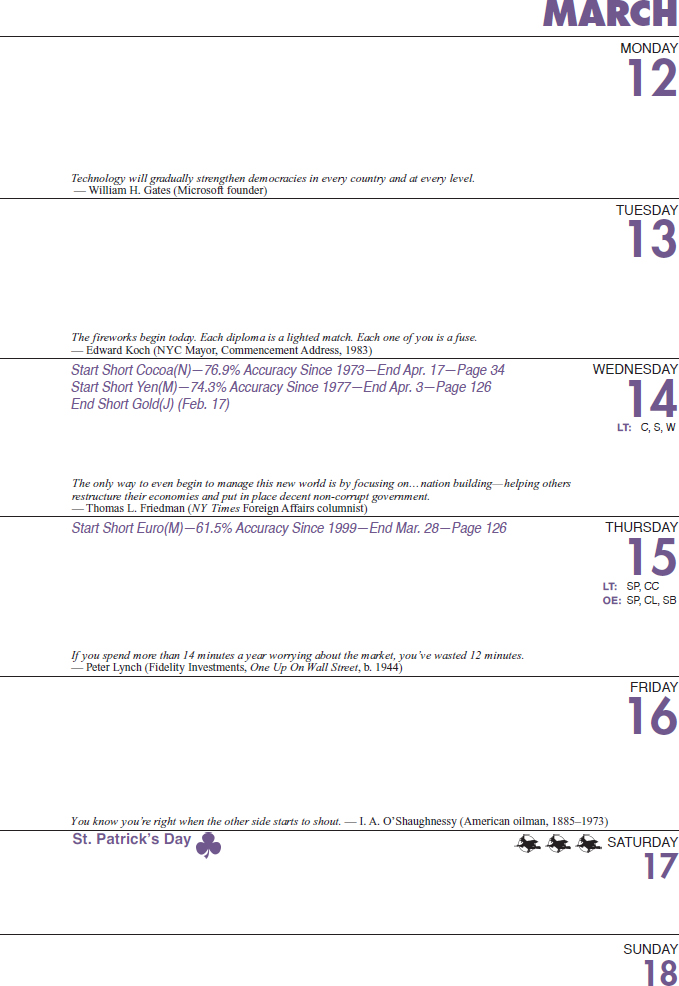
Cocoa begins a seasonal decline, instituting a short position in our seasonal best trade category. Selling on or about March 14, right before St. Patrick’s Day, and holding until on or about April 17, for an average holding period of 23 trading days, has been a winner 30 of the past 39 years. Even in the face of the 2008 great commodity bull run, this seasonal tendency worked with a potential profit per contract of $1,730.
Cocoa has two main crop seasons. The main crop, from the Ivory Coast and Ghana in Africa, accounts for 75% of the world production runs from January through March. As inventories are placed on the market, this has a tendency to depress prices, especially when demand starts to fall for hot chocolate drinks and chocolate candy in the spring and summer time.
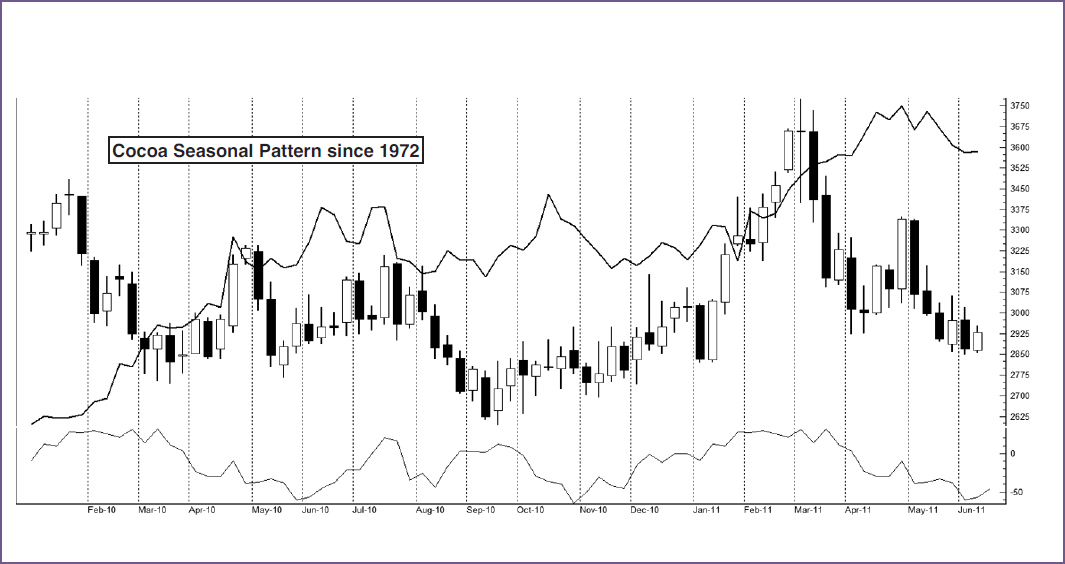
For stock traders, here is an interesting comparison. The chart below is Hershey Foods (HSY) with cocoa prices overlaid and the historic seasonal tendency of Hershey on the bottom. Notice the inverse relationship. See pages 133–138 for additional correlated trades.
MARCH SHORT COCOA TRADING (JULY) TRADING DAY: 10—HOLD: 23 DAYS

When cocoa prices rise, Hershey prices decline; and then as cocoa prices decline in March, we see a small advance in the stock price. Investors should be aware of the price swings of the underlying product that companies need to manufacture goods in order to obtain a decent profit margin. What is interesting about Hershey is that one of their competitors includes Cadbury PLC (CBY), a confectionery and non-alcoholic beverage company. Although the Cadbury chocolate products have been sold in the United States since 1988 under the Cadbury trademark name, the chocolate itself has been manufactured by Hershey.
COCOA (CC) BARS AND HERSHEY (HSY) CLOSES (WEEKLY DATA JANUARY 2010–JUNE 8, 2011)
Chart courtesy TradeNavigator.com
MARCH BRITISH POUND INVASION
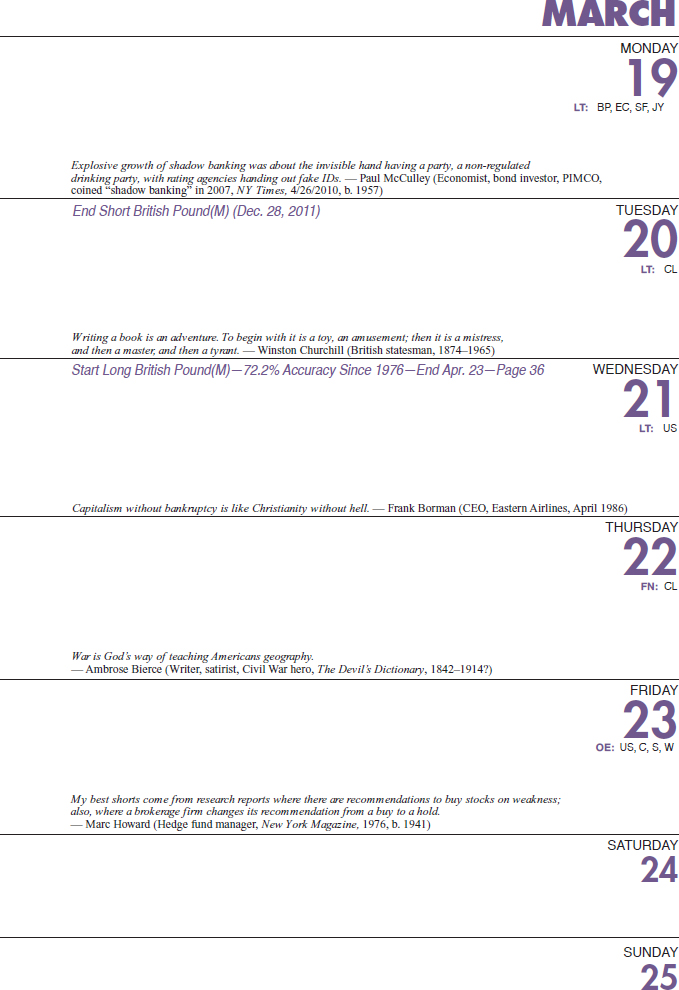
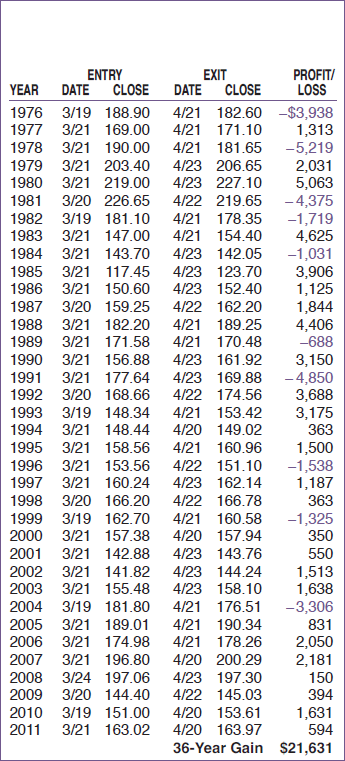
The British pound has a distinct pattern of doing the opposite of the euro and Swiss franc. It has a strong tendency to move up against the U.S. dollar from mid-March through the latter part of April. In fact, in the 36-year history, it has been positive 26 times, for a success rate of 72.2%.
Entering on or about March 21, holding a long position for 22 trading days, and exiting on or about April 23 has had a string of winners the last seven years in a row, starting in 2005. Perhaps the fact that Britain’s fiscal year begins in April helps to push the pound’s value up against the U.S. dollar, as money moves back overseas. Cross transactions between the pound versus the euro currency and the pound versus the yen may help influence the rise in the pound’s value relative to the U.S. dollar.
MARCH LONG BRITISH POUND (JUNE) TRADING DAY: 15—HOLD: 22 DAYS
The weekly chart below depicts the British pound with the exchange-traded fund (ETF) on the British pound (FXB) overlaid to illustrate how the two instruments trade in tandem.Traders also have the ability to trade foreign currencies on a regulated marketplace, such as the CME Group’s futures and options exchanges that provide more electronic access than ETFs afford. Investors who require less leverage will find the FXB an adequate trading vehicle. Either way, the seasonal tendency is quite strong for the pound to move up in this time frame. See pages 133–138 for additional correlated trades.
BRITISH POUND (BP) BARS AND CURRENCYSHARES BRITISH POUND (FXB) CLOSES (WEEKLY DATA JANUARY 2010–JUNE 8, 2011)
Chart courtesy TradeNavigator.com
