APRIL ALMANAC
 STOCKS AND BONDS
S&P 500 has shown a tendency to see price declines ahead of mid-month tax deadlines and then a month-end recovery. April is considered one of the best six months to be long, according to the Stock Traders Almanac. 30-year Treasury bond price has a tendency to make a seasonal low towards the end of the month (page 42 and 123).
 ENERGY
Crude oil has a tendency to continue rallying through April into mid-May, as we are long crude from our seasonal best trade in February (pages 26 and 126). This is still one of the best seven months to be long: from March through September. Natural gas prices tend to peak in mid- to late April. Our best seasonal long trade from February signals an exit on or about April 23 (page 32).
 METALS
Gold has a tendency to decline in April, as tax-related selling pressures prices (page 40). Our best seasonal short trade for silver from February signals an exit on or about April 24 (page 30). Copper tends to form a seasonal high toward the end of April and the first part of May (pages 112 and 149).
 GRAINS
Soybeans in April still see upside, as planting concerns and demand for both meal and oil remain strong, U.S. inventories decline, and new supplies are not yet ready since South America’s harvest is just beginning (page 161). Wheat is still under pressure, as harvest adds fresh inventories that outweigh demand (page 164). Corn has a tendency to remain strong, especially as April can lead to planting delays in cool, wet spring conditions. In addition, April tax season has passed, and farmers tend to start focusing on production rather than marketing, allowing inventories to build up on farm locations (page 158).
 SOFTS
SOFTS
Cocoa’s best seasonal short trade from March signals an exit on or about April 17 (pages 34 and 126). Coffee prices are seasonally strong, as this is still just short of the Columbian and Brazilian harvest. It is also the time when the threat of frost damaging the South American crop is high (page 170). Sugar tends to remain weak during this time frame due to inventory from sugar cane harvests in the U.S. Southeast and Brazil (page 173).
 MEATS
MEATS
Live cattle prices are in a seasonally weak period through mid-June, but we do see times when prices consolidate, especially if the month prior showed significant price declines (page 176). Ranchers tend to pay more attention to breeding in the spring rather than bringing livestock to market. Lean hog prices, on the other hand, continue to remain firm in April from a seasonal perspective (page 179). As corn prices increase feed costs, hog producers have shifted towards liquidating inventories and are preparing for breeding. Furthermore, competing pork producers from Canada have had more incentives to market their product with the increase in value of the Canadian dollar. This has magnified the seasonal peak which comes in late May.
 CURRENCIES
The euro has weakened in April for three of the past four years (page 186). The Swiss franc continues its seasonally flat period from March until the first part of August (page 187). The British pound best seasonal long trade from March signals an exit on or about April 23 (page 36). The yen best seasonal short trade from March signals an exit on or about April 3 (page 126).


APRIL TAX TIME TAKES A BITE OUT OF GOLD
Gold has a tendency to continue the seasonal decline that begins in January, leaving April vulnerable to price declines. April tends to see tax-related selling pressure on gold prices along with other financial markets, specifically the U.S. stock markets, and more predominantly, in the technology sector as represented by the NASDAQ 100. It seems that some investors raise capital to pay the IRS by liquidating portions of assets, such as gold and stocks (see Stock Traders Almanac 2012, page 36).
Generally speaking, April is also a weak month from a demand perspective. The two forces of increased sales (supply) and no major demand cause the downside price pressure on gold during April. The monthly percentage changes show a distinct gold price decline (page 154).
The weekly chart below shows the price comparison of gold to a gold mining stock, Newmont Mining (NEM). NEM is a major producer of gold and other metals. This company manages properties in the United States, Australia, Peru, Indonesia, Ghana, Canada, Bolivia, New Zealand, and Mexico. The company was founded in 1916 and is based in Denver, Colorado. Not only are they diversified in various countries, but they also have a long history of being in business. This stock also trades well over an average of six million shares per day.
As you can see, the April selloff is predominant not only in the price of gold but also in the shares of this company. The bottom chart shows the average seasonality since 1975 of gold futures prices making declines in the month of April. Here again is another example of trading opportunities using seasonalities of commodities that have direct correlation to other markets, allowing you to trade that product under the seasonal aspects. Newmont Mining is one such example that mirrors the price movement of gold.
GOLD (GC) BARS AND NEWMONT MINING (NEM) CLOSES (WEEKLY DATA JANUARY 2010–JUNE 8, 2011)
Chart courtesy TradeNavigator.com


BONDS CAN GO UP WHEN STOCKS GO DOWN
The vast majority of investors do not understand the nature of trading Treasury bond futures. There exists an inverse relationship between yield and price. When yield or rates go up, bond prices go down and vice versa. When investors feel threatened with a potential decline in the stock market, they allocate more money into bonds. This is often referred to as the “flight to safety” trade. Investors will also allocate more money to bonds when they believe the yield is more attractive than other shorter-term investment options.
APRIL LONG 30-YR BOND (SEPTEMBER) TRADING DAY: 18—HOLD: 81 DAYS

There is no doubt that both of those conditions were met in late 2008 through early 2009. However, even in that unprecedented time, 30-year bond price action did respect a seasonal supply-demand cycle. By going long the September 30-year bond on or about April 26 and exiting the position on or about August 21, we discovered in the last 33 years a solid 69.7% success rate. This trade has a history of 23 wins with only 10 losses; the largest win was $18,531 in 2010, and the largest loss was $5,906 in 1999.
The 2009 stock rally off the bottom of the worst bear market since the Depression drove bonds lower. However, if one waited and used timing tools, losses could have been averted, and gains achieved. In 2011, as we were working on this edition, this trade was conforming to the seasonality, as stocks succumbed to a decline. Investors were in fact seeking safety and flocked to buy bonds.
Stock traders may consider the exchange-traded fund, iShares Barclays 20+ Year Bond (TLT), as a replacement for this futures contract. See pages 133–138 for additional correlated trades.
30-YEAR BOND (US) BARS AND ISHARES BARCLAYS 20+YEAR BOND (TLT) CLOSES (WEEKLY DATA JANUARY 2010–JUNE 8, 2011)
Chart courtesy TradeNavigator.com


BEEF PRICES HEAD SOUTH BEFORE SUMMER
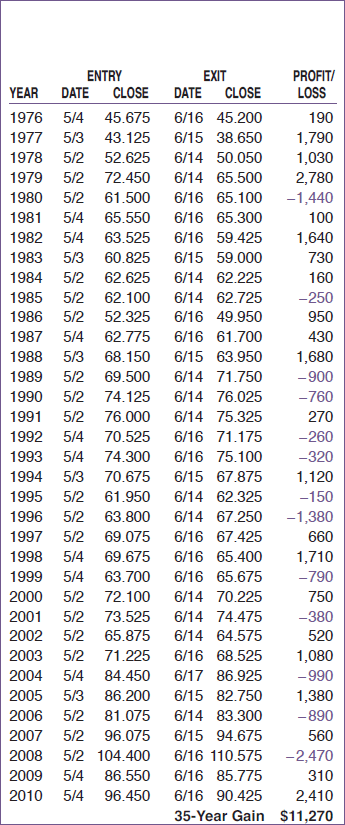
Live cattle prices tend to post a seasonal high in early May. Between the supplies of fattened beef coming out of feed lots from the cold winter months to competing meat products like poultry and pork, supply tends to outpace demand, and we see a strong seasonal tendency for beef prices to decline, starting on or about May 2 through mid-June. In the past 35 years ending in 2010, this trade has worked 22 times for a 62.9% success rate.
MAY SHORT LIVE CATTLE (OCTOBER) TRADING DAY: 2—HOLD: 30 DAYS

At present, there is currently no ETF that is outright geared towards beef prices, but investors do have other options besides outright futures contract positions to trade this commodity’s seasonality. Investors can start examining which companies have not only a like or tandem price relationship, but also an inverse relationship with seasonal price moves in the underlying commodity markets, as is the case with live cattle and McDonald’s (page 60).
However, the chart below is of the ETF Market Vectors Agribusiness (MOO), which tracks beef prices closely, as it contains many stocks related to the cattle ranching business. See pages 133–138 for additional correlated trades. At press time, both live cattle and MOO had already declined substantially by early June 2011, after establishing a peak seasonal high in early April.
LIVE CATTLE (LC) BARS AND MARKET VECTORS AGRIBUSINESS (MOO) CLOSES (WEEKLY DATA JANUARY 2010–JUNE 8, 2011)
Chart courtesy TradeNavigator.com

