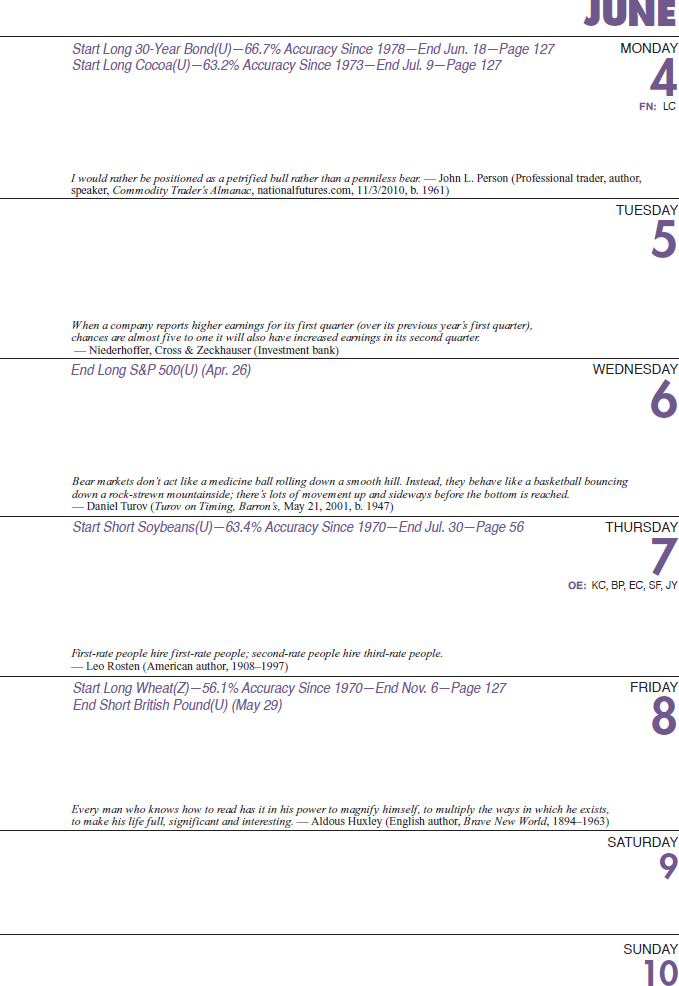
JUNE ALMANAC
 STOCKS AND BONDS
S&P’s have shown a tendency to see mid- to end-of-month weakness, especially after June’s quarterly quadruple witching, as illustrated in our seasonal chart (page 140). 30-year Treasury bond prices are weak in June but have a tendency to recover towards the end of the month from early month losses. Watch for this mid-month reversal, especially when stocks start to make an end-of-month selloff. Buy bonds on second trading day and hold for 10 days. This has a 66.7% win probability with 22 wins in 33 years (page 127). We are still holding onto our top seasonal long from April until late August (page 42).
ENERGY
Seasonally, this is still one of the best seven months, March to September, to be long crude oil. However, June tends to see price consolidations after major price moves in May (page 145). Natural gas prices tend to move lower in June until mid-July, when we typically see the market make its average seasonal low (page 68).
METALS
Most years gold prices continue in a downtrend, as it is in its seasonally weak price period until July–August (page 78). Cover short silver position from May 14 on or about June 25 (page 50). Copper tends to have counter seasonal rallies in June (page 149).
GRAINS
Soybeans’ seasonal peak, sell on June 7; hold until end of July (page 54). Wheat often makes a seasonal low in June. Enter long position around June 8 and exit near November 6 (page 127). Corn is in the middle of seasonal decline, especially in normal or above-average weather conditions. Enter short positions by selling on or about June 26 and holding through the end of July. The last 41 years, this trade has worked 65.9% of the time, for a cumulative profit of $27,719 (page 62).
SOFTS
Enter new long cocoa position on or about June 4; exit on or about July 9. This trade worked 24 of 38 years for cumulative profits of $13,710 (page 127). Coffee continues its downtrend, as it is in the seasonally weak price period (page 52). Sugar tends to post a seasonal low in June, giving us a sweet long trade through the end of July (page 58).
MEATS
This is seasonally the best time to go long cattle. Short-term traders can buy the August contract, and for our top seasonal longer-term play, traders can enter a long position in the April contract of the following year on or about June 20 and exit on or about February 7. Out of the past 41 years, this trade has worked 27 times, for a 65.9% win probability; cumulative profits are $37,510 (page 60). Hogs continue their downtrend, as they are in their seasonally weak price period (page 179).
CURRENCIES
The euro tends to trend lower into the end of the third quarter (page 185). Swiss francs generally move lower into August (page 187). Cover short British pound position from May 29 on or about June 8 (page 46). Prices tend to give traders another trade opportunity. In the past 36 years, reversing positions and going long on or about June 28 and holding into late July has produced 25 years of successful trades, for a success rate of 69.4%. The cumulative profit is $29,762 (page 127). The yen tends to trend lower into August (page 190).
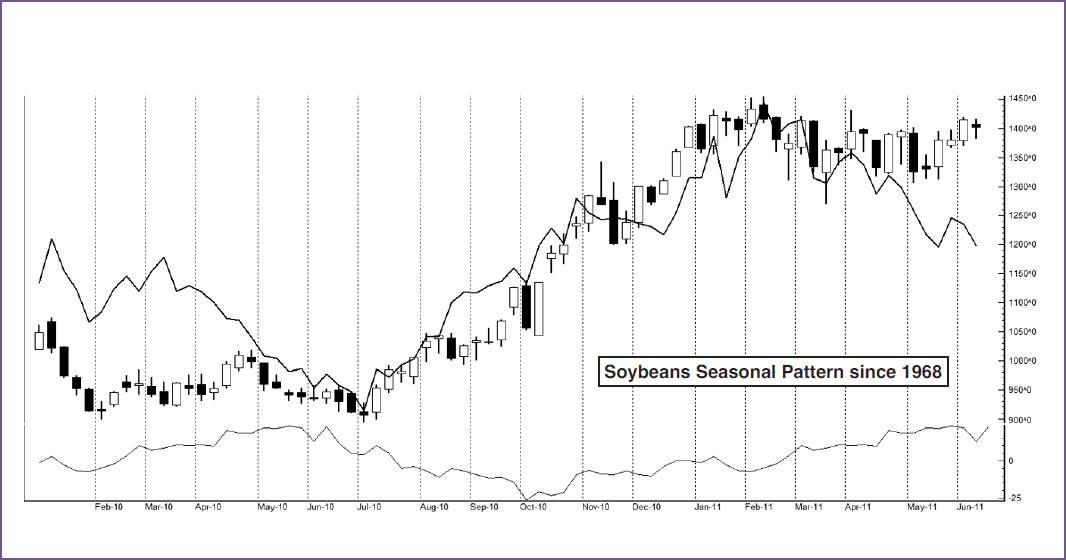
SHORT SOYBEANS FOR SUMMER
After planting season has finished through the bean belt of Illinois and up through Minnesota, soybeans tend to post a seasonal peak. Once the crop is actually planted, the fear of a reduced crop size due to planting delays from late spring storms has abated. When the crop is in the ground, traders start focusing on the potential size of the new crop. In addition, supplies are available from the South American harvest, and this puts additional pressure on prices.
JUNE SHORT SOYBEANS (SEPTEMBER) TRADING DAY: 5—HOLD: 36 DAYS
By mid-June, we have a good understanding of the crop size due to what was planted. Under ideal weather conditions, traders tend to sell the market, as producers and grain elevators start hedging or forward contracting out their crops production. This marketing effort can last through harvest time.
The new genetically modified (GMO) seed, Roundup Ready by Monsanto (MON), is more resistant than ever to insects and drought or heat stress. In addition, there has been more worldwide acceptance of this technology. U.S. farmers have increased usage and production to over 85% of this variety. This may explain why, under normal weather growing years, prices tend to decline, as there is a better estimate of the crop size.
The chart below shows the price line of the fertilizer company Mosaic (MOS) overlaid on the bar chart of soybeans. Traders looking to capture moves in soybeans may want to explore taking out positions in companies such as Mosaic that tend to correlate to the commodity’s seasonal price moves. See pages 133–138 for additional correlated trades.
SOYBEANS (S) BARS AND MOSAIC (MOS) CLOSES (WEEKLY DATA JANUARY 2010–JUNE 8, 2011)
Chart courtesy TradeNavigator.com
SUGAR’S SUMMER SWEET SPOT
Due to the many regions on the planet that produce sugar, it goes through several seasonal price swings. However, it makes a sweet tradable seasonal low in mid-June. Sugarcane harvesting in the tropics and sugar beet planting in the Northern Hemisphere in the May/June time frame create uncertainty as to the size of the coming sugar crop, and prices tend to rally.
JUNE LONG SUGAR (OCTOBER) TRADING DAY: 11—HOLD: 32 DAYS
Over the past 36 years, going long sugar on or about June 15 and holding for about 32 days has delivered gains 22 times, for a success rate of 61.1% and a total gain of $14,627. A worldwide bull market in sugar, due to heavy demand from ethanol and some adverse (wet) weather conditions, pushed sugar prices to all-time highs in early 2011. This contributed to sizeable gains for this trade in the past four years straight.
Granted this trade worked very well last year, however, using trailing stops and managing this trade would have given traders quite a bit more bang. Our exit date trade price was 19.57, but the contracts actual closing high was not reached until September 28 at 26.84.
Using technical timing tools can not only get you into this trade at more profitable entry points, but more importantly, they can help you increase gains by keeping you in a winning trade longer during strong bullish trends. It is crucial to implement technical trading techniques in conjunction with seasonal patterns.
Alternatively, you can trade sugar powerhouse, Imperial Sugar (IPSU). IPSU stock price sticks closely to sugar prices throughout the year. The chart below shows this symbiotic relationship between IPSU and sugar, with sugar’s seasonal price pattern since 1972 in the bottom section. See pages 133–138 for additional correlated trades.
SUGAR #11 (SB) BARS AND IMPERIAL SUGAR (IPSU) CLOSES (WEEKLY DATA JANUARY 2010–JUNE 8, 2011)
Chart courtesy TradeNavigator.com


SUMMER BBQ SEASON GIVES BEEF A BOUNCE
This is seasonally the best time to buy live cattle. Fundamentally, beef consumption starts to decline in hot weather, but so does supply, as feed lots are short on inventory. Cash grain prices tend to remain high, as supply decreases before harvest season. This supply/demand imbalance creates a bid under the market. Then before school season begins, federal government subsidies for school lunch programs kick in for beef purchases.
JUNE LONG LIVE CATTLE (APRIL) TRADING DAY: 14—HOLD: 160 DAYS

As winter and the holiday season approach, consumption increases. This helps keep a floor of support in cattle futures through mid-February (page 176). Enter long positions on or about June 20; then exit on or about February 7. Out of the past 41 years, this trade has worked 27 times for a 65.9% success rate.
The chart below has McDonald’s (MCD) closing prices overlaid on the front contract live cattle futures, with the seasonal price move of the futures on the bottom. It is interesting to note that while beef has a tendency to rise from June through August, MCD has a tendency to decline during this same time period on average since 1970.
Traders may want to look at long futures strategies on beef in June, and stock traders certainly want to look for companies that would benefit, or in this case, see price weakness due to a commodity market move, such as this inverse relationship between MCD and beef prices. See pages 133–138 for additional correlated trades.
LIVE CATTLE (LC) BARS AND MCDONALD’S (MCD) CLOSES (WEEKLY DATA JANUARY 2010–JUNE 8, 2011)
Chart courtesy TradeNavigator.com


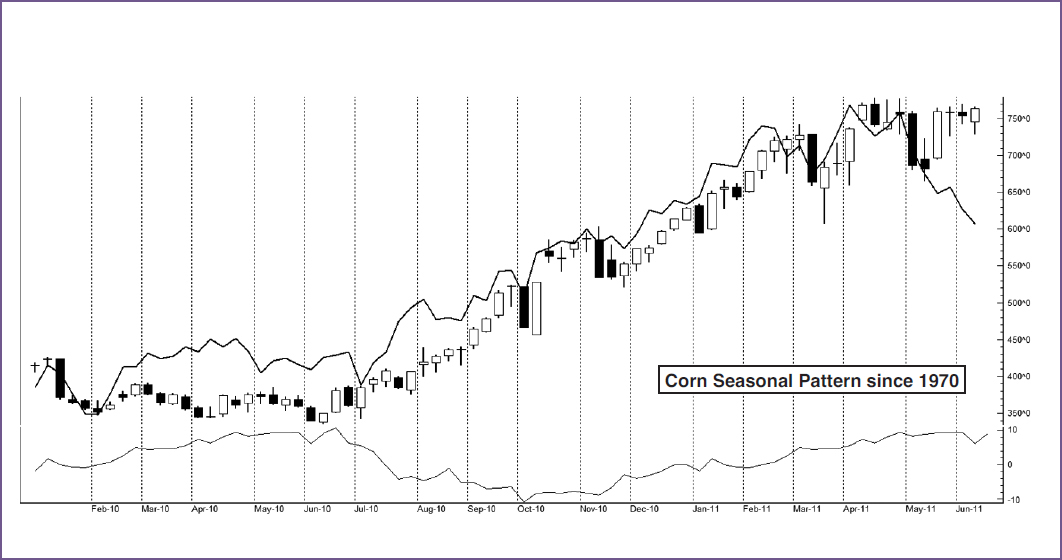
MOTHER NATURE MAKES CORN POP
Corn tends to peak in June under normal crop years, as planting is complete and farmers are looking for cooperation from Mother Nature to produce increased production yields. Look to sell on or about June 24 and hold through August 1. This is when we typically get a “drought scare” or mid-summer rally. The 41-year history of this timing strategy shows a win in 27 of those years, for a success rate of 65.9%.
JUNE SHORT CORN (SEPTEMBER) TRADING DAY: 18—HOLD: 25 DAYS
With the price increase in corn headed into summer, we normally see the market settle back, as farmers have a better idea of their crop size and start to hedge or forward contract sales out to lock in a profit. Depending on the levels of volatility, traders can look to sell futures or buy put options, or once again, look for alternative trading opportunities.
The chart below has Deere & Co. (DE) overlaid with corn prices and the bottom line showing the seasonal tendency of corn prices since 1970. As you can see, there is a high correlation of the price of corn and the share price of DE. One can look to sell DE, buy puts, or write calls in the seasonally weak time frame that starts in June and goes into July. See pages 133–138 for additional correlated trades.
CORN (C) BARS AND DEERE & CO. (DE) CLOSES (WEEKLY DATA JANUARY 2010–JUNE 8, 2011)
Chart courtesy TradeNavigator.com