OVERVIEW
ABSTRACT
We provide a synthesis of the conservation risk faced by amphibians and reptiles in California that qualify as Species of Special Concern. After assembling a full list of the native amphibian and reptile taxa that are known to occur in the state, we developed a potential set of 73 nominee taxa that might qualify as Species of Special Concern. We developed eight metrics that capture key elements of declining and at-risk species, scored them for all 73 nominee taxa based on an extensive literature review, examined them on a case-by-case basis, and developed a final set of 45 Species of Special Concern. We then developed species accounts for each Species of Special Concern, documenting available information on their basic biology, known or hypothesized reasons for decline, and proposed management and future research needs. Overall, we sought to produce a clear, transparent document that explicitly states why decisions were made and supported with a summary of the best available science. We relied on peer-reviewed literature whenever possible to support those decisions.
Our evaluation resulted in 16 Species of Special Concern categorized as Priority 1 (those of greatest concern), 14 as Priority 2, 12 as Priority 3, and 3 which we could not prioritize based on available data. Our comparative analyses demonstrated that there were certain sets of organisms, geographic areas, and groups of ecological specialists in which species of greatest concern tended to be concentrated. Taxonomically, frogs, salamanders, and turtles all had higher average metric scores than lizards or snakes, mirroring the fraction of those taxa listed at the state and federal levels, and suggesting that these lineages are often of greatest conservation concern. There was also a strong trend for aquatic taxa to experience a greater conservation risk than terrestrial species. Geographically, southern California harbored more Species of Special Concern than central or northern California. This pattern was driven primarily by reptiles, which have a preponderance of at-risk species in the Southern California Coast, Southern California Mountains and Valleys, and the Mojave Desert ecoregions. Amphibian Species of Special Concern tended to be more evenly distributed across northern and southern California ecoregions.
In a troublingly large number of cases, we found a striking lack of critical data for many aspects of the basic biology of amphibian and reptile species, and this lack of field ecology, natural history, and genetic data hindered our ability to make strong management recommendations. The solution to this lack of data is clear: California needs to launch a program that funds strong, peer-review quality analyses of basic ecology, combined with long-term monitoring studies to evaluate demographic trends at a set of sites for each species. Such studies need not be expensive and would make an enormous difference in our ability to manage many Species of Special Concern, hopefully precluding the need for future state and/or federal listing. Meaningful collaboration between the California Department of Fish and Wildlife and other research groups (be they other agencies, universities, nongovernmental organizations, or avocational groups) has helped to fill some of these gaps, particularly for federally listed species, and such collaborations for Species of Special Concern are the key to developing management plans into the future. We also found that in many cases population genetic approaches can help to fill critical gaps in our knowledge regarding species and subspecies boundaries, effective population sizes, corridors of likely habitat use, migration frequencies and pathways, and levels of hybridization with native and introduced species. These genetic measures should complement, rather than replace field studies, and they offer the opportunity to conduct relatively fast analyses that can and should provide critical early guidance for management decisions.
As critical basic biodiversity work in California continues, we are increasingly recognizing that the complex geology and changing environmental conditions in the state have led to the evolution of an amazing array of endemic taxa, many of which are extreme habitat specialists. To our knowledge, none of these sensitive species have been lost to extinction yet, although several are dangerously close. However, at least four taxa whose range limits historically entered the margins of the state may already be gone from California’s boundaries, and some of the endemic species may be next. The identification of Species of Special Concern and the compilation of information, research needs, and management recommendations represents an important step to help California land managers prevent further declines, stabilize key populations, and potentially initiate recovery programs before formal listing is necessary.
INTRODUCTION
From a biodiversity perspective, California resides at one of the most important crossroads in the United States. The California Floristic Province is the only globally recognized biodiversity hot spot in North America north of Mexico, and one of three recognized in the north-temperate region (Myers et al. 2000). With a 2010 population of more than 37 million people, California accounts for roughly one-eighth of the human population of the United States (US Census Bureau 2013), has the largest agricultural production of any state in the country (USDA 2007), and has one of the highest average land values in the nation (Davis and Heathcote 2007). Conserving biodiversity in California is therefore both enormously important and extremely difficult from an economic and political standpoint and requires strong scientific guidance and the collective will of multiple stakeholder groups.
Formal species protection in California is accomplished via the California Endangered Species Act and/or the Federal Endangered Species Act. The California Department of Fish and Wildlife (CDFW) is responsible for implementing the latter. As of January 2014, over 150 animals in our state were listed as threatened or endangered under either one or both acts. To help preclude the need to list additional species, the CDFW administratively designates Species of Special Concern. The intent of designating Species of Special Concern is to (1) focus attention on animals at conservation risk by the CDFW, other state, local, and federal governmental entities, regulators, land managers, planners, consulting biologists, and others; (2) stimulate needed research on poorly known species; and (3) achieve conservation and recovery of these animals before they meet California Endangered Species Act criteria for listing as threatened or endangered. Species of Special Concern carry no formal legal status but are widely viewed as one of the important front lines in species conservation planning and management. Regardless of the stakeholder group involved, whether members of the conservation, agricultural, or urban development communities, it is in everyone’s best interest to maintain stable populations of Species of Special Concern to avoid the need for formal listing.
The Species of Special Concern designation is used to promote conservation in various ways by the CDFW, land managers, and others to promote conservation. For example, Species of Special Concern are considered “Species of Greatest Conservation Need” in California’s Wildlife Action Plan (Bunn et al. 2007, http://www.wildlife.ca.gov/SWAP). State Wildlife Action Plans outline the steps needed to conserve these taxa before they become rarer and more costly to protect and provide access to funds for this purpose. Species of Special Concern are also considered when evaluating environmental impacts under the California Environmental Quality Act (California Public Resources Code Sections 21000–21177). The California Environmental Quality Act requires state agencies, local governments, and special districts to evaluate and disclose impacts to wildlife and habitat from proposed projects. Specifically, Species of Special Concern may meet the definitions of endangered, rare, and/or threatened in Section 15380 of the California Environmental Quality Act guidelines. Also, Section 15065 relates to the standards under which the lead agency determines if impacts to biological resources should be considered significant. Impacts to Species of Special Concern are generally considered significant if they are based on factors such as population-level effects, proportion of the taxon’s range affected by the project, and effects on habitat. Environmental impact reports that analyze and evaluate the potential impacts on Species of Special Concern caused by the proposed project must be prepared before planned projects can move forward. Large-scale planning efforts, such as Habitat Conservation Plans and Natural Community Conservation Plans, also may include conservation measures for non-listed, at-risk species including Species of Special Concern. In addition, Species of Special Concern are tracked by the California Natural Diversity Database (http://www.dfg.ca.gov/biogeodata/cnddb), an important source of information on species distribution. Federal land management agencies like the Bureau of Land Management and US Forest Service often add Species of Special Concern to their sensitive species lists to focus attention on these taxa. In all, the Species of Special Concern designation results in a greater depth of knowledge about species as well as proactive conservation aimed at maintaining or restoring populations to avoid the need for future, formal listing.
In this volume, we update and evaluate the original Species of Special Concern document for amphibians and reptiles (Jennings and Hayes 1994a). The first Species of Special Concern document compiled was for birds (Remsen 1978). Over the following three decades, documents have been published or updated for birds (Shuford and Gardali 2008), mammals (Williams 1986; Bolster 1998), and fishes (Moyle et al. 1989, Moyle et al. 1995). As these documents have matured and been revised, so too have the methods by which Species of Special Concern have been identified from the potential pool of candidate taxa. With the exception of the 2008 bird publication, previous iterations of these assessments were largely based on expert opinion. A list of native California taxa was assembled, screened for risk potential, and evaluated by a small team of experts (usually in consultation with many additional experts throughout the state). The most at-risk taxa not already listed under the California Endangered Species Act were then selected as Species of Special Concern.
The Species of Special Concern assessment process changed profoundly with the 2008 bird publication (Shuford and Gardali 2008). A key change, and one that we also follow here, was to formalize the criteria by which species receive this designation. Following Shuford and Gardali (2008) and current CDFW standards (http://www.dfg.ca.gov/wildlife/nongame/ssc/index.html), we created a set of eight metrics that capture the extent to which an amphibian or reptile species is at risk of extinction in California. We used this system to increase transparency, facilitate clear feedback from a broad group of individuals on our scoring, and enhance the ability of the CDFW and other agencies to replicate this process in the future. We then ranked all species by their summed metric scores, presented that ranking to a wide-ranging group of experts, and determined inclusion or exclusion from the special concern list. This approach provided a clear connection between data and ranking, and an explicit description of the most important factors contributing to ongoing declines. It also provided a strong connection between the evaluation process for different taxonomic groups and therefore greater uniformity in the methodology used among all CDFW Species of Special Concern publications.
The current volume is divided into two sections. In Part I (this section), we provide a detailed description of our methods, including the metrics and their scoring, outreach strategies for public input, locality mapping, and the roles of different contributors in producing the set of Species of Special Concern taxa. Following this is an overview of the results of our review and several quantitative descriptions of geographical, ecological, and taxonomic patterns of Species of Special Concern. We end with a discussion of the results and present recommendations for the conservation of amphibian and reptile Species of Special Concern in California. Throughout, we emphasize immediate research needs, both for particular species and for broader assemblages and landscapes within the state. Part II consists of a series of species accounts that provide a synopsis of information for each Species of Special Concern. Each account also includes a map documenting localities where the species has been collected or observed along with a depiction of its current range.
Throughout this document, we have used the peer-reviewed literature as our primary source of information and have included unpublished reports, web sites, and data from the field notes of professional and avocational herpetologists to fill in gaps in the primary literature. We rely primarily on the peer-reviewed literature because it has been evaluated by independent experts and deemed admissible into the scientific literature. However, we also recognize that the published literature for many species is sparse, and in those cases we also evaluated and included a large amount of unpublished information. Finally, we particularly emphasized the more recent, post-1990 literature, given the extensive review by Jennings and Hayes (1994a) of the earlier literature.
METHODS
Overview of Project Design and Process
The process of developing this document involved cooperation among several groups. The initial study design was developed collaboratively between the CDFW and the authors (Thomson, Wright, and Shaffer). We then assembled a Technical Advisory Committee comprising members with broad geographical and taxonomic expertise in California’s amphibian and reptile fauna. This group developed the set of metrics used in evaluating potential Species of Special Concern, as well as a standardized format for species accounts. We then reached out to all segments of the herpetology community, including academics, land and resource managers, avocational herpetologists, and the interested public for further information, feedback, and review at various points in the process. Our goal throughout was to keep our actions and decisions transparent and accessible to anyone with an interest in herpetological conservation in California.
We began by developing a current list of all native amphibian and reptile species and subspecies known to occur in the state (Appendix 1). Based on the broad knowledge of field herpetology represented by the authors and the Technical Advisory Committee, we used this list to develop a set of Special Concern nominees. Our goal was to include in this nominee list all taxa that anyone felt were declining or in need of protection in the state. The authors conducted preliminary reviews of each of these taxa, searching the literature and interviewing experts, and used these data to produce a set of preliminary scores for each of the nominees using the risk metrics. These scores were reviewed and refined by the Technical Advisory Committee and then further reviewed and refined based on input from the herpetological community at large. The authors and Technical Advisory Committee used the metric scores, as explained later in this document, to construct a set of taxa for inclusion as Species of Special Concern. After the list was finalized, we produced species accounts for each of the Species of Special Concern.
During this evaluative process, we compiled locality information for each taxon, which we then combined with data from the California Natural Diversity Database and Biogeographic Observation and Information System to produce distribution maps for each nominee species. The Technical Advisory Committee, the CDFW, and other experts reviewed these range maps, resulting in the maps in this document.
Species List, Taxonomy, and Units of Conservation
We developed our species list by compiling information from existing taxonomic lists and recent taxonomic literature. We included all recognized or proposed species, subspecies, and distinct population lineages that have been identified. We generally used the most recent revisionary studies, although we sometimes made decisions based on the degree to which the scientific community had accepted proposed changes and the quality and strength of data informing proposed revisions. Little consensus exists on taxonomy for certain groups (e.g., California mountain kingsnake, Lampropeltis zonata), and we tried to strike a balance between incorporating the most current, reliable information while also maintaining taxonomic stability in the face of current uncertainty. For example, Frost et al. (2006a) proposed a large number of taxonomic changes for California amphibians, often shifting species into new generic name combinations (e.g., the western toad, Bufo boreas, changes to Anaxyrus boreas under this scheme). These changes have been vigorously debated (Crother et al. 2009, Frost et al. 2009a, Pauly et al. 2009), and we have taken the conservative approach of retaining the traditional nomenclature.
We focused our evaluation primarily at the species level, although we also considered subspecies and (rarely) parts of an otherwise stable species range that appeared to be in decline. This follows most similar efforts to date in recognizing species as the fundamental units of conservation, while still acknowledging that significant diversity exists and should be maintained within species. This also allowed us to limit the extent to which taxonomic controversy might negatively impact important conservation efforts. For example, if we were to consider only species (or formally described subspecies), we would fail to consider currently unnamed populations in need of conservation action. The southern populations of the common garter snake (Thamnophis sirtalis) are an example of such a population, as are the southern populations of the Coast Range newt (Taricha torosa). Throughout this document we use the term “taxa” to refer to species, subspecies, or distinct populations.
Development of the Nominee List
The first stage in the process was to develop a list of nominee Species of Special Concern from the comprehensive list of taxa that occur in the state. We included all taxa from the previous amphibian and reptile Species of Special Concern document (Jennings and Hayes 1994a), those that were recently extirpated or possibly extirpated from the state, and all taxa currently listed under the Federal Endangered Species Act. We excluded any taxa that were already legally designated by the state (i.e., Endangered or Threatened under the California Endangered Species Act), because Species of Special Concern status would provide no further state-level protections. Although federally listed taxa also experience a higher level of protection than Species of Special Concern, we still considered them in the evaluation process because federal status could potentially be the result of conservation needs from parts of the species’ range outside of California. Because of this, an assessment of each species focusing on its California range provides information about its status within the state.
We included additional nominee taxa that members of the Technical Advisory Committee identified as potentially at risk based on their experience with that taxon in the field. If at least one member of the committee suspected that a taxon might qualify as a Species of Special Concern, we included it for evaluation. Additional taxa were added through consultation with experts on specific species or larger taxonomic groups and by suggestion during the public comment phase of the project (see below). We then evaluated these taxa with the risk metrics and used the resulting scores as our primary basis for Species of Special Concern determination (see below).
Definition of Species of Special Concern
We define a Species of Special Concern as any native species, subspecies, or distinct population of amphibian or reptile occurring in the state that currently meets one or more of the following criteria (see also Comrack et al. 2008):
• Is extirpated from the state within the recent past;
• Is listed as federally, but not state, Threatened or Endangered and/or meets the state definition of Threatened or Endangered but has not formally been listed;
• Is experiencing, or formerly experienced, serious, noncyclical, population declines or range retractions that, if continued or resumed, could qualify it for state Threatened or Endangered status;
• Has naturally small populations and/or range size and exhibits high susceptibility to risk from any factor(s) that, if realized, could lead to declines that would qualify it for state Threatened or Endangered status.
We developed a set of risk metrics to address the latter two criteria. Taxa scoring high on these risk metrics were then judged to be prime candidates for inclusion on the list. Taxa meeting the first two criteria were included automatically. All taxa were scored for the risk metrics and included in our quantitative analyses.
Risk Metrics
Working with the Technical Advisory Committee and using CDFW criteria (http://www.dfg.ca.gov/wildlife/nongame/ssc/index.html), we developed a set of conservation risk metrics to quantify the level of threat to California’s at-risk amphibians and reptiles. Although quantification of conservation risk is necessarily approximate, the metric approach allows for improved repeatability between Species of Special Concern updates and a framework for discussion and revision. Earlier Species of Special Concern documents were based largely on expert opinion and the use of risk metrics does not completely eliminate this important element of the assessment process. Rather, the risk metrics place expert opinion, as well as data, within a standardized framework that makes decisions more transparent. For example, our ecological tolerance metric provides a clear definition of how we quantified the ecological specialization of each taxon and how it relates to conservation risk. If, at a later time, additional data become available or other workers disagree with our interpretation of the existing data, there now exists a clear way in which this new information can be incorporated into the overall score for any species.
The possible score for each metric ranged from 0 (little or no risk) up to a maximum of 25 (high risk), reflecting the relative importance of the risk quantified by that metric. We weighted metrics that measure documented conservation concerns, such as declines in abundance, more highly than other metrics that focused on potential conservation concerns, such as life history factors that contribute to sensitivity. We did this for two reasons. First, our weighting reflects the emphasis on these factors in the definition of Species of Special Concern. Second, documented conservation concerns usually require more immediate management action and are likely more serious threats to survival than potential conservation concerns. The result of this decision is that some metrics, such as those measuring declines in distribution or abundance, affected the overall risk metric score more than, for example, a naturally small range size. The eight risk metrics are as follows.
I. Range Size
The range size metric estimates the percentage of California that each taxon occupies. Though this measure could be treated as continuous, we have approximated it with discrete categories for two reasons. First, we have little biological reason to believe that a taxon that occupies, for example, 35% of California is under any greater conservation risk than a taxon that occupies 42%. Both of these hypothetical taxa occupy moderate portions of the state and probably experience similar risk arising from the size of their range. Second, there is inherent uncertainty in many amphibian and reptile range predictions as portrayed in range maps, and we felt that it was more appropriate to broadly categorize ranges rather than attempt to precisely estimate them. We therefore categorize range size as small, which includes those taxa that are at immediate risk from relatively small scale disturbances; medium, which includes taxa that occupy a portion of the state that is big enough so that a single large catastrophic event would be unlikely to affect the entire range; and large, which includes those taxa that occupy such a large portion of the state that range size itself is unlikely to have any significant impact on threat. Patchiness and ecological specialization of species that limit range on a local scale are quantified in other metrics. Our aim for this metric is only to estimate the actual size of the species range. In the few cases where the known range is strictly limited by habitat specialization or limitation (e.g., desert populations of the regal ring-necked snake, Diadophis punctatus regalis, or the Gila monster, Heloderma suspectum) and the taxon almost certainly does not occur between isolated habitat patches, we treated the known populations as individual polygons in scoring this metric.
(I) RANGE SIZE (% OF CALIFORNIA OCCUPIED) |
SCORE |
Small (<10%) |
10 |
Medium (10–50%) |
5 |
Large (>50%) |
0 |
II. Distribution Trend
The distribution trend metric aims to quantify documented decreases in the overall range of each taxon based on extirpation of previously known localities. The total score for this metric comes from two sources. First, we attempted to quantify the extent of known range reductions, scoring them using the categories below. We classified the extent of range reduction into discrete categories for similar reasons as range size. We then added an additional 5 points if the documented reduction in range appears to have been ongoing since the last Species of Special Concern document was published (Jennings and Hayes 1994a) and has not yet stabilized or reversed. We did this to increase the weight of declines that are continuing at present, and which therefore are likely to continue in the immediate future. As a result, a species might attain a particular score through either a documented reduction or a less severe reduction that is ongoing. In scoring this metric, we used peer-reviewed published data whenever possible. The best data for this metric came from repeated field surveys of habitat through time, and we used them whenever they were available. However, datasets of this type are, at present, uncommonly available for amphibian and reptiles of California.
(II) DISTRIBUTION TREND |
SCORE |
Severely (>80%) reduced |
20 |
Greatly (>40–80%) reduced |
15 |
Moderately (>20–40%) reduced |
10 |
Slightly (<20%) reduced or suspected of having been reduced but trend unknown |
5 |
Stable (∼0% reduced) or increasing |
0 |
Add 5 additional points if negative trend is ongoing for a total of 25 points possible for this metric. |
|
III. Population Concentration/Migration
This metric focuses on whether features of the life history of individual taxa, such as migration events or aggregations, make them naturally vulnerable to decline or extirpation. For instance, taxa that migrate to breed in ponds are exposed to additional risk during the migration itself (e.g., road crossings) as well as increased risk while concentrated in the breeding habitat. This latter risk could come about if a catastrophic event occurs during the breeding concentration (e.g., if a toxic spill or group of predators killed the breeding animals) or because the actual breeding site is destroyed (e.g., draining of the aquatic breeding habitat). We score this trait either present or absent based on the available life history data for each taxon.
(III) POPULATION CONCENTRATION/MIGRATION |
SCORE |
Vulnerable life stages present |
10 |
No vulnerable life stages |
0 |
IV. Endemism
The endemism metric captures the percentage of a species’ entire range that occurs in California. Endemism determines the extent to which conservation actions in California are likely to impact the taxon’s persistence range-wide. From another perspective, this is a way of measuring California’s responsibility to conserve individual species. Taxa whose range is completely, or nearly completely, contained within California’s borders are in need of greater conservation consideration from our state than taxa whose range only extends peripherally into California. We recognize that this presumes appropriate conservation measures are also being implemented in other areas of North America (including Mexico and Canada). We again made this measure discrete in recognition of the inherent uncertainty in our knowledge of range limits.
(IV) ENDEMISM (% OF ENTIRE RANGE IN CALIFORNIA) |
SCORE |
100% (endemic) |
10 |
>66–99% |
7 |
33–66% |
3 |
<33% |
0 |
V. Ecological Tolerance
This metric measures ecological specialization. Species that are narrow specialists on specific ecological resources (such as habitat, prey, temperature regimes) are inherently more sensitive to ecological disturbance than species that can tolerate a wider range of ecological conditions. In addition to the degree of specialization, we also considered the extent to which the resource that each taxon specializes on is common or rare. For instance, several saxicolous (rock loving) lizard species (e.g., the leaf-toed gecko, Phyllodactylus nocticolus) use rocky habitats that occur throughout extensive areas of the species’ total range. We scored cases like this as specialists on a common resource. Conversely, vernal pool breeding amphibians (e.g., Couch’s spadefoot, Scaphiopus couchii) require temporary aquatic pools that are rare throughout their range for successful breeding. We scored these taxa as specialists on a rare resource. We adjusted the rareness of the resource with respect to its availability within the species’ range, rather than its availability within the state.
(V) ECOLOGICAL TOLERANCE |
SCORE |
Narrow ecological specialist on a rare resource |
10 |
Narrow ecological specialist on a common resource |
7 |
Moderate ecological specialist |
3 |
Broad ecological tolerance |
0 |
VI. Population Trend
The population trend metric captures changes in abundance at localized, population-level sites. This is distinct from the distribution trend, which measures extirpation of localities; population trend captures declining abundances at localities that are not extirpated. In many cases, distributional declines as measured by distribution trend will be associated with earlier declines as measured by population trend. This raises the potential of scoring taxa twice for the same decline. To avoid this, we scored population declines that have led to extirpation under the distribution trend metric. We gave those same taxa high scores for the population trend metric only if additional population declines have been documented at currently extant sites. We scored population trend in the same way as distribution trend, first scoring the extent of the decline and then adding an additional 5 points if evidence suggests that the trend is ongoing. As a result, a species might attain a particular score through either a documented reduction or a less severe reduction that is ongoing.
(VI) POPULATION TREND |
SCORE |
Severe declines (>80% reduced) |
20 |
Great declines (>40–80% reduced) |
15 |
Moderate declines (20–40%) |
10 |
Slight (<20%) or suspected declines |
5 |
Stable (∼0% reduced) or increasing |
0 |
Add 5 additional points if declines are ongoing. |
|
VII. Vulnerability to Climate Change
The climate change metric measures a taxon’s sensitivity to the projected effects of climate change. We scored this metric using the projected impacts on California landscapes based on the California Climate Action Team assessments (Cayan et al. 2008a), followed by our interpretations of how these impacts are likely to affect each taxon based on life history and habitat requirements. For example, climate projections suggest that snowpack in the Sierra Nevada is likely to decrease by 30–90% (depending on carbon emissions and the climate model used) over the next 100 years, leading to a narrower window of time over which the spring snowmelt will occur (Maurer and Duffy 2005, Cayan et al. 2006, Maurer 2007). This is likely to have an impact on the snowmelt-dependent aquatic habitats that many Sierran amphibians use for one or more life stages, and may also reduce the time period over which moist microhabitats will occur in forest ecosystems. Other impacts that we considered for this metric included changing hydrology (amount and variation of precipitation), temperature, wildfire frequency and intensity, and changes in the extent of habitat and vegetation types. Given our imprecise knowledge of both future climate change effects and their impacts on species, we discretized this impact into four broad categories.
(VII) VULNERABILITY TO CLIMATE CHANGE |
SCORE |
Highly sensitive |
10 |
Moderately sensitive |
7 |
Slightly sensitive |
3 |
Unlikely to be sensitive |
0 |
VIII. Projected Impacts
The projected impacts metric estimates the effect that future threats may have on each species over the near term (20 years). It does not incorporate threats arising from changing climate, because these are captured in a separate metric. This includes impacts stemming from known threats, such as planned or projected habitat loss and, to a lesser extent, impacts from irregularly occurring threats, such as disease outbreaks. Given the potential for these risks to be reduced by management, plus the inherent uncertainty associated with complex projections, we considered potential threats to be of relatively less importance than documented threats such as population declines.
(VIII) PROJECTED IMPACTS (OF THREATS OVER THE NEXT 20 YEARS) |
SCORE |
Serious |
10 |
Moderate |
7 |
Slight |
3 |
No substantial impact |
0 |
Scoring Nominee Taxa
We scored all of the nominee taxa for each of the eight metrics based on the best available evidence. To begin with, the primary authors produced a brief summary of the state of conservation knowledge for each nominee taxon and used these summaries to perform a preliminary scoring assessment. In making these assessments, we included the peer-reviewed literature, unpublished reports, survey data, field notes, and the opinions of knowledgeable biologists. In several cases, few data were available to make assessments for a given metric. In these cases, if the data appeared to be strong enough to clearly indicate that a threat was present, we scored that taxon using the most precise estimate that we were able to make. In cases where no data were available or the limited data were ambiguous, we scored taxa as “data deficient” for that metric. Following these preliminary assessments, we circulated all of the scores and taxon summaries to the Technical Advisory Committee for review and further input. In the rare cases of substantial disagreement, we discussed the issue and evaluated the data as a group, and reached a consensus on the most reasonable score for a given taxon.
After this preliminary scoring process was complete, we created an overall score for each taxon by summing its metric scores and dividing by the total score possible for that taxon (Total Score/Total Possible). Using the ratio of total score to total possible score allowed us to normalize the scores across varying levels of data deficiencies. For example, in cases where a taxon was scored as data deficient for one or more metrics, the total possible score was lower than would be the case if all metrics had been scored. This would result in a lower risk assessment due to uncertainty as opposed to data, and we used standardization by the Total Possible score in order to focus on documented risks.
Public Comment
After the scoring assessments were complete, we opened a 60-day public comment period by posting all of our initial findings on the project’s website and sought input widely on herpetological and conservation-oriented email lists and websites (Appendix 2). We requested comments and feedback on the initial set of scores, additional data that could inform the scoring (particularly for the metrics that had been scored as data deficient), and feedback on the process to date. When individuals suggested changes to the metric scores, we asked for a short explanation of what should be changed and why, along with any data and/or field notes that were available to support the proposed change. At the close of the public comment period, we compiled and evaluated all of the information that we received (see Results, Public comment). We evaluated each proposed change on a case-by-case basis, usually making the change if it was reasonable, supported by information (in the form of unpublished reports, data, or field notes), and not in strong conflict with other existing data. In cases where a suggested change was in strong conflict with other data, we asked that the contributor supply additional data justifying their viewpoint and made a decision on the final resolution of any conflicting information.
We also asked that contributors send additional data that could be incorporated into the locality maps (see below). To facilitate this process, we supplied a standardized data sheet similar to that used for data submission to the California Natural Diversity Database. These localities were added to the California Natural Diversity Database and to our set of existing localities, and they were used in developing range maps.
Ranking and Determination of Species of Special Concern Status
After incorporating the information received during the public comment period, we worked with the Technical Advisory Committee to develop the set of Species of Special Concern taxa. Taxa with the highest scores were included on the list, while those with intermediate scores were evaluated on a case-by-case basis; this combined approach was similar to that used in the Bird Species of Special Concern (Shuford and Gardali 2008). Specifically, taxa that had intermediate scores but had a combination of exceedingly small range size, extreme ecological specialization, and high projected impacts were included as Species of Special Concern. In essence, this approach weights the combination of these factors more heavily in order to meet the last of the four criteria for inclusion as a Species of Special Concern, “small populations and/or range size and exhibits high susceptibility to risk from any factor(s), that if realized, could lead to declines that would qualify it for state Threatened or Endangered status” (Comrack et al. 2008).
We further ranked Species of Special Concern into three priority categories based on the severity and immediacy of threats affecting each taxon. Priority 1 Species of Special Concern are those taxa that are likely to experience severe future declines and/or extirpation without immediate conservation actions. Priority 2 Species of Special Concern require substantial conservation and management actions, although the threats facing them are less immediate and severe than those in Priority 1. Finally, Priority 3 Species of Special Concern are clearly at risk but likely are not experiencing a substantial and immediate threat of extirpation, although the potential for this threat to develop exists if no management actions are undertaken. One of the primary goals of the Species of Special Concern designation is to identify taxa for which managers can undertake relatively small scale and achievable conservation actions that will negate the need for more costly and serious listings at a later date. Priority 3 taxa are prime candidates for such efforts.
Watch List and Additional Taxa in Need of Research and Monitoring
Taxa that were previously considered Species of Special Concern but are no longer included comprise a Watch List (Appendix 3). Appendix 3 includes an explanation for each taxon’s change in status and discusses future conservation concerns regarding Watch List taxa. In Appendix 4, we discuss several other taxa in need of research and monitoring that did not warrant inclusion as Species of Special Concern. Some of these were taxa that had scores indicating a lower, but still substantial, amount of risk. Although we decided that they were at a lower priority than the Priority 3 Species of Special Concern and therefore should not be so designated, they formed a group of species to reevaluate in the future. We were also missing important information for some taxa that would have allowed us to make more informed judgments about conservation status. We devote a paragraph to each of these additional taxa in need of research and monitoring in Appendix 4, briefly describing the threats facing each and outlining research and management needs.
Species Accounts
We prepared a species account for each Species of Special Concern that summarized our findings and the relevant aspects of the taxon’s biology. We also provided management and research recommendations for each taxon. These accounts follow a standardized format containing each of the following sections.
Status summary. The status summary is a short explanation of each animal’s current and former status as a California Species of Special Concern, including its priority level. In the first version of the Amphibian and Reptile Species of Special Concern monograph, Jennings and Hayes (1994a) categorized each taxon according to whether they felt it was a Species of Special Concern or met the criteria for listing as Threatened or Endangered under the California Endangered Species Act. However, this strategy led to some potential confusion because the Jennings and Hayes (1994a) Threatened and Endangered categories did not correspond to actual state listing categories, nor had taxa they described as Threatened or Endangered undergone the rigorous status evaluation required to assess status under the California Endangered Species Act. To avoid this confusion, we used Priority categories (1, 2, or 3) to convey similar information on relative severity of threat as represented in the ranking of Species of Special Concern. This section also contains the overall metric score.
Identification. The identification section summarizes and explains the diagnostic characters for each animal, providing a guide for identifying it in the field. This section also explains how to differentiate each taxon from similar species with which it may be confused. Several taxa within the state are members of morphologically similar species complexes that have been identified primarily based on molecular data. In some of these cases, accurate identifications using morphological characters alone are difficult or impossible, and we generally recommend that biologists rely on geographic range. We also provide references to the taxonomic literature to guide the reader to the more thorough and technical descriptions of morphology that are beyond the scope of this document.
Taxonomic relationships. In addition to identification information, we provide a summary of the taxonomic status of each animal. This section contains information on current controversies over scientific names, at either the species or higher taxonomic levels. It also summarizes our current understanding of phylogenetic relationships, intraspecific variation, and species boundaries among closely related taxa.
Life history. This section summarizes the current state of knowledge for each taxon’s life history, which broadly includes ecology, natural history, and breeding biology. As an exhaustive review of life history information would be enormous for some taxa, we focused on information that is most relevant to current and future management actions and to the risk metrics. Specifically, we concentrated on information that relates to timing and duration of reproductive activity, daily and seasonal activity, and dietary information. Because management efforts for many taxa could be greatly enhanced by a better understanding of life history, we attempted to point out the areas that require further study rather than speculating about the details of life history where the data are weak. We emphasized data from California populations, but used data from other areas of the range or similar species when those were the best available data. We note when we used data from non-California populations and why we believed that the data could be accurately applied.
Habitat requirements. This section focused on the current state of knowledge concerning habitat use, preferences, and requirements. We attempted to distinguish between habitat preferences, the habitats in which the taxon is most frequently found, and habitat requirements, which are the characteristics of the habitat that the taxon requires for survival over long timescales.
Distribution. This section describes each animal’s current distribution and makes an assessment of changes that have occurred throughout its documented history in the state. We focused primarily on the known distribution within the state, although we also discussed the distribution outside of California if applicable. Finally, to stimulate additional fieldwork, we point out areas where the distribution is poorly known or there is a high probability of significant new localities being discovered.
Trends in abundance. This section reviews information relating to changes in abundance throughout each taxon’s documented history. For current population status, we used quantitative population-level analyses where available. However, these kinds of data are rare. Historical data tend to be spotty and incomplete for amphibians and reptiles, and much of the historical information comes from nonquantitative sources, including field reports and personal communications from experienced field biologists.
Nature and degree of threat. This section contains a detailed description of the principal threats that each taxon faces. We highlighted both the nature and severity of different threat sources, while discussing any uncertainty and conflicting data in the literature associated with these threats. We evaluated the weight of evidence and discussed what threats might be playing the largest role(s) in causing declines.
Status determination. This section connects the information on different sources of threat to the metric scores and Species of Special Concern priority categories. We explained the rationale for our determination and the seriousness of the different major threats facing each taxon.
Management recommendations. This section makes recommendations aimed at achieving sound, biologically based management and status improvement for each Species of Special Concern. Wherever possible, we made these recommendations both taxon-specific and action-oriented to allow conservation resources to be put directly into management efforts, rather than into further development of management strategies. We did, however, recommend further research and strategy development as a prerequisite to effective management for taxa that lacked necessary data.
Monitoring, research, and survey needs. This section outlines the additional information necessary to achieve effective management and status improvement. In general, information needed to inform management actions falls into the general areas of monitoring, research, or surveys, and we discuss each as appropriate.
Maps. We developed locality maps to complement the distribution information in the text for each taxon by compiling data from museum collections, state agency databases (e.g., California Natural Diversity Database), and other online databases (e.g., North American Field Herping Association) (Table 1). Data from the CDFW’s California Natural Diversity Database and the Biogeographic Information and Observation System were assessed up through April 2012. Museum locality data from HerpNet and the Global Biodiversity Information Facility were assessed through February 2012. Our goal was to develop a set of annotated and geo-referenced localities that accurately describe each taxon’s range. Records that appeared to be possibly erroneous (i.e., those that occurred in unexpected areas) were checked individually and excluded in those instances where no supporting information could be found or where the specimens were misidentified (see individual species accounts). We attempted to verify all records coming from online databases and the public by requesting, minimally, photo vouchers or detailed field notes to substantiate the record. The California Natural Diversity Database contains localities that lack this information, so we followed up on questionable records by attempting to contact the individual(s) that initially reported the record. We submitted most new localities that we gathered to the California Natural Diversity Database to make them available for future workers. In a few cases, we could not obtain permission to include localities in the database, so these were included in the maps in this volume, but excluded from the database. The complete geospatial dataset and associated metadata from this project are accessioned in the CDFW’s Biogeographic Information and Observation System (BIOSds644).
TABLE 1
List of museum collections and other data sources that were queried for locality records
Museum Collections |
American Museum of Natural History |
Arizona State University |
Brigham Young University |
California Academy of Sciences |
California Academy of Sciences, Stanford University Collection |
California State University, Chico |
Carnegie Museum of Natural History |
Cincinnati Museum Center |
Cornell University Museum of Vertebrates |
Humboldt State University |
Los Angeles County Museum |
Museum of Comparative Zoology, Harvard University |
Museum of Vertebrate Zoology, University of California, Berkeley |
National Museum of Natural History |
Royal Ontario Museum |
San Diego Natural History Museum |
Santa Barbara Museum of Natural History |
Slater Museum of Natural History |
Sternberg Museum of Natural History |
University of Alberta Museum of Zoology |
University of Arizona Museum of Natural History |
University of California, Davis - Zoology Collection |
University of California, Santa Barbara |
University of Colorado Museum of Natural History |
University of Michigan Museum of Zoology |
University of Nevada Reno |
University of Texas at El Paso |
Yale Peabody Museum |
Zoological Institute of the Russian Academy of Sciences |
Other Sources |
Cal Photos |
California Biogeographic Information and Observation System |
California Natural Diversity Database |
Field Notes |
Literature Records |
Mendocino Redwood Company |
North American Field Herping Association |
Our Own Surveys |
Public Input/Personal Communications |
US Forest Service |
US Geological Survey |
After removing erroneous and questionable records from the data, we developed point locality maps with our CDFW Geographic Information System specialist by projecting all localities for each taxon to the California (Teale) Albers projection (figure 1). We used the California Wildlife Habitat Relationships (http://www.dfg.ca.gov/biogeodata/cwhr) mapping protocol to develop range maps for each taxon using these localities. California Wildlife Habitat Relationships is a comprehensive information system for the state’s terrestrial vertebrates that seeks to integrate data on species life history, habitat needs, and ranges.
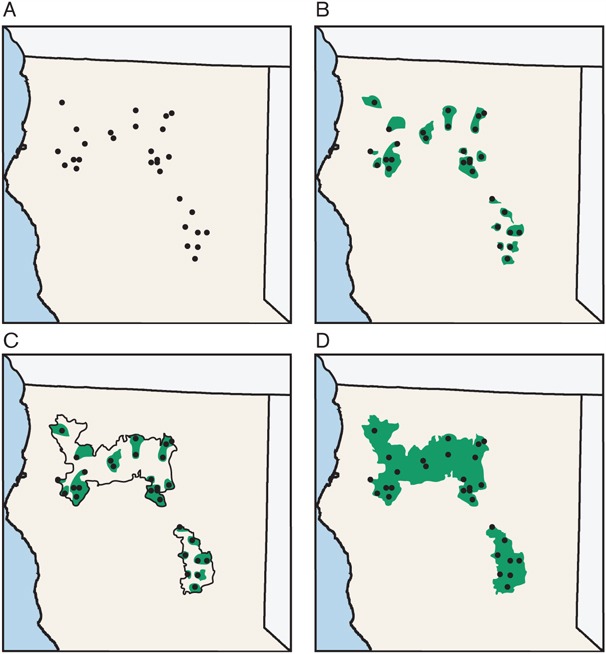
FIGURE 1Development of range maps for each species. We began by plotting localities on a base map in a geographic information system (A). We then selected the intersection of these localities with an objective geographic object such as US Department of Agriculture (USDA) Ecoregion subsection boundaries, elevational boundaries, or watershed boundaries (in this example, watershed boundaries were used). The particular geographic object that we used varied according to the biology of the taxon (e.g., watershed boundaries for stream-dwelling amphibians, elevation for high-elevation taxa) (B). We then interpolated between the geographic objects that had known localities using expert opinion to develop an approximate range boundary (C). The approximate range boundary and known localities were then drawn together to produce a map for this document (D).
To develop species range estimates, we selected the full set of US Department of Agriculture ecoregion subsections that contained at least one locality and used these as a starting point for range maps (figure 2). We then overlaid existing range maps from California Wildlife Habitat Relationships, as well as data layers for habitat types, watersheds, elevation, land use, and urbanization. Using these draft maps, we restricted range boundaries based on ecoregion subsection, watersheds, and other data layers to a more biologically realistic species range. In accordance with the California Wildlife Habitat Relationships guidelines, our goal was to define the current maximum geographic extent of the species within the state, where maximum geographic extent is defined as the area within the range boundary where the species can potentially be expected to occur given suitable habitat conditions. We delineated the range boundaries to minimize errors of omission, even to the extent of allowing some commission error. For certain species, significant fractions of the range are potentially extirpated (see the species accounts for additional detail). No range shading is included for the species that are presumed extirpated in California (see individual species accounts).

FIGURE 2United States Department of Agriculture (USDA) Ecoregion subsections which were used in developing range maps.
In most cases, we defined the edges of species ranges by selecting meaningful landscape characteristics to set a boundary, such as elevation, rivers, or watershed boundaries. Our goal was to identify specific places on the landscape where future surveys could be conducted to further characterize the species’ range. Range maps that lack specific and objective boundaries provide only generalized starting points for such surveys. In total, our range maps present comprehensive estimates based on currently available species locality data and represent our best effort to use these data to approximate a species range, fully recognizing that such ranges are hypotheses to be tested rather than fixed entities.
Review Process
All phases of this project were reviewed by the three authors, the Technical Advisory Committee, and the CDFW. Most parts of the project were also subject to a wider review from members of the herpetological conservation community. For each taxon, we asked at least two experts to review the species account, including the maps and any appendix information. Finally, the Technical Advisory Committee, the CDFW, biologists from state and federal land management agencies, and other interested parties reviewed the finished manuscript as a whole.
RESULTS
Status Lists
We identified 217 native species, subspecies, and distinct population segments that are, or are suspected to be, present in California (Appendix 1). Seventy-three of these taxa were considered nominee Species of Special Concern and underwent evaluations using the risk metrics. Four additional taxa were initially considered for evaluation but were subsequently state listed and removed from further consideration (see Watch List). Of the 73 candidates, we determined that 28 did not merit special status at this time and 45 met our criteria for Species of Special Concern status (figures 3 and 4 and Table 2). Three of these species qualified for Species of Special Concern status by definition because they were listed under the Federal, but not the California, Endangered Species Act (the arroyo toad, Bufo californicus; the California red-legged frog, Rana draytonii; and the Yosemite toad, B. canorus). We conducted the scoring separately for the two subspecies of the western pond turtle (Emys marmorata marmorata and E. m. pallida) because the severity of threats facing one population appeared to be larger than those facing the other. However, both populations merited inclusion as Species of Special Concern, resulting in a single species account where threats to each population are discussed separately.

FIGURE 3Total Score/Total Possible for 73 taxa evaluated for Species of Special Concern status.
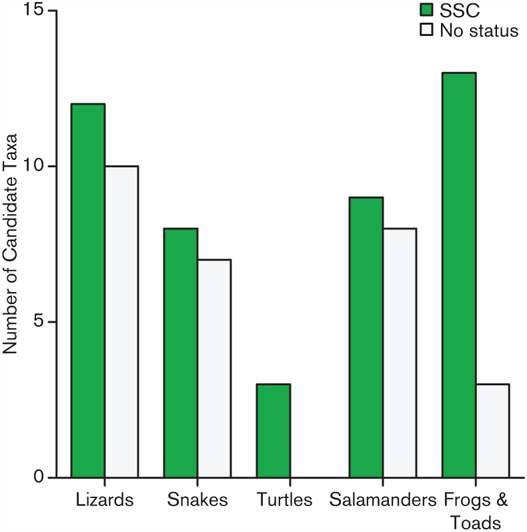
FIGURE 4Number of taxa in each status category among the 73 nominee taxa by taxonomic group. Species of Special Concern (SSC) are represented by filled bars. Open bars are nominee taxa that did not receive SSC status.
TABLE 2a
List of California amphibian and reptile Species of Special Concern and priority designations
Three species qualify as Species of Special Concern, although the scarcity of data precludes their accurate prioritization at this time (see text for further discussion)

TABLE 2b
List of California amphibian and reptile Species of Special Concern and priority designations
Three species qualify as Species of Special Concern, although the scarcity of data precludes their accurate prioritization at this time (see text for further discussion)

We ranked the Species of Special Concern taxa according to the magnitude of risks that they face, with the two pond turtle populations receiving separate Priority scores. This resulted in 16 taxa categorized as Priority 1, 14 as Priority 2, and 12 as Priority 3. Three additional species clearly qualify as Species of Special Concern, although the scarcity of field records precludes their accurate prioritization at this time: the regal ring-necked snake (Diadophis punctatus regalis), Cope’s leopard lizard (Gambelia copeii), and the Gila monster (Heloderma suspectum). In these three cases, we have not assigned a priority score pending additional fieldwork.
Performance of Metrics
Spearman’s rank correlations among the eight risk metrics indicated that approximately two-thirds (18/28) of the possible pairwise correlations among metrics were significant (Table 3). Some metrics were not highly correlated with other metrics (e.g., endemism was not correlated with any other metrics), while other metrics were correlated with four or five other metrics (e.g., distribution trend, population concentration/migration, and population trend). Some pairs of correlations indicated that there was considerable overlap in the scores received across taxa. The strongest correlation among metric scores was between distribution trend and population trend (ρ = 0.66, p < 0.001), indicating that animals that have been extirpated from historic localities tended to also be undergoing declines in abundance in currently occupied sites. Taxa experiencing high levels of extirpation also tended to have vulnerable life stages (correlation between distribution trend and population concentration/migration) and be more at risk from future threats (correlation between distribution trend and projected impacts). Those with vulnerable life stages also tended to be declining in abundance (correlation between population concentration/migration and population trend) and were more vulnerable to climate change (correlation between population concentration/ migration and vulnerability to climate change).
TABLE 3
Spearman’s rank correlations (ρ) among the eight ranking criteria scores
Values below the diagonal are for the 73 candidate taxa. Values above the diagonal are for the 45 Species of Special Concern taxa
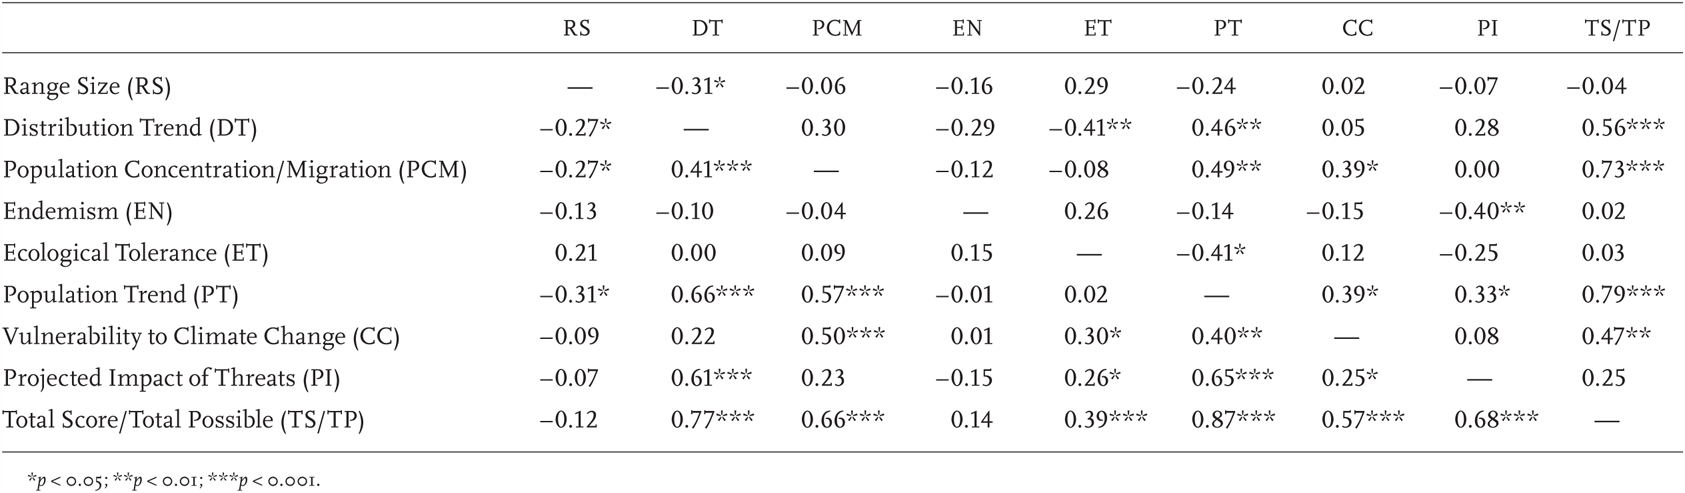
All but two metrics (range size and endemism) were significantly positively correlated with Total Score/Total Possible (Table 3). Distribution trend and population trend were a priori given the greatest weight (each had a maximum score of 25 vs. a maximum score of 10 for all other metrics), and they were also the most highly correlated with Total Score/Total Possible (ρ = 0.77 and 0.87, respectively). Projected impacts, population concentration/migration, and vulnerability to climate change also stood out as contributing to risk, although the relationships were not as strong (ρ = 0.57–0.68).
Principal components analysis of the metric scores for the 73 evaluated taxa showed that the first two principal component axes accounted for about half (54%) of the total variation. Distribution trend, population trend, and projected impact of threats loaded most strongly on the first principal component axis, and Species of Special Concern taxa tended to have positive values for this axis (80% of Species of Special Concern taxa positive; figures 5 and 6). Ecological tolerance and range size loaded most strongly on the second PC axis. However, there is little correlation with special concern status along this axis (figure 6).

FIGURE 5Vectors of PCA loading coefficients on first two PC axes. These two axes explain approximately half of the variation in metric score among the 73 nominee taxa. Distribution trend (DT), population trend (PT), population concentration/migration (PCM) loaded strongly onto PC1. Range size (RS) and ecological tolerance (ET) loaded strongly onto PC2. Climate change (CC) loaded equally and moderately on both axes, and endemism (EN) did not load strongly onto either axis.

FIGURE 6Distribution of all 73 taxa evaluated for Species of Special Concern (SSC) status along PCA axes 1 and 2. Most SSC taxa are positive for PC1 and most taxa with “No Status” are negative for PC1. There is little separation among taxa along PC2. SSC are represented by filled symbols. Open symbols are nominee taxa that did not receive SSC status.
Patterns in the Metric Scores
The Total Score/Total Possible ratios for the Species of Special Concern taxa were normally distributed with a mean of 63%, ranging from 38% to 93% (Shapiro–Wilk test for normality, W = 0.98, p = 0.58). Three of the Species of Special Concern taxa are also federally listed as endangered or threatened, and all of these taxa (California red-legged frog, Rana draytonii; arroyo toad, Bufo californicus; Yosemite toad, B. canorus) had a Total Score/Total Possible greater than 75%, occurring in roughly the top 20% of Species of Special Concern (figure 3). The top 20% of taxa were amphibians, with the exception of the western pond turtle (Emys marmorata pallida) (figure 3). In contrast, the lowest scoring 20% of Species of Special Concern taxa were all reptiles with the exception of the Santa Cruz black salamander (Aneides flavipunctatus niger) (figure 3). On average, turtles and frogs and toads had the highest scores among the five major taxonomic groups (frogs and toads, salamanders, lizards, snakes, and turtles; figure 7).
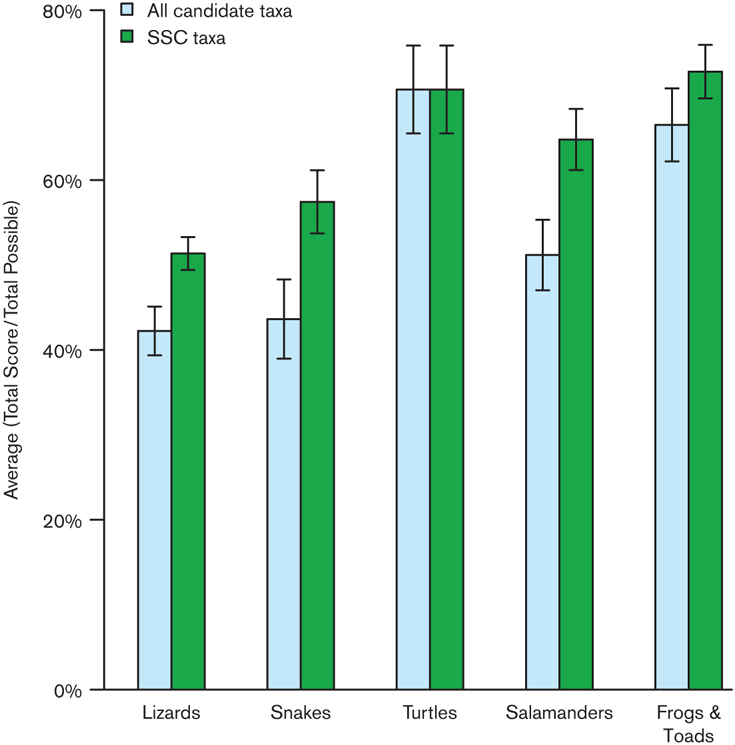
FIGURE 7Average Total Score/Total Possible by taxonomic group. Filled bars are averages across the Species of Special Concern (SSC) taxa. Open bars are averages across all 73 nominee taxa. Error bars are standard errors.
We were unable to score certain metrics due to a lack of data. Population trend had the largest number of deficiencies with 26% (19/73). Distribution trend was data deficient for 8% of taxa (6/73), and only a few taxa lacked data on vulnerability to climate change (2/73), projected impacts (3/73), and population concentration/migration (2/73). Among the Species of Special Concern, nine species were data deficient for the critically important population trend metric: Cope’s leopard lizard (Gambelia copeii), coast patch-nosed snake (Salvadora hexalepis virgultea), regal ring-necked snake (Diadophis punctatus regalis), California giant salamander (Dicamptodon ensatus), Gila monster (Heloderma suspectum), Sonora mud turtle (Kinosternon sonoriense), lowland leopard frog (R. yavapaiensis), Sonoran Desert toad (B. alvarius), and red-bellied newt (Taricha rivularis). Southern populations of the common garter snake (Thamnophis sirtalis) were data deficient for population concentration/migration, and the Oregon spotted frog (R. pretiosa) was data deficient for vulnerability to climate change. The Gila monster (H. suspectum) was data deficient for three metrics (distribution trend, population trend, and projected impacts), and the regal ring-necked snake was data deficient for the same three metrics plus population concentration/migration.
Certain geographic areas of the state emerged as experiencing a high degree of conservation risk, measured by the number of Species of Special Concern contained within them. At least two important geographic trends emerged from our analysis (figure 8). First, California ecoregions north of San Francisco Bay tended to have far fewer at-risk taxa than those from southern California (figure 8). In particular, the Southern California Coast, Southern California Mountains and Valleys, and the Mojave Desert ecoregions all contained a large number of Species of Special Concern (figures 2 and 8). Second, the geographic pattern of risk varied between amphibians and reptiles. Overall, reptiles experienced the highest risk in the three previously mentioned ecoregions as well as the Colorado Desert, while the northern ecoregions generally had only a single reptile Species of Special Concern (western pond turtle, E. m. marmorata). However, amphibian Species of Special Concern taxa were more evenly distributed among ecoregions across the state, with a slight peak in the mountains surrounding the Central Valley and in northern coastal California (generally 7–8 species) and a slight drop-off in the southern ecoregions (generally 5–6 species; figure 8).

FIGURE 8The number of Species of Special Concern that occurs within each US Department of Agriculture (USDA) Ecoregion section.
To assess possible correlations between habitat type and conservation risk, we scored all 73 nominee taxa as predominantly terrestrial or aquatic, based largely on where reproduction takes place. Our categorization of aquatic versus terrestrial was not identical to that used in Jennings and Hayes (1994a), although it is broadly similar. We categorized amphibians based on their breeding biology—those that lay aquatic eggs and have free-living aquatic larvae were considered aquatic, whereas those with terrestrial eggs and direct development were considered to be terrestrial. Under these criteria, all frogs and toads were scored as aquatic, as well as the salamander genera Ambystoma, Dicamptodon, Rhyacotriton, and Taricha. Terrestrial salamander genera were all from the family Plethodontidae, and included Aneides, Batrachoseps, Ensatina, Hydromantes, and Plethodon. All lizards and snakes, including the semiaquatic garter snakes (Thamnophis) were considered terrestrial, since all either lay terrestrial shelled eggs or are live-bearing, and all spend the majority of their time on land. All of the turtles were considered to be aquatic since they spend the vast proportion of their lives, including all feeding and mating activities, in freshwater aquatic habitats. Categorizing taxa in this manner shows that there is an overall effect of habitat on Total Score/Total Possible (One-way Anova, p < 0.0001; figure 9). The same pattern was true for aquatic versus terrestrial salamanders (figure 9).
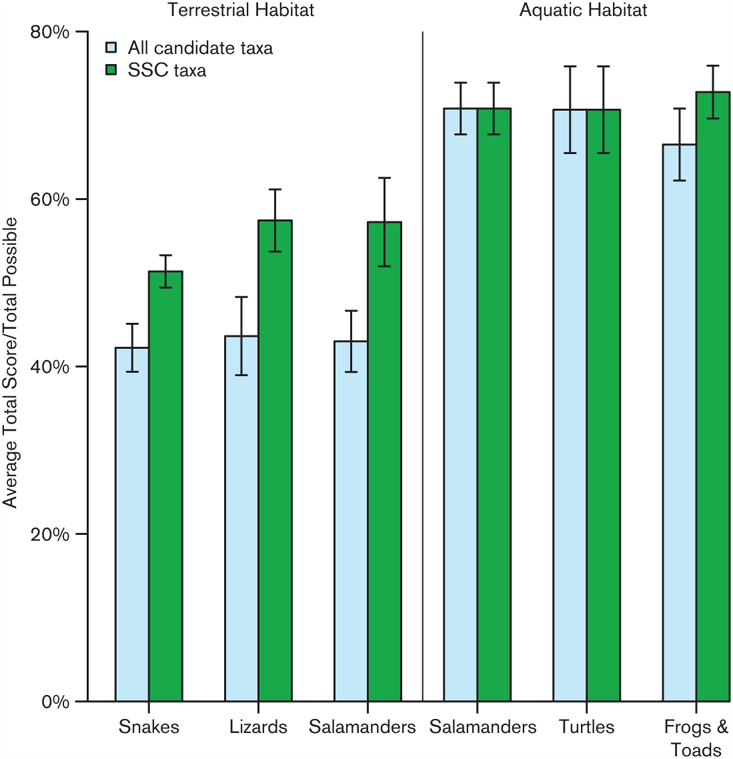
FIGURE 9Average Total Score/Total Possible by aquatic or terrestrial habitat type. Filled bars are averages across the Species of Special Concern (SSC) taxa. Open bars are averages across all 73 nominee taxa. Error bars are standard errors.
Public Comment
The formal public comment period lasted for 60 days over the summer of 2009, although we continued to solicit and incorporate feedback after this period closed. During the public comment phase of the project, the website was visited 886 times by visitors from 17 countries. The majority of visitors (575) were from California, followed by visitors from neighboring states (Washington: 32; Oregon: 28; Arizona: 26). We received feedback from a wide variety of conservation professionals, academics, and enthusiasts. Because much of this feedback came from informal conversations on the telephone or at workshops, meetings, and conferences, we cannot precisely quantify the number of data contributors to this project. However, we received substantial contributions in the form of unpublished data, reprints, field notes, and/or localities during the public comment period from approximately 45 individuals (see Acknowledgments).
DISCUSSION
Risk Metrics
Overall, the metrics performed well, successfully identifying taxa that herpetologists generally consider to be at risk across the state, such as ranid frogs. Similarly, scores for the Species of Special Concern that are federally listed suggested that the metrics were performing well. Evaluating all taxa within a metric framework also facilitated identification of patterns among the metric scores that revealed insights into the geographic and ecological factors associated with declines. As emphasized by Shuford and Gardali (2008) for birds, no single set of metrics can capture the intricacies of the natural world fully. The strengths of our approach were that the eight metrics covered a wide range of factors that indicate declines and established a repeatable and transparent baseline for the evaluation of Species of Special Concern. During the initial public input phase of the project, we observed firsthand how a metric-based framework facilitated incorporation of feedback into conservation decisions, regardless of disagreements over the particular metrics used. That is, when disagreements arose, the metrics allowed us to discuss conflicting scores for individual taxa, focusing discussions on specific issues and questions.
Our metrics covered four basic categories that spanned the diversity of conservation issues faced by any species: geography of declines, changes in population biology over time, key ecological attributes associated with risk, and estimates of future impacts. Metric scores within these categories were often correlated, capturing real patterns in how declines occur. For example, the high correlation between distribution trend and population trend reflects the fact that populations tend to become smaller and smaller as they become isolated and fragmented over time. This general shrinking of populations for many taxa with naturally extensive metapopulations will lead to a high score for population trend. However, as this trend continues over time, those isolated, declining populations experience much greater demographic stochasticity (Lande 1988), leading to more frequent extirpations of local populations and thus high scores for distribution trends. Thus, although these two metrics could be decoupled in principle, our assessments indicate that they tend to be associated in natural systems, and the metrics reflect this association rather than a redundancy in the approach. They also highlight the importance of measuring population connectivity as a research goal and of maintaining or reestablishing it as a management objective.
The correlation among metric scores may help explain why the rankings were robust to data deficiencies. This feature of the rankings is critical when evaluating reptile and amphibian taxa that can be cryptic, rare, and for which survey data are often lacking. We ranked taxa using the ratio of the total score to the total possible, rather than just the total score, to account for the different possible total scores for each species arising from data deficiencies. An implication of this approach is that each species’ score is based on the data available and that the metrics differentially influenced scores depending on data availability. For example, population size is difficult to estimate with precision and generally requires extensive multiyear field studies. As a result, we could not score population trend for eight Species of Special Concern. If such data deficiencies were biasing our results, then this would be reflected in a different distribution of Priority 1, 2, 3 and Undefined scores for data-deficient taxa compared to the overall set of Species of Special Concern, but this was not the case (χ2 = 5.4, df = 3, p = 0.14). We acknowledge that data deficiencies in key metrics, such as distribution and/or population trend, could allow for taxa to achieve high Total Score/Total Possible ratios based on having only moderate scores for the remaining metrics. Although this was rarely an issue in our analyses, we also believe that this captures a realistic axis of risk. Taxa that have life histories indicating some amount of risk, particularly small range size and high ecological specialization, but for which we have no data on trends in abundance or distribution, are prime candidates both for unnoticed declines and for further research or monitoring. By scoring them as data deficient and basing their overall score only on available data, we explicitly upweight the importance of those metrics for which we do have information, appropriately bringing them to the attention of biologists and resource managers.
The metric scores were informative for broadly categorizing risk, with generally accepted high-risk taxa receiving the highest scores (e.g., arroyo toad, Bufo californicus) and clearly low-risk taxa receiving the lowest scores (e.g., northwestern garter snake, Thamnophis ordinoides). If a few strongly correlated risk metrics were uniformly high for at-risk taxa, this could have produced a sharp break point in overall score for Special Concern taxa, but this was not the case. Instead, the risk metric scores formed a smooth continuum from very low to extremely high Total Score/Possible Score values, indicating that a wide variety of combinations of metric scores characterized different taxa (figure 3). This smooth continuum in scores made it difficult to use metric scores alone to decide on special concern status, particularly for the lower-ranking taxa. It also forced us to focus on the specific biology of taxa with lower metric scores in evaluating whether they should or should not be Species of Special Concern. For example, the yellow-blotched ensatina (Ensatina eschscholtzii croceater) has much of its small range on private land, and concerns regarding the management and development of that land was a primary motivation for its previous designation as a Species of Special Concern (Jennings and Hayes 1994a). However, more recent planning efforts have emphasized the importance of retaining much of the yellow-blotched ensatina’s habitat as unfragmented space (e.g., Tejon Ranch Conservancy 2008). This shift to regional conservation planning addressed the concerns about habitat loss for this species as described in the previous amphibian and reptile Species of Special Concern document (Jennings and Hayes 1994a), so we placed it on the Watch List. However, we identified the sandstone night lizard (Xantusia gracilis), which has a lower metric score, as a Species of Special Concern because of its tiny range size and associated potential for extinction.
The same was generally true for assigning priority rankings to individual taxa. Once again, there are no clear cut-offs in ranking scores among Species of Special Concern taxa in figure 3, making the identification of unambiguous criteria for priority score difficult. If the correlation between ranking and priority were perfect (or if we defined priority based solely on ranking), then all Priority 1 (green) taxa would be at the bottom of figure 3, Priority 2 (yellow) would be next, Priority 3 (peach) next, followed by taxa with No Status (white) at the top of the figure. This is close to, but not identical with, our priority ranking scheme.
We could have simply imposed priority-level cut-offs using the metric scores themselves rather than trying to add information that goes beyond a ranking based entirely on metrics. We did not do so because we felt that this would amount to a statement that all relevant biological information for each species was captured in the metric data. For example, the red-bellied newt (Taricha rivularis) ranked in the top 20% of taxa but is considered a Priority 2 Species of Special Concern. This decision was made because the ecological and population size data for this taxon are limited in scope, such that it was not possible to conclude that severe future declines and/or extirpation are likely without immediate conservation actions. Overall, we view the metrics as a useful but necessarily approximate guide for informing conservation decisions, not a complete replacement for careful consideration of the biology of each taxon on a case-by-case basis.
Taxonomic Patterns in Metric Scores
Taxonomic patterns among the Species of Special Concern can be measured as the total number of taxa, the fraction of the total number of species in the state that are Species of Special Concern, or as the average numerical metric score (Total Score/Total Possible) for different taxonomic groups. Each is informative, and together they provide a more complete overall picture of the status of the amphibian and reptile fauna of California than does any single measure.
When viewed in the context of all 217 taxa that are known to naturally occur in California (Appendix 1), turtles and amphibians are the most at-risk taxonomic groups. Among the candidate taxa, turtles and frogs had similar average metric scores (71% and 67%, respectively; figure 7), and many of these taxa are Species of Special Concern. All of California’s nonmarine turtles are at risk at the Species of Special Concern or State Threatened level (figure 10). This pattern mimics the situation for turtles and tortoises globally; according to the IUCN, turtles have the highest fraction of Red List taxa among any major group (39% of all species and 62% of the currently evaluated species; Rhodin et al. 2010). While very few turtle species occur in the state, half of California’s frogs and toads are included as Species of Special Concern. The state’s other amphibian group, salamanders, has the next highest fraction of included taxa, with squamates (lizards and snakes) being least at risk at the state level (figure 10). These patterns are consistent with global concerns about amphibian declines in recent decades (Lannoo 2005). No frogs or toads were included in the additional taxa in need of research and monitoring category (Appendix 4), which confirms that a disproportionately large research effort has focused on this globally imperiled group compared to other taxa (Stuart et al. 2004).

FIGURE 10Percent of California reptile and amphibian taxa (n = 217 by state protected status: Endangered, Threatened, Species of Special Concern [SSC], No Status).
Ecological Patterns in Metric Scores
Although taxa can be categorized along a variety of ecological axes, one clear distinction is between aquatic and terrestrial primary habitat requirements. The most striking overall pattern is the higher Total Score/Total Possible scores for aquatic (all frogs and toads, aquatic salamanders, turtles) compared to terrestrial (terrestrial salamanders, lizards and snakes) taxa. Jennings and Hayes (1994a) suggested that taxa having aquatic life stages were more extinction prone than terrestrial taxa, and our analysis supports this conclusion. However, phylogenetic and ecological patterns are confounded in this analysis because all frogs and turtles that we scored are also aquatic and all of the lizards and snakes were terrestrial. Thus, it is not clear whether frogs, toads, and turtles as taxonomic groups are at risk or whether obligatorily aquatic taxa are at risk. Salamanders provide some insight into this issue, as both aquatic and terrestrial taxa occur in California. The Total Score/Total Possible metric scores for Species of Special Concern in these two groups are strikingly different (terrestrial salamanders 57%, aquatic salamanders 71%) and consistent with the interpretation that aquatic taxa are, on average, at greater risk than terrestrial ones. Even within salamanders, however, phylogeny is still a confounding variable because all salamanders in the family Plethodontidae are terrestrial, whereas all of the other California salamanders are aquatic. While the overall pattern of higher scores for aquatic taxa is clear, it is not possible to infer causality from this analysis.
Concluding Thoughts on Metric Score Patterns
Two general conclusions emerge from our analyses of metric scores across taxa. First, regardless of whether the pattern is driven by evolutionary relatedness or some intrinsic feature of aquatic ecosystems, aquatic species are at greater risk than terrestrial ones. Second, amphibians overall are at greater risk than reptiles. Both of these conclusions may stem from the ecology of aquatic and terrestrial taxa, particularly in the relatively arid landscape that dominates much of California. Although amphibians have been characterized in the past as harbingers of habitat deterioration due to their permeable skin and sensitivity to environmental chemicals, recent work suggests that this may be less of a general conclusion than was previously thought (Kerby et al. 2010). However, what is clear is that water is a limiting resource over most of California, and climate change predictions for the next 50–100 years indicate that this limitation will only increase in the future. Aquatic habitats in California have also been particularly negatively impacted by nonnative fish, amphibian, and invertebrate introductions (see discussion below), and managing and preventing future introductions is a major challenge to conserving aquatic habitats. Aquatic invasive predators, combined with water modification and overutilization, have led taxa that rely on water, be it a mountain stream or vernal pool, to more precipitous declines than purely terrestrial taxa.
The fact that aquatic taxa are more at risk does not, however, indicate that terrestrial taxa are uniformly secure, now or in the future. The greatest biodiversity hot spot for terrestrial lizards and snakes in the state is in southern California (Parisi 2003; figure 8). Much of this region has experienced heavy development which has lead to major conservation concerns. Coastal taxa that are diurnally active and highly mobile (e.g., coast patch-nosed snake, Salvadora hexalepis virgultea; coastal whiptail, Aspidoscelis tigris stejnegeri) are particularly at risk, in part because habitat fragmentation and heavy road traffic, interactions with humans, their commensals (e.g., raccoons, skunks, rats, crows), and pets (dogs and cats), as well as general problems with fragmented habitat and a loss of metapopulation dynamics. In addition, some of the greatest areas of urban growth in California are in the relatively sparsely populated inland xeric regions, where remote conditions and lack of easily developed water and infrastructure have thus far protected many species. As these regions become more heavily populated and more fragmented by roads and urban centers, we predict a shift in endangerment patterns over the next several decades.
To help avoid future population declines, listings, and extinctions, amphibian and reptile Species of Special Concern are sometimes considered in both urban and large-scale planning efforts. Large-scale efforts originate at both the state (Natural Community Conservation Plan [NCCP]) and federal (Habitat Conservation Plan [HCP]) levels and involve cooperation between the two jurisdictions and other public and private partners. For example, five amphibian or reptile Species of Special Concern are included in the heavily populated planning area covered by the San Diego Multiple Species Habitat Conservation Plan (http://www.wildlife.ca.gov/Conservation/Planning/NCCP/Plans/San-Diego-MSCP). As of December 2013, nine approved NCCPs were being implemented, some of which include amphibian and reptile taxa, and 16 NCCPs were in the planning phase. Of the nine plans undergoing implementation, 1.5 million acres (0.6 million hectares) have been committed to reserve lands. The total planning area for the 25 NCCPs covers over 33 million acres (13.3 million hectares) (http://www.dfg.ca.gov/habcon/nccp/). As of 25 June 2014, there are 147 approved Federal HCPs in California (http://ecos.fws.gov/conserv_plans/). HCPs are primarily focused on federally listed species, so any benefit to ARSSC taxa is typically incidental to the plan.
Other large-scale wildlife planning efforts include a statewide assessment of essential habitat connectivity sponsored by the CDFW and the California Department of Transportation. The effort identified large remaining blocks of intact habitat or natural landscape and linkages between them that need to be maintained, particularly as corridors for wildlife (http://www.dfg.ca.gov/habcon/connectivity/).
Peripheral Populations and Endemic Taxa
At least 10 of the 45 Species of Special Concern are best considered peripheral in California. For these species, the bulk of their range occurs outside of the state, where they may be abundant and in little danger (e.g., Couch’s spadefoot, Scaphiopus couchii), of relatively uncertain status (e.g., regal ring-necked snake, Diadophis punctatus regalis), or declining and protected (e.g., Oregon spotted frog, Rana pretiosa). Particularly for those taxa that are common range-wide, a reasonable question to ask is whether they should be protected in California, where they may occur in marginal habitat at the edge of their ranges. From a biological perspective, conditions beyond the state’s borders are clearly relevant to range-wide conservation risk. However, from a political and jurisdictional perspective, managing populations outside of California is not the state’s responsibility. We consider peripheral taxa as valid Species of Special Concern because the CDFW’s mission is to “maintain native fish, wildlife, plant species and natural communities for their intrinsic and ecological value and their benefits to people […] include[ing] habitat protection and maintenance in a sufficient amount and quality to ensure the survival of all species and natural communities” that naturally occur in California (http://www.dfg.ca.gov/about). Therefore, peripheral populations are similar to taxa whose entire range occurs within the state in that they are established, natural components of the biodiversity of California; whether they require special conservation measures should be based on their current status in the state. Two of our metrics, range size and endemism, take the peripheral nature of populations into account, at least indirectly. Range size generally upweights these populations, since they have small ranges within the state. Countering this, endemism measures the fraction of the species’ overall range that occurs in California, which tends to downweight such taxa. Each had a maximum score of 10, so they had equal impacts in the total score for each taxon.
Endemic taxa, by contrast, are clearly one of the state’s most important conservation responsibilities (Table 4). Because they occur nowhere else, these taxa make up a critical component of California’s unique amphibian and reptile fauna, so conservation successes or failures within the state are likely to have much larger impacts on these species than taxa that range more widely.
TABLE 4
Endemic and Near Endemic Species of Special Concern

Geographic Patterns in Species of Special Concern
Range maps are an important resource in delimiting changes in the distribution of taxa. However, range is also difficult to determine precisely for many reptiles and amphibians due to their naturally low population densities, cryptic natural history, and the paucity of survey data. In constructing these range maps, we included, rather than excluded, regions where the likelihood of occurrence was high but no specimens have been documented to date. Our reasons for doing so were twofold. First, by setting boundaries that may be too large, we hope to encourage field researchers to expand their geographical horizons when searching for new localities. Second, since the taxa are at-risk, we want to err on the side of potential habitat inclusion for conservation purposes. We used previously established units (watershed boundaries, ecoregions, etc.) rather than arbitrary polygons around localities to provide objective boundaries from which future surveys can work. For instance, where we drew a species as being present in one watershed but absent in the next, this provides a very straightforward way to focus additional surveys. Surveyors can ask the question, “Is the taxon present in the adjacent watershed?,” and focused efforts can answer that question, refining range boundaries in an organized, efficient manner.
These maps also highlight an important, frequently overlooked point: we need a mechanism, including a curated database, that tracks documented absence as well as documented presence data. Documenting, and even defining, absence is often a very difficult problem, but these efforts can be helped by collating survey results (including both positive and negative occurrence data) into a publically available and easily accessible format. Locality data from the past couple of decades tend to come from sight records, survey data, and other field research that does not result in the collection of museum specimens (figure 11). While museums are increasingly making their data accessible through online databases, there is currently no centralized way to collate locality data from other sources across all California reptiles and amphibians. The California Natural Diversity Database is an important means by which the state collates status and location information for Species of Special Concern and those listed under the federal and California Endangered Species Acts. Currently, this resource does not document absence data for sites where only negative surveys have occurred and focuses solely on those taxa on California’s Special Animals list. Expanding the scope of this database or adding an additional database to capture negative occurrence data, as well as survey data from other taxa, would help the state’s efforts to improve estimates of species ranges.
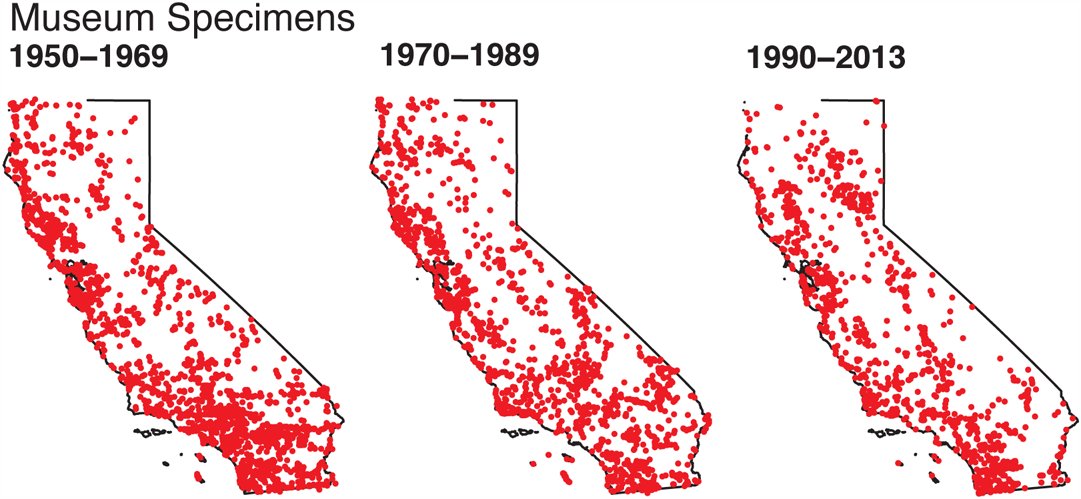
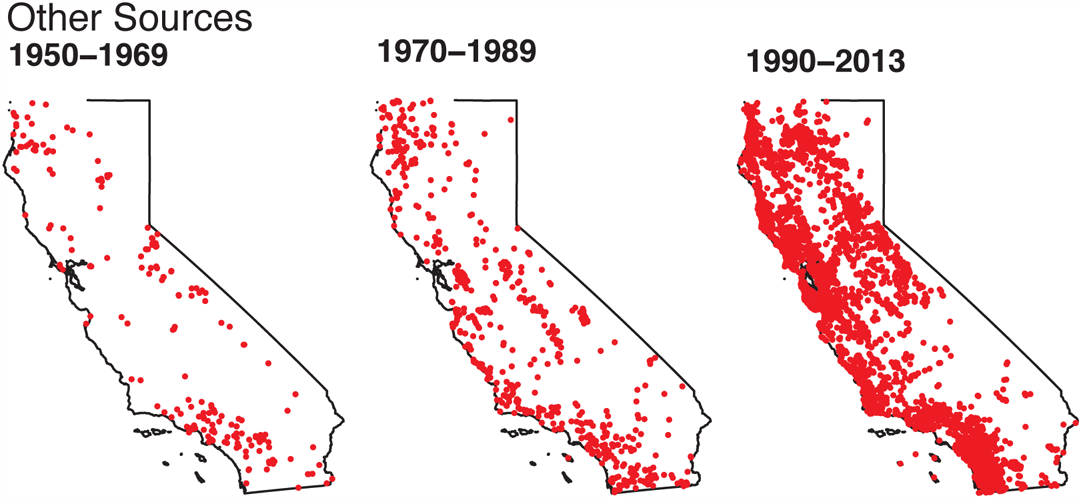
FIGURE 11Distribution of Species of Special Concern locality records over time. Data from other sources include records from the California Natural Diversity Database and the Biogeographic Information and Observation System, both of which contain some museum records, though the majority of records plotted are from survey data.
When we plot the number of at-risk species contained within each ecoregion, geographic patterns in conservation risk emerge (figure 8). The southern California coast and mountains and the Mojave Desert have the largest number of at-risk species overall, although this pattern is due largely to trends among reptiles. This important area of conservation risk is driven along the south coast by habitat loss and degradation arising from the massive land use changes that this area has experienced over the last century. The Mojave Desert, conversely, is often viewed as being less disturbed and protected by reserves, parks, and military reservations. Our analysis highlights that this is not entirely true. The Mojave Desert has experienced some degree of habitat degradation and loss, although, to date, not as strongly as that which has occurred along the coast where extensive urbanization has effectively removed large areas of habitat. However, the Mojave Desert, as well as the Great Basin, Colorado, and Sonoran Deserts, and some of the southern Sierra Nevada and associated foothills constitute the 22.5 million acre planning area for future renewable energy development (wind, solar) in southern California. In addition, many of the at-risk species in the Mojave Desert use specialized and rare resources that have experienced a disproportionate amount of habitat degradation relative to other areas of the desert. For example, the fringe-toed lizards of the genus Uma exclusively use sand dune habitats, which also disproportionately attract off-highway vehicle use even in some protected areas (see species accounts for additional details). The Mojave Desert is also home to a large number of narrowly distributed or rare taxa that may exist at the edge of their physiological tolerance and persist in small, often isolated areas (e.g., Gila monster, Heloderma suspectum). These species may be at particular risk of further declines as climate change occurs. Importantly, it is not the case that all desert species are declining equally, since the Great Basin and Sonoran ecoregions have relatively few at-risk reptiles, while an intermediate number occur in the Colorado Desert.
For amphibians, the areas of largest conservation risk are the mountainous areas surrounding the Central Valley and the forested regions of central and northern California (figure 8). These areas have not experienced massive land use change per se, although they have experienced considerable habitat fragmentation and modification stemming from water diversions, timber harvest, and nonnative species (Bunn et al. 2007, http://www.wildlife.ca.gov/SWAP). Some studies indicate that agriculture in the Central Valley has had an impact on some species in the Sierra Nevada and Cascades Range via increased exposure to pesticide drift from the Central Valley (e.g., Davidson et al. 2002, Davidson 2004, Lind 2005). In addition, many of these regions are heavily exploited for timber harvest, and this has also had an impact on both stream-dwelling and terrestrial amphibians (e.g., Olson et al. 2007, Welsh and Hodgson 2008). An emerging threat in northern California is marijuana cultivation, which can degrade both terrestrial and aquatic amphibian habitat (CDFW 2013). Increased sedimentation, dewatering of headwater streams, and application of agricultural chemicals are all potential negative effects of marijuana growing, and these effects should be monitored and potentially regulated. High elevation mountainous areas are expected to experience large impacts from climate change through the altered timing and amount of snowmelt (Cayan et al. 2008b), and this future risk probably affects amphibians to a greater extent than co-occurring reptiles (figure 8). Increasing temperatures associated with climate change may also lead to phenological shifts in several species, which could interact with several of the existing threats (Todd et al. 2011). This pattern in both amphibians and reptiles is driven to some extent by species richness of the respective groups. Southern California and the deserts have the highest richness of reptile diversity, whereas the Sierra Nevada and northern Coast Ranges are home to greater amphibian species richness (Parisi 2003, Stebbins 2003).
Finally, for all taxa we note that the distribution of locality data is uneven and patchy across the state (figure 12). At first glance, it appears that the areas with the greatest human impacts and populations (southern coastal California, the Bay Area) are also the areas with the greatest number of locality records, and it may be that these are simply the areas that have received the greatest efforts from field biologists. Unfortunately, we cannot unambiguously say whether the sparse locality records, for example, from the Mojave Desert reflect sparse fieldwork, underreporting of data, or a genuine low density of animals in the region. Our sense is that all of these factors are contributing to the distribution of locality records. That is, it is almost certainly the case that there has been much more intensive sampling effort, and consequently a larger number of records, in San Diego County than in the eastern Mojave (figure 11). However, it is also true that both reptiles and amphibians are sparsely represented in the eastern Mojave (compare reptile and amphibian maps in figure 12), even though this is a region of high abundance and species richness for reptiles. However, the large number of sensitive species (figure 8) and the recent, intensive development in San Diego County cause many environmental impact assessments to be undertaken under the California Environmental Quality Act, and this has likely contributed to the larger number of records compared to the deserts of southern California.
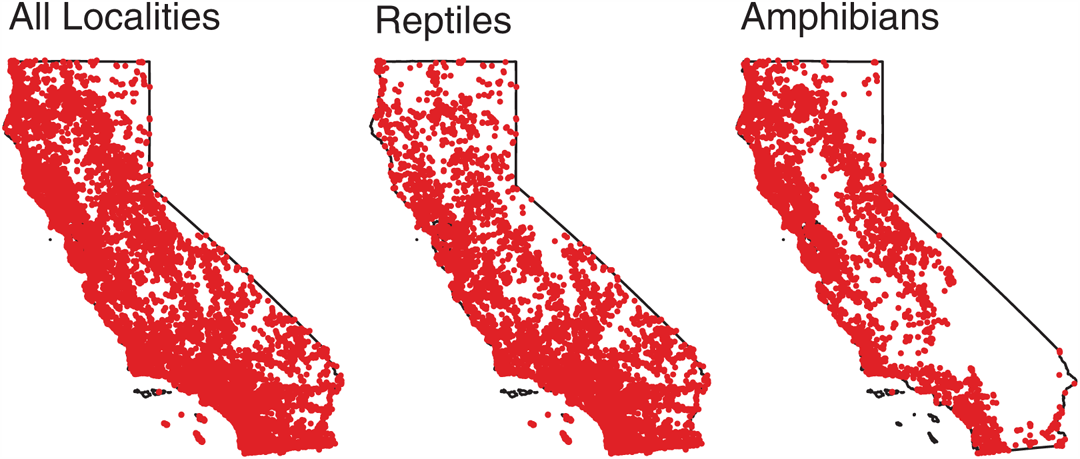
FIGURE 12Occurrence of Species of Special Concern taxa locality records throughout the state. Regions with few occurrence records may represent areas with few SSC taxa, low sampling effort, or both.
Differences between This Document and Jennings and Hayes (1994a)
Species priority assessments for conservation purposes are subject to revision over time as factors that affect risk, including habitat protection, invasive species, and scientific knowledge change. Although the number of species identified as being of concern was similar (49 vs. 45), a number of differences exist between the current and previous assessments. Jennings and Hayes (1994a) based their assessment on a combination of their own knowledge and that of a large group of leading experts on individual species; we follow a similar procedure here but summarize the available data using a metric-based approach. Jennings and Hayes (1994a, p.183) felt that for no species of amphibian or reptile was there compelling evidence to “downgrade” status from more threatened to less threatened, whereas we removed several taxa from the Species of Special Concern designation. In total, 34 taxa occur on both lists; we added 11 taxa that were not included by Jennings and Hayes (1994a) and excluded 15 taxa that were previously included (Table 5, Appendix 3).
TABLE 5
Comparison of Species of Special Concern between this publication and Jennings and Hayes (1994a)
Gray cells denote species designated by both publications (see text for additional details)
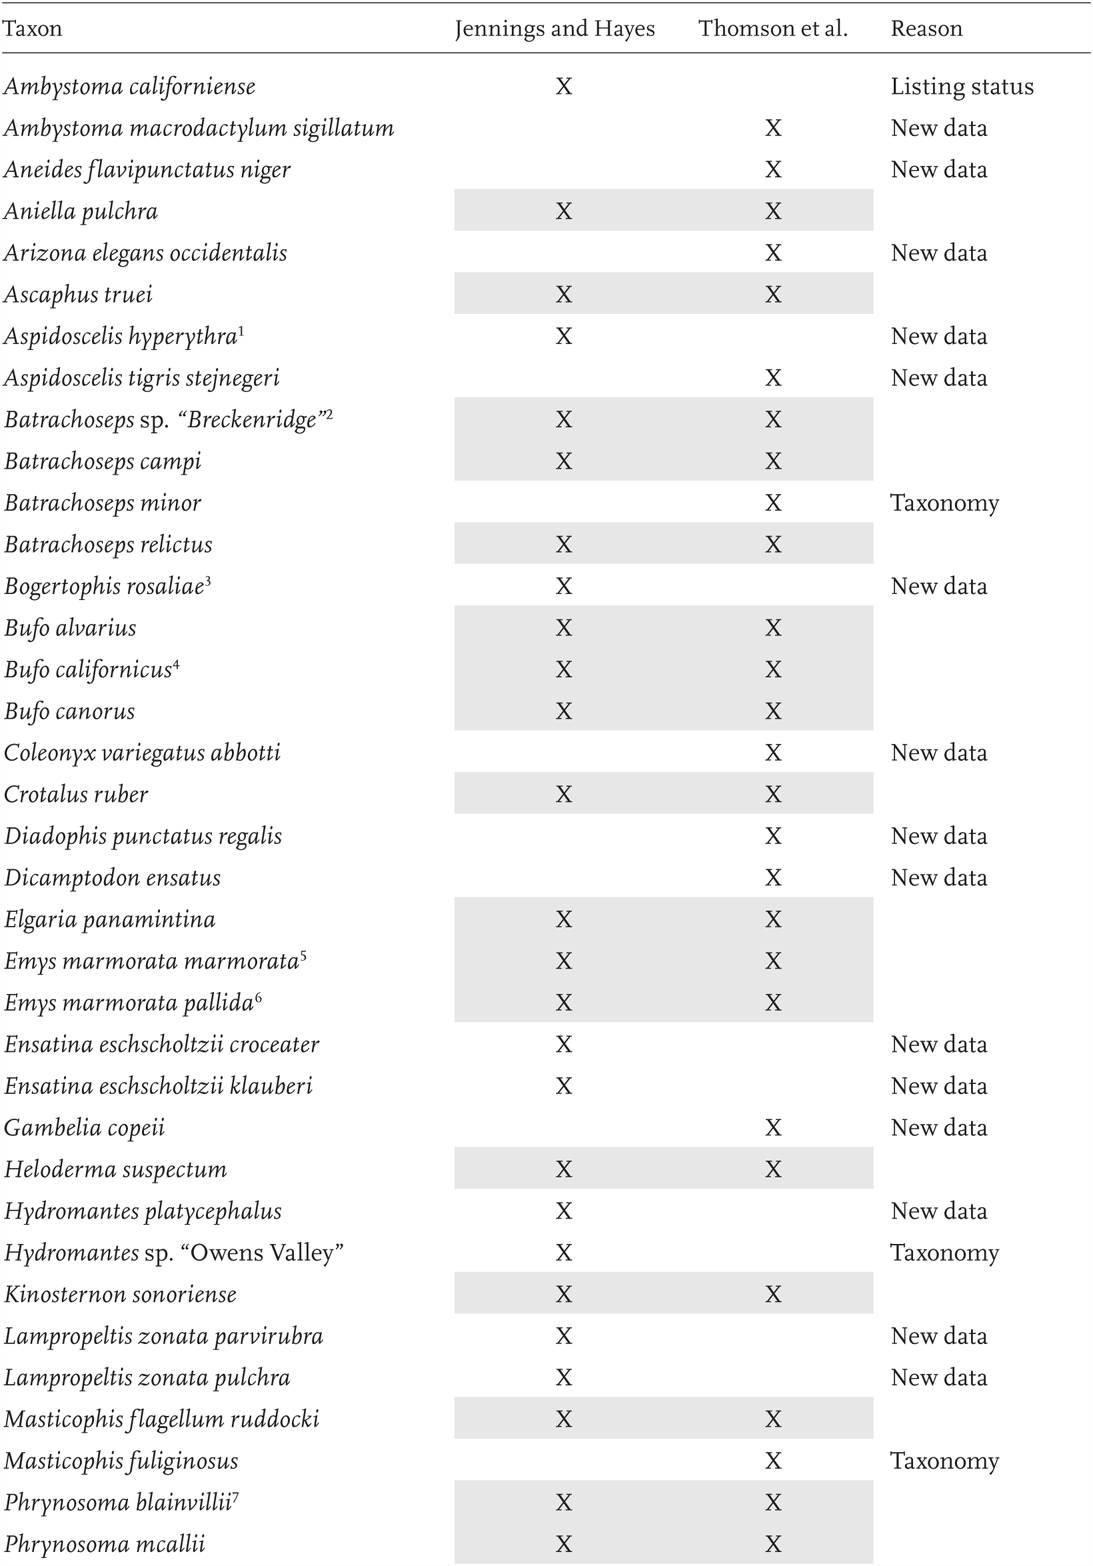
TABLE 5 (continued)
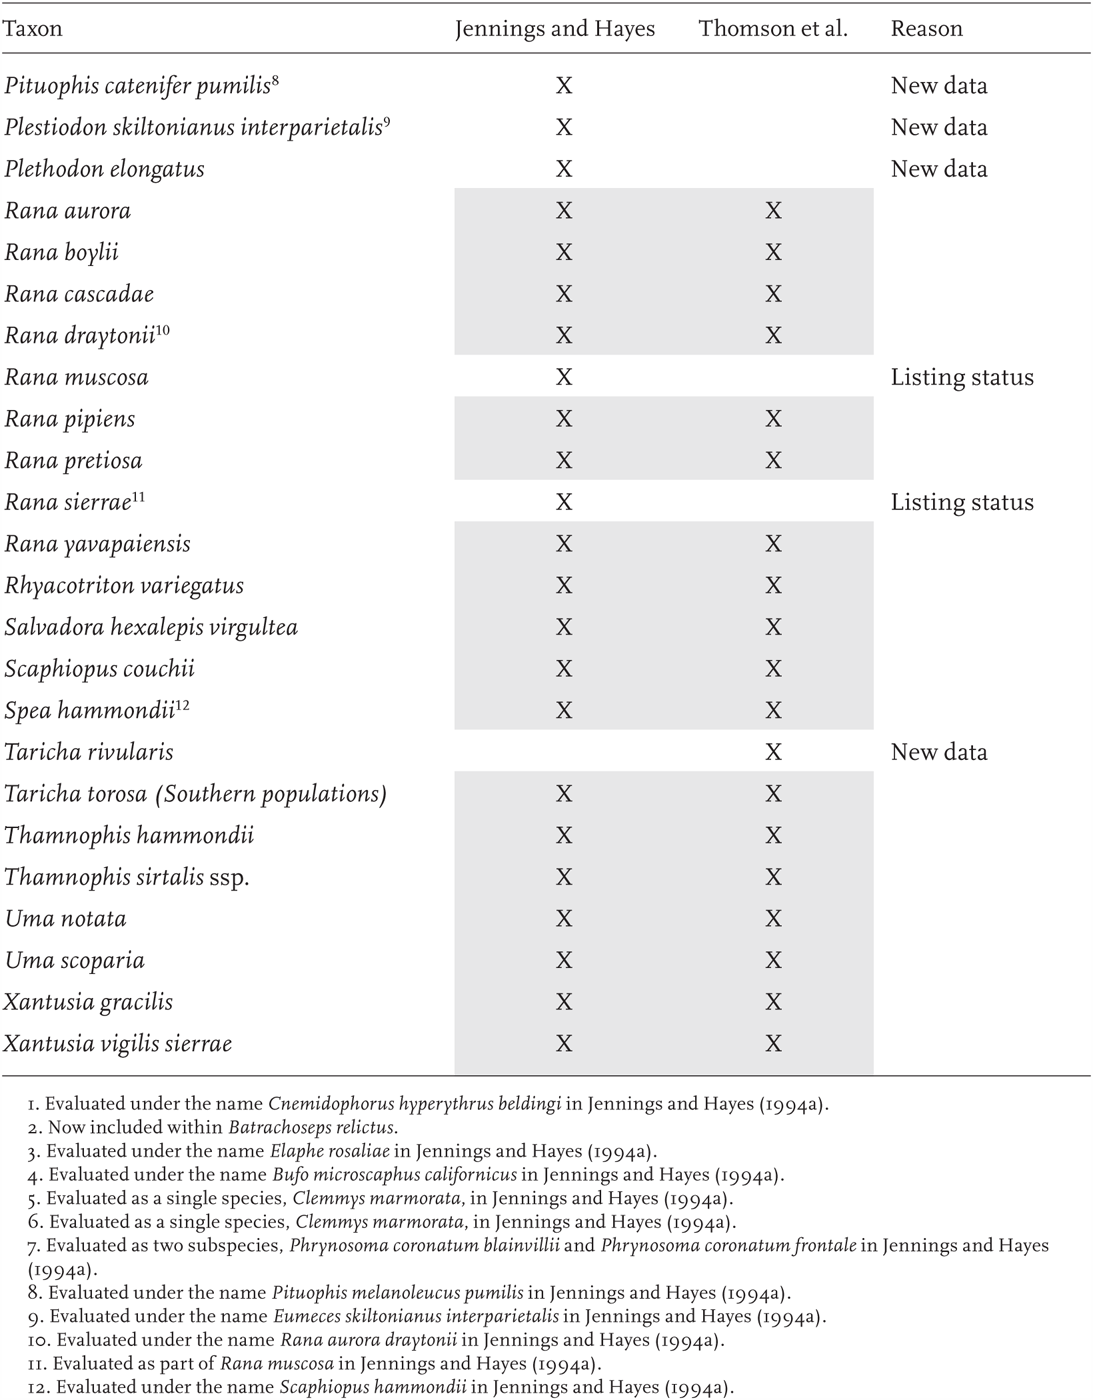
The status of 43% (26/60) of Species of Special Concern taxa has changed between 1994 and the present. Of the 26 species that changed status, approximately half were upgraded and half were downgraded: 58% (15/26) of the taxa were on the previous list but not the current one, and 42% (11/26) were upgraded from having no formal status to Species of Special Concern (Table 5). These changes reflect differences in approach between these two compilations, insights gained from an additional 20 years of field and systematic research, and real changes that have occurred in the abundance of species. However, on face value, it appears that the past two decades have not been a completely negative period for amphibian and reptile biodiversity in California.
Several factors contribute to these changes. In Table 5, we broadly categorized reasons for changes into three categories. “Listing status” applies to a few taxa, like the California tiger salamander (Ambystoma californiense), that are no longer considered Species of Special Concern because they were listed under the California Endangered Species Act between 1994 and 2014. These taxa are still considered to be at risk, but their state listing precludes inclusion as a Species of Special Concern. “Taxonomy” is more difficult to categorize because many taxa have had name changes between the two lists. However, in Table 5 we highlight taxonomic changes that led to either the recognition of a new at-risk taxon or the elimination of a previously recognized taxon that is no longer considered valid. An example of the former is the Baja California coachwhip (Masticophis fuliginosus), which was considered a part of the widespread and relatively common coachwhip (M. flagellum) in 1994, but has since become more widely recognized as a distinct species (Grismer 2002). We note taxonomic changes in Table 5 that did not impact special concern status, like the elevation of the arroyo southwestern toad (Bufo microscaphus californicus) (Jennings and Hayes 1994a) to the arroyo toad (B. californicus) (current document) as footnotes. The remaining taxa changed special concern status because of new data. This category covers a variety of factors, ranging from better and more extensive field survey data which has revised our understanding of the severity of threats (e.g., the Mount Lyell salamander, Hydromantes platycephalus) to new threats that have been identified since 1994 (e.g., predation by introduced fishes for the southern long-toed salamander, Ambystoma macrodactylum sigillatum). Some of the difference in threat evaluation stems from our choice of metrics. For example, climate change is currently a particularly important aspect of conservation risk that was not previously considered. In some cases, the availability of suitable habitat has changed, either positively or negatively. Habitat may be set aside for conservation (e.g., Tejon Ranch appears to be setting aside considerable land that will benefit the yellow-blotched ensatina, Ensatina eschscholtzii croceater) but is usually lost (e.g., coastal scrub habitat for the California glossy snake, Arizona elegans occidentalis). Finally, we note that the factors listed in Table 5 are an over-simplification of the reasons behind our decisions. An explanation for each of the 15 taxa that appeared on the previous list but not on the new list is also included in Appendix 3.
Ultimately, the comparison of the two Species of Special Concern documents emphasizes what can be learned by periodically updating and evaluating the conservation status of taxa on a regular basis. For the 34 taxa that have remained Species of Special Concern, we can and should ask what more can be done to improve their status. Some of the taxa that are no longer Species of Special Concern may inform the kinds of positive changes that can be brought about by management, research, or both. For example, additional surveys and taxonomic research on the Mount Lyell salamander (H. platycephalus) have shown that the species is more widespread than previously thought and clarified the taxonomic status of populations in Owens Valley, which were previously suspected of being distinct and of conservation concern. Finally, the challenges of incompletely known taxonomy that were emphasized by Jennings and Hayes (1994a) still pose a major challenge to effective management; if we do not have a complete catalogue of the taxa that occur in California, we cannot even enumerate what may need protection to maintain biodiversity.
Management Recommendations for California Amphibians and Reptiles
While effective management of the Species of Special Concern will generally require development of specific management strategies tailored to the biology of individual taxa, several general recommendations have emerged from this document.
1. Protect aquatic habitats. The metric scores indicate that aquatic species are at greater risk than terrestrial ones, suggesting that remaining aquatic habitats with native amphibian and turtle populations should be high conservation priorities. California’s aquatic habitats have been highly modified from a faunal perspective. As of 2002, there were 51 nonnative freshwater fishes in California, the majority of which were deliberately introduced to enhance recreational fisheries (Moyle 2002). Nonnative fishes now predominate in many California waterways, raising concerns about increased competition, predation, habitat interference, disease, and hybridization with native species (CDFG 2008). A large body of ecological research has demonstrated a negative effect of introduced fishes and bullfrogs (Rana catesbeiana) on California’s native anurans (e.g., Hayes and Jennings 1986, Tyler et al. 1998, Knapp and Matthews 2000, Vredenburg 2004, Knapp 2005, Leyse 2005, Welsh et al. 2006, Pope et al. 2008). As a result, predatory salmonids, centrarchids, catfishes, and other nonnative species should be eradicated wherever feasible and should not be introduced into remaining native amphibian or reptile habitat. Maintaining appropriate water flow regimes for stream-dwelling taxa is also critical, as are broad riparian buffers to maintain lotic habitats and reduce siltation (e.g., Lind et al. 1996, Yarnell 2005, Hancock 2009).
Specific management recommendations include the following:
• Control, or eliminate where possible, invasive aquatic species, particularly predatory fishes, crayfish, and bullfrogs. For widespread, established invasives, plans should be developed with actions that reflect those identified in the California Aquatic Invasive Species Management Plan (CDFG 2008). For bullfrogs in particular, plan Objectives 5 and 6 apply: Education and Outreach and Long-Term Control and Management. Invasive species in the early stages of colonization (e.g., Nerodia fasciata, N. sipedon and N. rhombifer) should be eradicated as soon as possible to prevent further spread. Known to be present in California since the 1990s, coordinated efforts have yet to effectively coalesce to make significant progress toward eradicating Nerodia, though educational (http://biology.unm.edu/mmfuller/WebDocs/HTMLfiles/nerodia.html) and occasional agency efforts occur.
• Eliminate, limit, or mitigate effects of dams, water diversions, and other hydrological disturbances to breeding streams whenever possible, and particularly during breeding seasons.
• When biologically appropriate, enhance connectivity and continuity of streams to allow free movement of aquatic species. Conversely, the potential for increasing connectivity to facilitate the spread of invasive species or disease should be considered on a species-by-species basis.
• Maintain riparian vegetation buffers and adjacent upland habitat.
• Eliminate roads within buffer zones and mitigate their effects in high-use amphibian migration areas whenever possible to avoid siltation and road mortality.
• Restrict use of heavy equipment on dirt roads and upland habitats, particularly during the breeding season when eggs and small larvae may be most affected by siltation.
• Maintain culverts under roads adjacent to breeding streams to reduce siltation.
2. Protect integrity and connectivity of large terrestrial habitat patches. The size of habitat patches necessary to support healthy populations of most species may be larger than previously recognized (Prugh et al. 2008). The amount and configuration of habitat clearly has a strong impact on the overall extirpation and recolonization dynamics of adjacent populations, and ultimately, of entire species. Besides the general conclusion that more intact habitat is always desirable, specific requirements will always need some level of study on a species-by-species basis. For example, ongoing work on the state and federally endangered California tiger salamander (Ambystoma californiense) suggests that this species routinely moves long distances (up to 2 km) away from breeding ponds, suggesting that the extent and quality of upland habitat is likely to have a strong impact on the species’ long-term persistence (Trenham and Shaffer 2005, Searcy and Shaffer 2008, Searcy and Shaffer 2011). Several diurnally active and wide-ranging reptile species in southern California appear to be sensitive to habitat fragmentation and disappear from patches of small suitable habitat (e.g., coastal whiptail, Aspidoscelis tigris stejnegeri; coast patch-nosed snake, Salvadora hexalepis virgultea). Habitat fragmentation is a strong driver of declines for many species, and we recommend that land managers pay particular attention to preserving extensive habitat blocks where possible (see Mitrovich et al. 2009, for a well-worked example).
Although the individual conservation needs of species vary, formal conservation planning occurs on a broader scale that considers large areas of habitat for many species simultaneously. Because of many aspects of their shared biology, amphibians and reptiles are often considered as a group, and some excellent, general guidelines for their management have been developed (see, e.g., the Partners in Amphibian and Reptile Conservation habitat management guidelines http://www.parcplace.org/parcplace/publications/habitat-management-guidelines.html). In addition, the biology of amphibian and reptile species needs to be jointly considered within the framework of larger conservation initiatives. The California Natural Community Conservation Planning program is one such initiative that takes an area-wide approach to conservation planning, simultaneously considering conservation of many plant and animal species as well as potential land use activities (see Fish and Game Code Section 2800–2840). These broadscale, integrative approaches to conservation planning promise to be among the more effective strategies for achieving habitat protection and should become an increasingly central mechanism for conservation planning in California. Preserving linkages between adjacent habitat patches is also a key priority in these landscape-level conservation initiatives. Biologically, these linkages maintain metapopulation connectivity and habitat corridors that are often essential for long-term conservation. The California Essential Habitat Connectivity Project seeks to identify corridors between large remaining blocks of intact habitat and is one step in this direction (Spencer et al. 2010). Projects such as these are critically important for maintaining gene flow and migration among localized populations and should continue to be considered as landscape-level conservation initiatives move forward in the state.
Specific management recommendations include the following:
• All Species of Special Concern and the taxa discussed in Appendices 3 and 4 should be considered in Habitat Conservation Plans, Natural Community Conservation Plans, and other local and regional habitat management planning efforts.
• Develop species-specific ecological and landscape genetic datasets to determine the most important habitat corridors for protection and management of amphibian and reptile Species of Special Concern on specific landscapes.
• Identify and either eliminate or mitigate land uses that interrupt connectivity across habitat blocks that have been set aside for conservation. These might include roads, grazing, mining, timber harvest, and many other land uses and activities.
3. Mitigate the effects of roads as a source of mortality and habitat fragmentation. Roads have two primary effects: mortality and fragmentation (Fahrig et al. 1995, Gibbs and Shriver 2002, Mazerolle 2004, Gibbs and Shriver 2005; see also review in Andrews et al. 2008). The overall impact of road mortality on amphibian and reptile populations varies across road types, from species to species, geographically, temporally, and seasonally, and road-associated mortality levels interact with the movement patterns and seasonal migrations of individual taxa. In other parts of the country, roads have been documented to significantly contribute to fragmentation and reduced gene flow, interrupting normal metapopulation dynamics (Fahrig et al. 1995, Hels and Buchwald 2001, Langen et al. 2009, Clark et al. 2010, Sutherland et al. 2010), and the same presumably occurs in California. For example, surveys of 21 roads for migrating, federally endangered California tiger salamander (A. californiense) in Sonoma County suggest widespread mortality that has increased over time as traffic volume has increased. For surveys of one 1200-ft section of Stony Point Road conducted from 2001 to 2010, 160 of 262 salamanders (61%) found were road mortalities, suggesting that vehicular traffic is a substantial form of death in this extremely endangered species (D. Cook, unpublished data). Langen et al. (2009) identified predictors of hot spots of amphibian and reptile road mortality for use when planning roads or when conducting surveys on existing roads to locate priority areas for mitigation.
Although they have been employed infrequently in California, tunnels that assist amphibian and reptile movements can be an effective management tool that should be more actively investigated (for a comprehensive summary of published and unpublished literature, see Caltrans 2012). Two important aspects of migration tunnels are that they must have some capacity to funnel individuals into the tunnels (drift fences, concrete walls, or other similar structures), and they must be actively maintained. Without regular, scheduled maintenance, tunnels fill with debris, drift fences become covered with leaves, runoff soil, trash, and woody debris, and the tunnel quickly ceases to function. Tunnels may also play a role in the deserts of southern and eastern California, particularly as vehicular traffic increases, and roads fragment previously contiguous habitat. For additional recommendations regarding herpetofauna and roads, see Schmidt and Zumbach (2008).
Specific management recommendations include the following:
• Limit traffic, and consider road closures, during amphibian breeding migrations on sensitive public lands.
• Use signage (e.g., “Newt Crossing” warning signs) to warn vehicular traffic that they are in key migration areas.
• Develop standards for and install, maintain, and monitor usage of tunnels, underpasses or other passage mechanisms to reduce road-related mortality.
• Use various media resources for public education campaigns.
4. Translocate animals only when biologically appropriate. A general management strategy, variously referred to as relocation, repatriation, or translocation (Germano and Bishop 2009), is the practice of moving animals across landscapes, often from a site destined for development to a protected site. These efforts have become increasingly common as partial or complete mitigation for development projects that affect amphibians and reptiles. Several key biological issues need to be considered before animals are translocated. Disease transmission is an important problem that has had devastating consequences for several species (Jacobson 1993). The well-known upper respiratory tract infection that has decimated desert tortoise (Gopherus agassizii) populations is thought to be derived from released captive animals (Jacobson 1993). Genetic consequences of relocation programs should also be considered. Increasingly, genetic data are allowing researchers to elucidate fine-scaled genetic structure among populations, and the insights gained from nonlethal genetic sampling allow insight into biological parameters that are relevant for conservation including population subdivision, gene flow, migration corridors, and population sizes. However, the overall extent and functional consequence of this variation is still poorly understood for most organisms.
Moving individuals around the landscape has the potential for deleterious effects, either by diluting or eliminating unique historical lineages or by disrupting genetic variation that may be an important component of local adaptation. As emphasized in a recent review (Germano and Bishop 2009), homing and poor habitat quality are two of the primary reasons why translocation efforts may fail, and they should be carefully studied on a case-by-case basis. A recent document providing guidelines for translocations for the California tiger salamander (Shaffer et al. 2009) may serve as a model for some other taxa as well. It emphasizes that translocations should only be attempted into unoccupied habitat, and only after the threats that caused the initial declines have been effectively removed. It also emphasizes that sufficient research must have been conducted to provide compelling evidence that the potential damages that can be done to existing conspecific and heterospecific taxa do not outweigh the potential gains to the animals and populations being relocated.
In some cases, headstarting programs may represent a suitable alternative to repatriation or translocation, particularly if the headstarting is done under seminatural conditions. Many species experience the most severe mortality during early life stages. Raising individuals in captivity from a given site to the size or age where they are past this initial peak of mortality and then releasing them at the site where they were initially collected may avoid many of the potential issues associated with translocations while also providing a temporary boost to populations that are in decline. Headstarting is only appropriate, however, where suitable unoccupied habitat exists, or where introduction of individuals will not create problems for existing species at the introduction site.
Specific management recommendations include the following:
• Only translocate animals when other alternatives do not exist.
• Only translocate animals into situations where other animals at the translocation site will not be adversely affected by the introduced animals.
• Only translocate animals when the ecological requirements of the species exist in the new habitat.
• Utilize methods to increase the likelihood that translocations will be successful. These potentially include “soft” translocations (i.e., moving young animals rather than adults with established home ranges) and moving a sufficiently large number of individuals to ensure that a successful breeding population can establish (Germano and Bishop 2009).
Research, Survey, and Monitoring Needs
Both new research and continuing, long-term monitoring are integral parts of the science-driven protection and recovery of sensitive species. For California amphibians and reptiles, our level of basic knowledge on natural history is frequently so fragmentary that even rudimentary information is lacking, and increasing our understanding of these animals is critical for effective management. Many of the particular research needs are discussed in individual species accounts under the “Monitoring, research, and survey needs” section; here, we highlight several basic research and monitoring needs that are common to virtually all taxa.
Distribution
A statewide survey for all amphibians and reptiles is essential to establish baseline data for ongoing status determination and monitoring. Survey efforts are particularly needed for those Special Concern taxa whose population status or range size are a high priority for clarification. These surveys should employ standardized and repeatable methods, with the data emerging from these efforts made widely and easily accessible (Heyer et al. 1994). The Partners in Amphibian and Reptile Conservation Inventory and Monitoring guide (Graeter et al. 2013) serves as an important resource in the detailed design of these distributional surveys. Greatest need taxa include (1) those that may be recently extirpated, but for which comprehensive surveys have yet to be conducted (e.g., the Sonora mud turtle, Kinosternon sonoriense); (2) recently discovered taxa that are currently known from relatively small ranges, which may also be tied to specific narrow habitat types, that have yet to be thoroughly surveyed (e.g., the regal ring-necked snake, Diadophis punctatus regalis); (3) at-risk taxa that are difficult to detect or that have ranges that are poorly understood because they occur in remote, difficult-to-survey areas (e.g., the Gila monster, Heloderma suspectum); and (4) taxa that may occur only on private land where gaining access can be challenging (e.g., the Oregon spotted frog, Rana pretiosa or the western spadefoot, Spea hammondii). In addition, surveys of virtually all Species of Special Concern, particularly at their hypothesized range edges, would greatly enhance our knowledge of range boundaries for most taxa.
Natural History
Basic natural history and ecology information is the foundation for effective management, and for most amphibian and reptile Species of Special Concern, it is either fragmentary or completely lacking. Home range sizes, habitat suitability analyses, food habits, the effects of invasive plants and animals, compatibility with grazing and agriculture, the effects of human activities including forestry, recreation, and water diversions are unknown for many of the taxa considered here. For some questions and species, this probably is not a pressing problem—calling the southern long-toed salamander (Ambystoma macrodactylum sigillatum) a “generalist predator” is, to the best of our knowledge, correct, and filling in the precise details of which invertebrates are the most important prey in specific situations may not be an urgent management issue. However, in other cases, filling in at least some of this basic ecology is absolutely critical. For example, of the 19 species of pond/stream breeding Species of Special Concern amphibians, we do not have a well-tested, clearly understood model of terrestrial habitat use for a single taxon. For example, we have little idea of whether the southern long-toed salamander (A. m. sigillatum) requires 10, 1000, or 10,000 m radius habitat patches around breeding ponds. Filling in these fundamental information gaps, hopefully across a range of habitat types, constitutes the highest priority conservation-related research need for Species of Special Concern.
Climate Change
Climate change is likely to have a number of effects on the California landscape that are relevant to amphibian and reptile conservation. While the impact that climate change has on California’s landscape is undergoing extensive study (reviewed by Cayan et al. 2008a) and is a CDFW focus (http://www.wildlife.ca.gov/Conservation/Climate-Science), the impact that these effects will have on amphibian and reptile species requires additional study. The Association of Fish and Wildlife Agencies has initiated work on this problem in the southeastern United States, and the CDFW, in collaboration with the Southwest Climate Science Center, initiated a detailed investigation of future climate impacts on amphibians and reptiles across California (Wright et al. 2013). A major focus of these projects, and one that requires additional research effort, is to model a full range of future climate change predictions and their impacts on both common and rare amphibian and reptile taxa.
Importantly, the interplay between conservation risks that climate change presents and competing factors that will arise needs careful examination. For example, many climate projections forecast a decrease in the snowpack in the Sierra Nevada, as well as a shift in the speed and timing of snowmelt to be both more rapid and earlier in the year (Maurer and Duffy 2005, California Climate Action Team 2006, Maurer 2007). Even for the lowest carbon emissions scenarios and relatively conservative estimates of increasing temperatures, current models predict a 30–60% decrease in Sierra Nevada snowpack (Cayan et al. 2006). This is likely to have important, direct impacts on amphibians that rely on snowmelt-fed streams and lakes for their breeding habitat. In addition, it is likely to further stress California’s already overburdened water resources, setting the stage for further conflicts between the ecological needs of at-risk species and municipal and agricultural demands for increasingly limited water.
The combined impacts of changes in climate on biological diversity are likely to be strong. Several studies have documented ongoing (Walther et al. 2002, Parmesan and Yohe 2003, Root et al. 2003, Root et al. 2005, Parmesan 2006, Pounds et al. 2006) and expected (Hughes 2000) implications of climate change, with some estimates predicting 35% or more (Harte et al. 2004, Thomas et al. 2004) of species being “committed to extinction” under mid-range warming scenarios. These effects will likely be especially pronounced for amphibians, which generally exhibit limited dispersal and are already experiencing severe declines (Stuart et al. 2004, Lawler et al. 2010). The uncertainties involved with estimating specific effects that will occur on landscapes, species’ responses to these changes, and the interplay of factors that will result from climate change (e.g., agricultural and municipal water needs vs. amphibian breeding habitat needs, alternative energy development in the desert vs. reptile habitat needs) clearly indicate that this topic requires further study. An important step in this direction is a recent initiative by the US Fish and Wildlife Service (USFWS) to fund the California Landscape Conservation Cooperative, an interdisciplinary program to facilitate research and planning across scientific and management agencies in the state (http://californialcc.org/about-us). Results of the CDFW and Southwest Climate Science Center collaboration mentioned above should be integrated into the California Landscape Conservation Cooperative process.
Threats from Disease
Diseases in amphibian and reptile populations have become an issue of global significance. In particular, the pathogenic chytrid fungus, Batrachochytrium dendrobatidis (Bd), has been linked to precipitous declines in several amphibian species in the state (e.g., the Sierra Nevada yellow-legged frog, Rana sierrae) and globally (Stuart et al. 2004). At the present time, no broadly effective management strategies for controlling or mitigating the effects of this pathogen are known, and this is a critical, active research area. Proposed management strategies that would benefit from further study include altering population dynamics to minimize disease outbreaks, treating individual amphibians and habitats to control the prevalence or spread of disease, biological control of Bd using the zooplankter Daphnia magna, and in the most dire cases, maintenance of captive assurance colonies followed by repatriation with assisted selection (Buck et al. 2011, reviewed by Woodhams et al. 2011). Efforts to develop management strategies should not focus exclusively on strategies for the short term, such as direct control of Bd in the wild or captive breeding. Rather, management strategies that allow susceptible amphibians to persist in the wild in the presence of Bd are needed for long-term conservation of sensitive species (Woodhams et al. 2011).
The extent and type of interactions that Bd may have with other threats, such as climate change, pesticide exposure, or other pathogens, are also key research needs. A growing body of work on Bd indicates that it has negative consequences on at-risk species of amphibians in California (Davidson et al. 2007, Morgan et al. 2007, Andre et al. 2008, Lacan et al. 2008, Padgett-Flohr 2008, Briggs et al. 2010), that synergistic interactions with pesticides may have strong biological effects (Davidson et al. 2007), and that terrestrial amphibians may serve as vectors for the disease (Schloegel et al. 2009, Weinstein 2009). Other emerging diseases, particularly those that have their origins in human pets or are a result of human-mediated movements and relocations of animals are also high-priority research targets. Important examples include ranaviruses and iridoviruses, both of which have also been linked to amphibian declines (e.g., Picco et al. 2007, Schloegel et al. 2009).
Phylogeography and Landscape Genetics
Another important research need, and one that may be easier to fill than comprehensive ecological studies, is genetic analyses for most species. Some limited phylogeographic and landscape genetic work has been completed for a few California amphibians and reptiles (or their close relatives), and these analyses have provided key insights into the importance of drainages on stream- and pool-breeding amphibians and reptiles (Shaffer et al. 2000, Spinks and Shaffer 2005, Dever 2007, Wang 2009b, Lind et al. 2011), corridors of land use (Wang et al. 2009), the importance of environmental variables in structuring populations (Savage et al. 2010), and a variety of other problems (e.g., the provenance of introduced populations; Johnson et al. 2010). At a broader, regional-to-range-wide scale, phylogeographic studies have been conducted for several Species of Special Concern, in many cases indicating either that previous subspecies (which often serve as proxies for genetic lineages) are non-diagnosable and correspond poorly to genetic patterns (Rodríguez-Robles et al. 1999b) or that unappreciated lineage diversity is stronger than previously suspected (Shaffer et al. 2004, Leavitt et al. 2007, Parham and Papenfuss 2009). We are aware of phylogeographic work for roughly half of the Species of Special Concern (although many of those studies rely on a single mitochondrial gene and need data from additional nuclear gene analyses), and we strongly encourage the research community to gather these data for the remaining taxa.
Monitoring
To establish that a species or population is declining or recovering requires long-term monitoring. Such efforts can take many forms, each with strengths and weaknesses. Ideally, monitoring data would be generated by intensive, multiyear mark–recapture-based studies that follow the fate of individuals through time, leading to a detailed inventory of population increases and decreases (Heyer et al. 1994). Such monitoring is not difficult conceptually, but it requires time, effort, and often substantial financial resources. However, this is also an area that is undergoing renewed methodological development. Monitoring methods now exist that require less recapture effort and that can incorporate detection probabilities in a rigorous manner, both of which can help to effectively monitor rare and/or cryptic taxa (reviewed by Mazerolle et al. 2007). One such example is the emerging techniques to monitor rare or cryptic taxa via detection of persistent DNA in environmental samples (Ficetola et al. 2008, Dejean et al. 2011).
Techniques to survey amphibians and reptiles vary, depending on the taxon, habitat, and life stage involved. Although standardized survey protocols are essential to proper inventory and monitoring, relatively few have been developed, representing an ongoing research need, particularly for rare taxa or taxa that are difficult to detect. Some of this standardization is beginning to take place and a few excellent resources are available or forthcoming (Heyer et al. 1994; the ongoing Amphibian Research and Monitoring Initiative being undertaken by the US Geological Survey, and the Partners in Amphibian and Reptile Conservation Inventory and Monitoring guides are such examples). In the absence of detailed, multiyear monitoring, we advocate at least two potential approaches that have received relatively little attention to date for amphibian and reptile taxa. The first is single-pass monitoring via population surveys conducted on public lands. Such surveys can be incredibly informative, yet only require a few field days per year to monitor a large number of species and sites (e.g., Thomson et al. 2010). A recent example for 75 ponds from the East Bay Regional Park District provided multiyear data for five species of pond-breeding amphibians and two species of semiaquatic garter snakes, and demonstrates the kind of data that can be collected even with very cursory efforts for each site (S. Bobzien, unpublished data; M. Ryan, unpublished data). A critical goal of such monitoring efforts should be to publish the results in the peer-reviewed literature and/or deposit in a publically available, curated dataset. Our sense is that a great deal of valuable monitoring data exists, but is not easily accessible because it has never been published or made publically accessible. Another type of single-pass “monitoring” can be genetic monitoring. By collecting non-destructive, but vouchered, tissue samples, reasonable estimates of the effective population size (Wang 2009a, Wang et al. 2011), historical population increases or decreases (Piry et al. 1999), and ongoing movement between existing populations (Wilson and Rannala, 2003) can be applied to many populations and species. Although each of these genetic approaches has its own set of assumptions and caveats, together they form a powerful addition to traditional field-based studies of population monitoring.
A second approach to monitoring falls under the more general category of “citizen science” (Bonney et al. 2009, Dickinson et al. 2010). Although often less rigorous and more error prone than more formal monitoring, the interested public comprises a large network of knowledgeable, committed individuals who will often willingly contribute to overall monitoring efforts. These efforts can help identify general patterns of population increases and decreases, as has been amply demonstrated by the very successful Breeding Bird Surveys (Sauer et al. 2011) and Christmas Bird Counts (National Audubon Society 2011) conducted for North American birds. Several programs for citizen-science-based frog and toad monitoring programs are in place in other parts of the United States (e.g., the FrogWatch USA program, http://www.aza.org/frogwatch), and they have provided valuable data on breeding time, duration, and population sizes for frogs and toads based on their audible calls at breeding sites. Road surveys (Coleman et al. 2008) can also provide valuable data on population sizes, although the confounding effects of mortality induced by vehicular traffic is always a concern in such studies. That said, documentation of road mortality, particularly during key migration seasons, is an ideal topic of additional citizen science initiatives. California has recently initiated at least two citizen-science web-based projects focusing on southern California reptiles and amphibians (RASCals; see http://www.nhm.org/site/activities-programs/citizen-science/rascals, and the California chapter of the Field Herp Forum http://www.fieldherpforum.com), both of which seek to increase communication and the dissemination of distributional information on California amphibians and reptiles.
Finally, because monitoring provides the basic information upon which much of conservation rests, a temptation naturally arises to “over-monitor.” By this, we mean that additional monitoring becomes favored over the implementation of management actions. Monitoring efforts constitute the most important strategy for measuring the effectiveness of conservation actions. However, monitoring also carries a cost, because these efforts require valuable conservation resources that otherwise might be spent on direct management efforts. Monitoring efforts should have clearly defined goals and well-characterized statistical power, including an assessment of the added benefit to be gained from future monitoring efforts. Monitoring efforts should be clearly documented, and results should be readily accessible. In some cases, the optimal strategy may be limited, but consistent, monitoring combined with direct conservation actions, rather than evermore detailed monitoring with fewer actions. The implementation of effective management in the face of imperfect knowledge about the status of populations is one of the greatest challenges facing the conservation of many amphibian and reptile species.
Species of Special Concern Conservation Recommendations
To promote the conservation of amphibian and reptile Species of Special Concern in California, we make the following recommendations:
• Maintain a Species of Special Concern Technical Advisory Committee with explicit expertise covering the taxonomic and geographic scope of taxa in California. We recommend that membership on this committee be of relatively limited term (e.g., 10 years) to ensure that new voices and fresh problem-solving strategies are available. We especially encourage that committee composition include some early career scientists, particularly those with strong statistical and technical skills. This group should meet periodically in order to update and revise the status information on the Species of Special Concern.
• Develop and implement a web-based mechanism whereby the Species of Special Concern document can be more easily updated and improved, creating a “living document” that is responsive to changing conditions and new data.
• In conjunction with efforts to facilitate future revisions of this document, support the development of a database that collates species occurrence data. This database should house information on both positive and negative occurrence data and not be limited to species that are already designated as Species of Special Concern.
• Increase wildlife agency capacities to address management needs of California’s amphibians and reptiles, as funding and staffing allow.
• Establish both a priority list and a funding stream for critical research needs for Species of Special Concern.
• Continue to promote strong collaborations between wildlife agencies and the university/research communities throughout California to ensure that the strongest possible science is brought to bear on important management needs and that the state’s research priorities are being pursued.
• Use forthcoming analyses of predicted road usage and construction as a management guide for conservation planning for Species of Special Concern. Included in this analysis should be ways to use tunnels or other constructs to minimize the effects of new and existing roads on Species of Special Concern.
• Create a coordination network for localities, voucher specimens, and tissue samples for amphibian and reptiles from throughout California. Roadkill specimens are a particularly valuable source of information, since they represent vouchered specimens and, in some cases, sources of DNA for genetic research and life history data (diet, body condition, etc.) for ecological studies.
• Create a mechanism by which both professional biologists and concerned citizens can contribute locality, natural history, and other data types that might help detect or quantify conservation risk for Species of Special Concern. Improve data sharing and communication among wildlife agencies, amphibian and reptile conservation groups, and organizations in the avocational herpetological community.
• To facilitate data collection, streamline the process for appropriate permitting for research by professionals, and in the case of citizen science projects, the public.
• Encourage publication of data arising from these efforts in the peer-reviewed literature to increase access to management-relevant findings, particularly for government reports and studies conducted by private consultants.
• Integrate information from this document, as appropriate, with that of an upcoming analysis of the existing regulatory situation for all of California’s amphibians and reptiles and their general conservation needs.