If we take our previous queries and send the results through stats, we can calculate the average events per minute, like this:
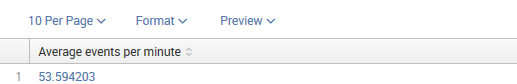
sourcetype=impl_splunk_gen network=prod
| timechart span=1m count
| stats avg(count) as "Average events per minute"
This gives us exactly one row:
Alternatively, we can use bucket to group events by minute, and stats to count by each minute that has values, as shown in the following code:
sourcetype=impl_splunk_gen
| bucket span=1m _time
| stats count by _time
| stats avg(count) as "Average events per minute"
We are now presented with a somewhat higher number:
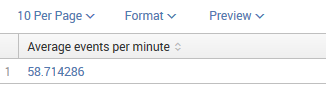
Why? In this case, our fictitious server was down for some time. In our second example, only minutes that actually had events were included in the results because stats does not produce an event for every slice of time, as timechart does. To illustrate this difference, look at the results of two queries:
sourcetype=impl_splunk_gen
| timechart span=1h count
This query produces the following table:

Let's use bucket and stats, as follows:
sourcetype=impl_splunk_gen
| bucket span=1m _time
| stats count by _time
We get this table as the output:

In this case, we used a 1 minute (1m) time slot.