Let's put what we learned about subsearches together with transactions. Let's imagine that q=1 represents a particular entry point into our site, perhaps a link from an advertisement. We can use subsearch to find users that clicked on the advertisement, then use transaction to determine how long these users stayed on our site.
To do this, first we need to locate the sessions initiated from this link. The search can be as simple as:
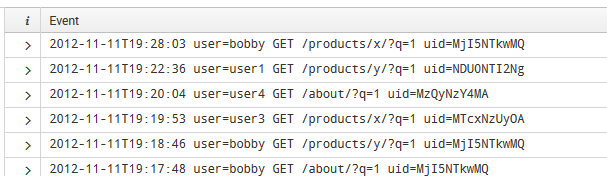
sourcetype="impl_splunk_web" q=1
This will return events like the following:
In our fictitious logs, the field uid represents a session ID. Let's use stats to return one row per unique uid:
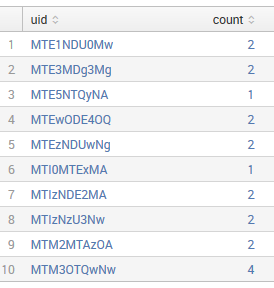
sourcetype="impl_splunk_web" q=1
| stats count by uid
This will render a table like this (only the first 10 rows are shown):
We need to add one more command, fields, to limit the fields that come out of our subsearch:
sourcetype="impl_splunk_web" q=1
| stats count by uid
| fields uid
Now we feed this back into our outer search:
[search
sourcetype="impl_splunk_web" q=1
| stats count by uid
| fields uid
]
sourcetype="impl_splunk_web"
After the subsearch runs, the combined query is essentially as follows:
( (uid=MTAyMjQ2OA) OR (uid=MTI2NzEzNg) OR (uid=MTM0MjQ3NA) )
sourcetype="impl_splunk_web"
From this combined query, we now have every event from every uid that clicked on a link that contained q=1 in our time frame. We can now add transaction, as we saw earlier, to combine these sessions into groups:
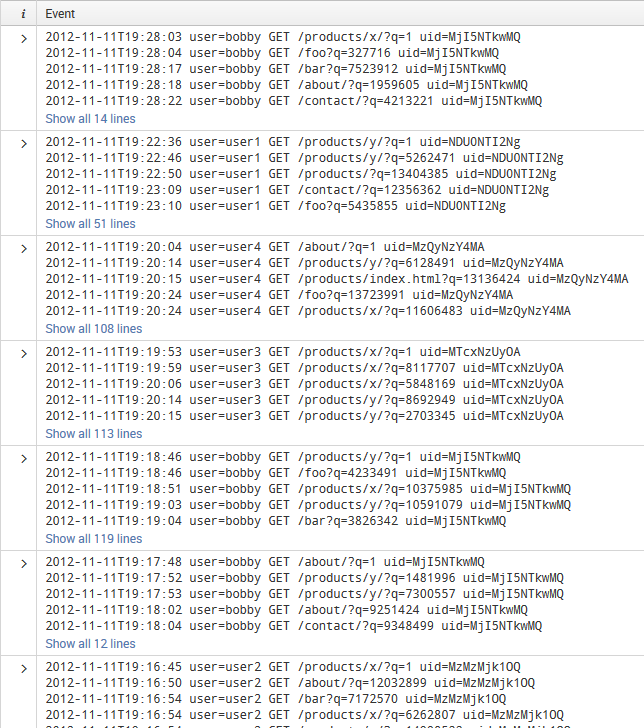
[search sourcetype="impl_splunk_web" q=1
| stats count by uid
| fields uid]
sourcetype="impl_splunk_web"
| transaction maxpause=5m uid
This gives us a list of transactions (shown in part in the following screenshot):

Notice that not all of our transactions start with q=1. This means that this transaction did not start when the user clicked on the advertisement. Let's make sure our transactions start from the desired entry point of q=1:
[search sourcetype="impl_splunk_web" q=1
| stats count by uid
| fields uid]
sourcetype="impl_splunk_web"
| transaction maxpause=5m
startswith="q=1"
uid
The startswith field indicates that a new transaction should start at the time the search term q=1 is found in an event.
The startswith field works only on the field _raw (the actual event text). In this case, startswith="q=1" is looking for the literal phrase "q=1", not the field q.
This will cause any occurrence of q=1 to start a new transaction. We still have a few transactions that do not contain q=1, which we will eliminate next.
To discard the transactions that do not contain q=1, add a search command:
[search sourcetype="impl_splunk_web" q=1
| stats count by uid
| fields uid]
sourcetype="impl_splunk_web"
| transaction maxpause=5m startswith="q=1" uid
| search q=1
Finally, let's add stats to count the number of transactions, the distinct values of uid, the average duration of each transaction, and the average number of clicks per transaction:
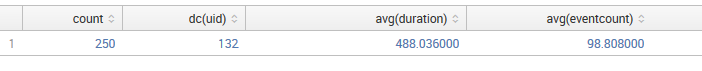
[search sourcetype="impl_splunk_web" q=1
| stats count by uid
| fields uid]
sourcetype="impl_splunk_web"
| transaction maxpause=5m startswith="q=1" uid
| search q=1
| stats count dc(uid) avg(duration) avg(eventcount)
This gives us a table as shown in the following screenshot:
We can swap timechart with stats to see how these statistics change over time:
[search sourcetype="impl_splunk_web" q=1
| stats count by uid
| fields uid]
sourcetype="impl_splunk_web"
| transaction maxpause=5m startswith="q=1" uid
| search q=1
| timechart bins=500 avg(duration) avg(eventcount)