Within the Search & Reporting app, the user is presented with the Summary view, which contains information about the data that the user searches by default. This is an important distinction; in a mature Splunk installation, not all users will always search all data by default. But if this is your first trip into Search & Reporting, you'll see the following:

From the screen depicted in the previous screenshot, you can access the Splunk documentation related to What to Search and How to Search. Once you have at least some data indexed (a topic we'll discuss later), Splunk will provide some statistics on the available data under What to Search.
What to Search is shown in the following screenshot:
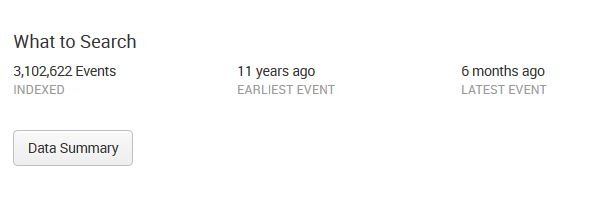
In previous versions of Splunk, panels such as the All indexed data panel provided statistics for a user's indexed data. Other panels gave a breakdown of data using three important pieces of metadata—Source, Sourcetype, and Hosts. In the current version, 7.0.0, you access this information by clicking on the button labeled Data Summary, which presents the following to the user:
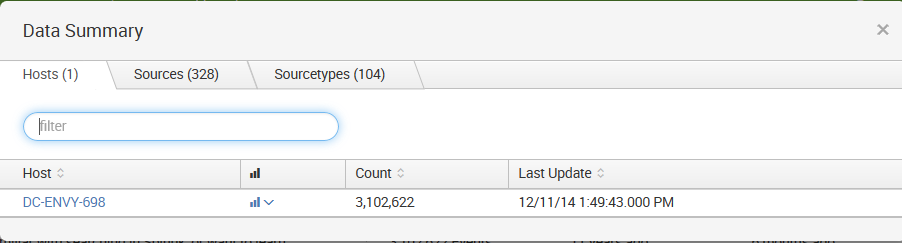
This dialog splits the information into three tabs—Hosts, Sources and Sourcetypes:
- A host is a captured hostname for an event. The majority of cases, the host field is set to the name of the machine where the data originated. There are cases where this is not known, so the host can also be configured arbitrarily.
- A source in Splunk is a unique path or name. In a large installation, there may be thousands of machines submitting data, but all data on the same path across these machines counts as one source. When the data source is not a file, the value of the source can be arbitrary. For instance, the name of a script or network port.
- A source type is an arbitrary categorization of events. There may be many sources across many hosts in the same source type. For instance, given the sources /var/log/access.2012-03-01.log and /var/log/access.2012-03-02.log on the hosts fred and wilma, you could reference all these logs with source type access or any other name that you like.
Let's move on now and discuss each of the Splunk widgets (just below the app name). The first widget is the navigation bar:

As a general rule, within Splunk, items with downward triangles are menus. Items without a downward triangle are links.
We will cover customizing the navigation bar in Chapter 8, Working with Apps.
Next, we find the Search bar. This is where the magic starts. We'll go into great detail shortly:
