Let's try a quick example. Once we have selected a data model (in our case, Aviation Games), from the Select a Dataset page, we can choose Processing Errors, which will land us on the New Pivot (Pivot Editor):

To build a simple pivot, we can do the following quick steps:
- Add/Verify the filters:
Remember, All time is the default; this will include all results found over all time. You can click on the pencil and amend this filter to be based upon any of Splunk's Presets or a specific Date Range:

For this example, we'll just leave the default selection.
- Configure the Split Rows.
Directly under Filters is Split Rows. For Split Rows, I've selected date_month:

- After making the selection, you are able to provide additional settings for the selected row:

I've provided a new name (Label) for the row (my_Month) and left the defaults for Sort, Max Rows (to display), and Totals.
- Configure the Split Columns.
Moving to the upper-right side of the Pivot page, we have Split Columns. For Split Columns, I've selected date_mday:
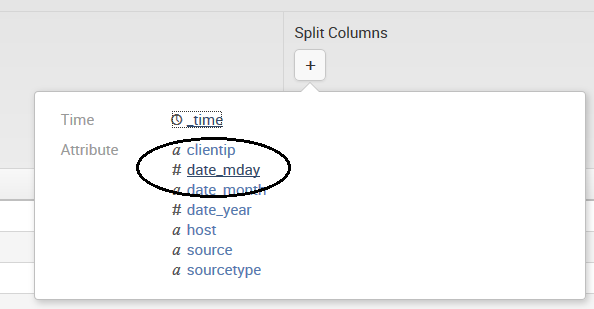
Once you select date_mday, you are given the opportunity to set some additional values:

We'll leave the defaults again and click on the button labelled Add To Table.
- Configure the Column Values. Finally, for the Column Values, (by clicking on the pencil) you can see that Splunk defaulted to providing a count (of processing errors) found in the indexed data (shown in the following screenshot). You can click on the button labeled Update:

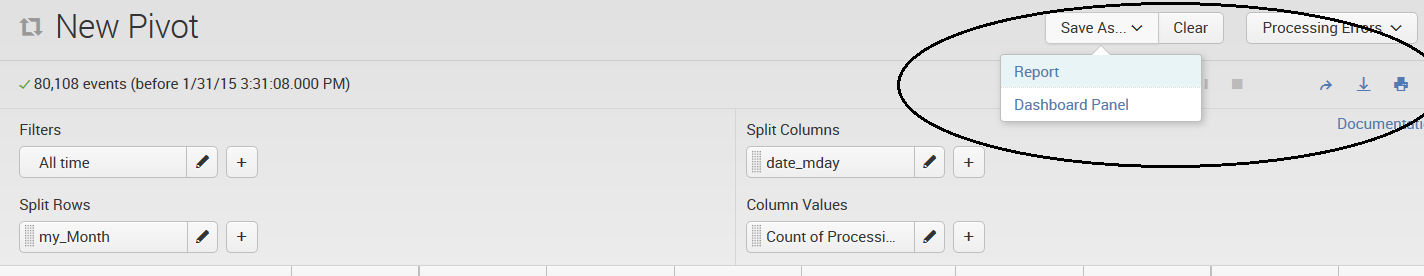
- View the results of our sample pivot in the following screenshot:

From here, you have the option to Clear the Pivot (and start over), or click on Save As and save the pivot as a Splunk report or as a dashboard panel for later use.