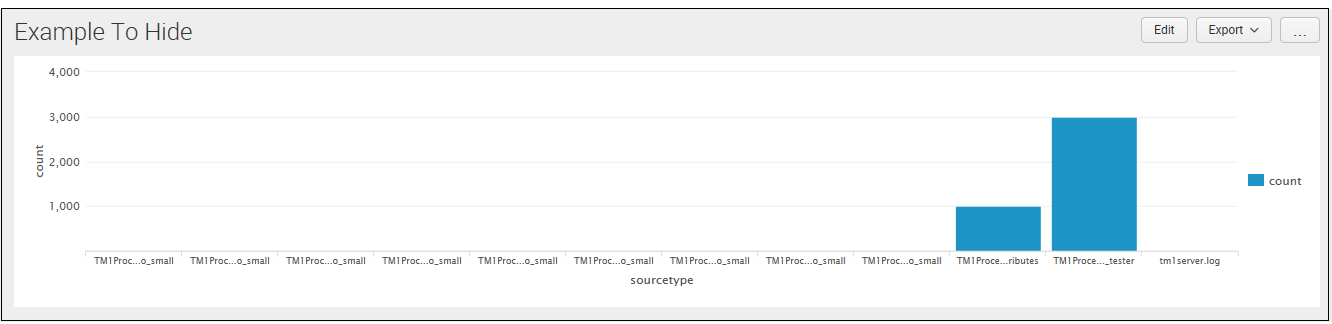
With this option, you can hide the search fields from appearing in a chart to make the chart clearer or to accentuate a particular data point. For example, this visualization shows both the host and count fields:
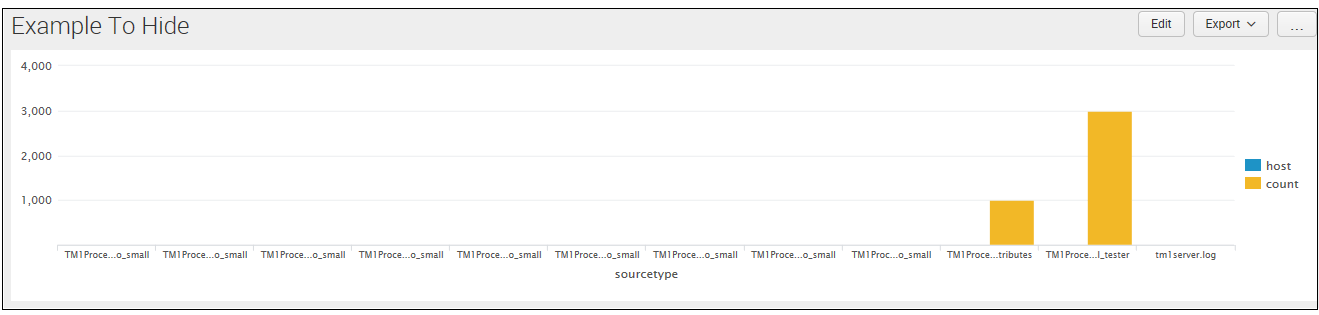
By editing the dashboard XML and adding the following option:
<option name="charting.data.fieldHidelList">["host"]</otion>
We can hide the host field from the chart: