As we've already stated, summary acceleration uses summaries of events to speed up completion times for certain kinds of reports, and report summary acceleration uses automatically created (by Splunk) summaries. You can get Splunk to create these summaries by enabling report acceleration for an eligible existing report by performing the following steps:
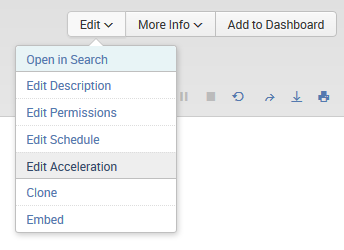
On the Reports page, you can select a report and click on Edit to open the Edit Acceleration dialog, which is seen in the next screenshot:
If this report qualifies for acceleration and your permissions allow for report acceleration, the Edit Acceleration dialog will display a checkbox labeled Accelerate Report. Select it. The Summary Range field should appear (see the following screenshot):
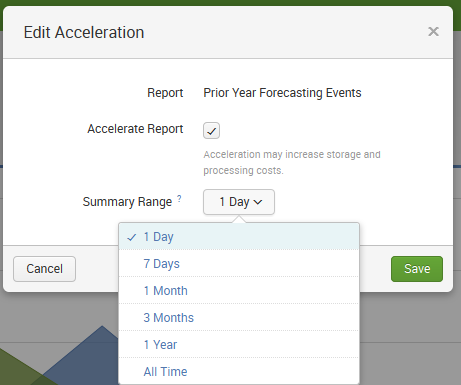
Select the range of time over which you plan to run the report; then click on Save. Now Splunk will create a summary of the events (consisting of events only within the selected time range) that the report will run against, which reduces the amount of data that the report needs to process and thus accelerates the report.
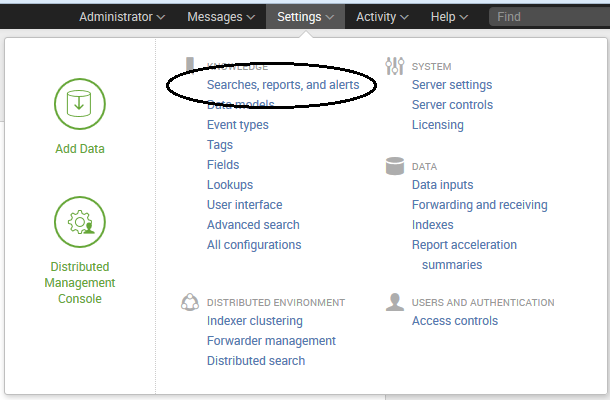
Another method for accelerating a report is to go to Settings and then Searches, reports, and alerts:
From the Searches, reports, and alerts page, you can locate a report, then click on Edit, and then on Edit Acceleration:

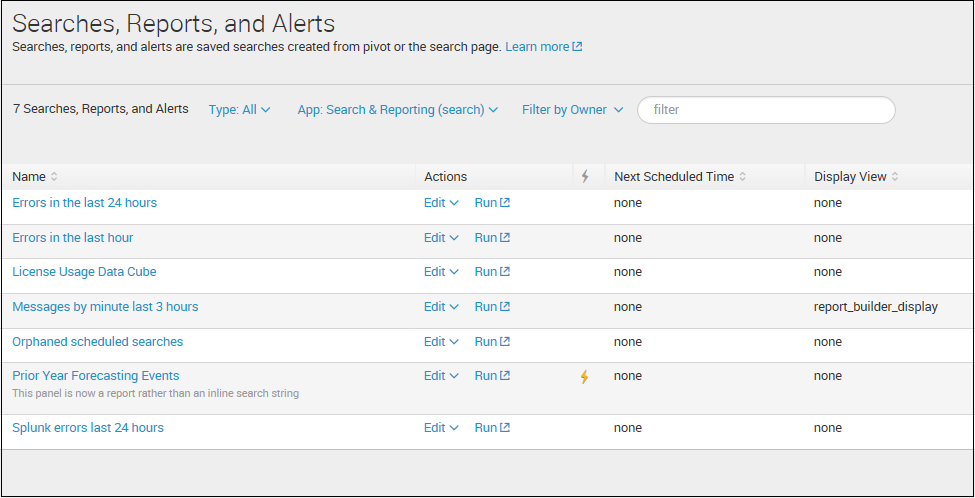
Accelerated reports are indicated on the Searches, reports, and alerts page with a lightning bolt graphic, as shown in the following screenshot: