Some fictitious events are given as follows. Assuming that this is a busy server, there might be a huge number of events occurring between requests from this particular session:
2012-04-27T03:14:31 user=mary GET /foo?q=1 uid=abcdefg
...hundreds of events...
2012-04-27T03:14:46 user=mary GET /bar?q=2 uid=abcdefg
...hundreds of thousands of events...
2012-04-27T06:40:45 user=mary GET /foo?q=3 uid=abcdefg
...hundreds of events...
2012-04-27T06:41:49 user=mary GET /bar?q=4 uid=abcdefg
The definition of huge depends on the infrastructure that you have dedicated to Splunk. See Chapter 12, Advanced Deployments, for more information about sizing your installation, or contact Splunk support.
Let's build a query to see the transactions belonging to mary. We will consider a session complete when there have been no events for 5 minutes:
sourcetype="impl_splunk_web" user=mary | transaction maxpause=5m
 user
Let's step through everything that's happening here:
- The initial query is run, simply returning all events for the user mary:
sourcetype="impl_splunk_web" user=mary
- | transaction starts the command.
- maxpause=5m indicates that any transaction that has not seen an event for 5 minutes will be closed. In a large dataset, this time frame might be too expensive, leaving a huge number of transactions open for longer than necessary.
- user is the field to use for linking events together. If events have different values of user, a new transaction will start with the new value of user.
Given our events, we will end up with four groupings of events:
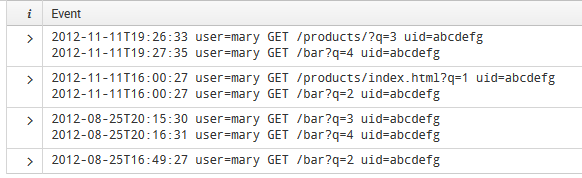
Each of these groupings can then be treated as a single event.
A transaction command has some interesting properties, as follows:
- The field _time is assigned the value of _time from the first event in the transaction.
- The field duration contains the time difference between the first and the last event in the transaction.
- The field eventcount contains the number of events in the transaction (based on how your environment's knowledge objects are set up).
- All fields are merged into unique sets. In this case, the field user would only ever contain mary, but the field q would contain the values [1,2] and [3,4] respectively.
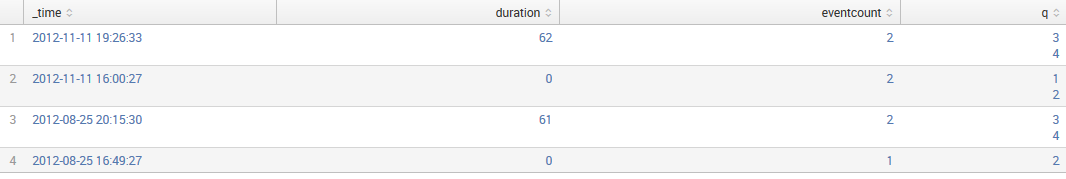
With these extra fields, we can render a nice table of transactions belonging to mary, like this:
sourcetype="impl_splunk_web" user=mary
| transaction maxpause=5m user
| table _time duration eventcount q
This will produce a table like this:
Combining transaction with stats or timechart, we can generate the statistics about the transactions themselves:
sourcetype="impl_splunk_web" user=mary
| transaction maxpause=5m user
| stats avg(duration) avg(eventcount)
This would give us a table as shown in the following screenshot:
