There are times when you want to create events out of thin air. These events could come from a database query, a web service, or simply some code that generates data useful in a query. Just to illustrate the plumbing, we will make a random number generator.
You can find this example in ImplementingSplunkExtendingExamples/bin/random_generator.py:
import splunk.Intersplunk as si
from random import randint
keywords, options = si.getKeywordsAndOptions()
def getInt(options, field, default):
try:
return int(options.get(field, default))
except Exception, e:
#raise a user friendly exception
raise Exception("%s must be an integer" % field)
try:
min = getInt(options, 'min', 0)
max = getInt(options, 'max', 1000000)
eventcount = getInt(options, 'eventcount', 100)
results = []
for r in range(0, eventcount):
results.append({'r': randint(min, max)})
si.outputResults(results)
except Exception, e:
import traceback
stack = traceback.format_exc()
si.generateErrorResults("Error '%s'. %s" % (e, stack))
The entry in commands.conf then is as follows:
[randomgenerator]
filename = random_generator.py
generating = true
We can then use the command as follows:
|randomgenerator
Note the leading pipe | symbol. This is the indication to run a command instead of running a search. Let's test the randomness of our Python code:
|randomgenerator eventcount=100000 min=100 max=899
| bucket r
| chart count by r
This produces a graph, as shown in the following screenshot:
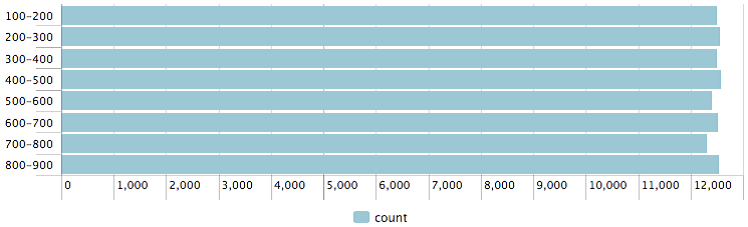
I guess that is not a bad distribution for 100,000 samples. Using Splunk's built-in commands, you could accomplish essentially the same thing using the following code:
index=_internal
| head 100000
| eval r=random()/2147483647*100000
| bucket r
| chart count by r
That was a very quick overview of commands, using fun demonstration commands to illustrate the plumbing required to execute your code. A number of samples ship with Splunk in $SPLUNK_HOME/etc/apps/search/bin.