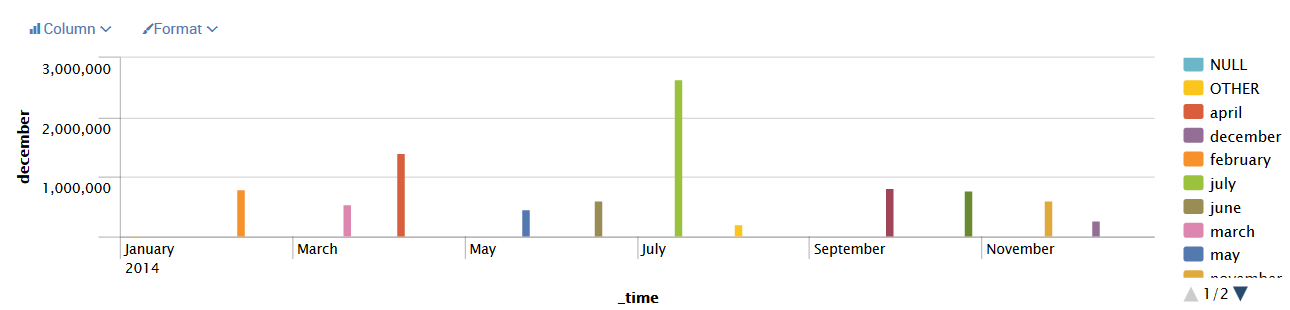
Since the goal of this chapter is understanding Splunk dashboards (and not the fundamentals of searching), we'll utilize several new simple search strings as well as some of the queries from previous chapters to illustrate certain points. So, let's start by making an operational dashboard for showing Forecast Events within our indexed data. The following is a simple search string to begin our exercise:
sourcetype="*" Forecast | timechart count as "Forecast Events" by
 date_month
This is shown in the following screenshot:

In addition to our search string, I've selected Previous Year from the Splunk presets (see the preceding screenshot).
This will produce a graph like this one:
To add this to a dashboard, we can perform the following steps:
- Click on Save As and then choose Dashboard Panel:

- This opens a dialog that guides you through saving the query as a dashboard:

- Enter the following details and click on the Save button:
- Dashboard-New/Existing: This allows you to indicate whether your search is to be saved as part of an existing dashboard or as a new one. In our example, I've selected New.
- Dashboard Title: Simply provide a title for your dashboard to display.
- Dashboard ID: This is the Splunk dashboard ID, which defaults to whatever you have entered for your title, with special characters (such as spaces) replaced.
- Dashboard Description: This is where you can provide a short note about what your dashboard does.
- Dashboard Permissions: Select whether your dashboard will be private (not accessible to other users) or shared within an app.
- Panel Title: This is a sort of subtitle, which means that it will be the title/caption displayed for the dashboard panel (where your search runs).
- Panel Powered By: This is set by Splunk. Our example is powered by an inline search string.
- Panel Content: This is where you indicate a format for the search results.
- You should now receive the following message:

Your new dashboard is ready to use. It is that simple.
As you create more dashboards, you will end up creating a lot of searches. A naming convention will help you keep track of which search belongs to which dashboard. Here is one possible approach:
Dashboard - [dashboard name] - [search name and panel type]
When the number of dashboards and searches becomes large, apps can be used to group dashboards and searches together, providing yet another way to organize and share assets.
After saving our dashboard, it will be available under the Dashboards menu (see the following screenshot):
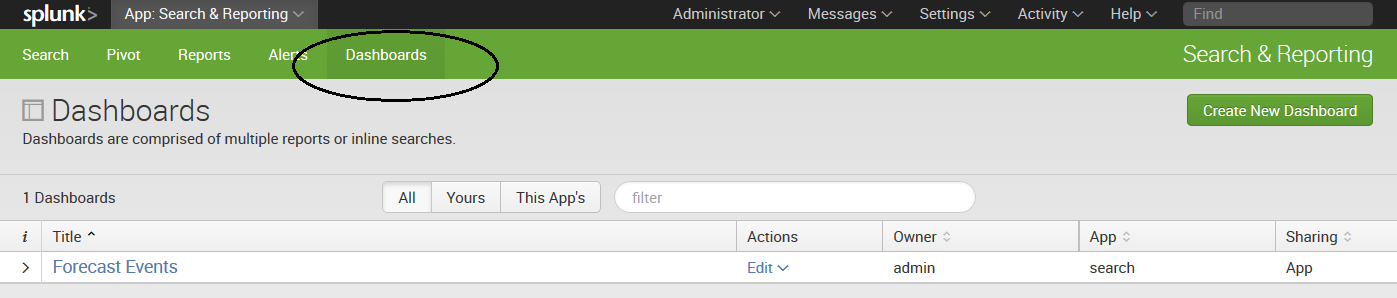
On the Dashboards page, if we click on our dashboard name (Forecast Events), Splunk displays our single panel dashboard:
