One example of separating layout from data would be using a single query to populate both a table and a chart.
The advanced XML for this can look like the following code:
<view template="dashboard.html">
<label>Chapter 9 - Reusing a query</label>
<module
name="StaticContentSample"
layoutPanel="panel_row1_col1">
<param name="text">Text above</param>
</module>
<module
name="HiddenSearch"
layoutPanel="panel_row1_col1"
autoRun="True">
<param name="search">
sourcetype="impl_splunk_gen" loglevel=error | top user
</param>
<param name="earliest">-99d</param>
<module name="HiddenChartFormatter">
<param name="charting.chart">pie</param>
<module name="JSChart"></module>
<module
name="StaticContentSample"
layoutPanel="panel_row1_col1">
<!-- this layoutPanel is unneeded, but harmless -->
<param name="text">Text below</param>
</module>
</module>
<module name="SimpleResultsTable"
layoutPanel="panel_row1_col2"></module>
</module>
</view>
This XML renders a dashboard similar to the following screenshot:
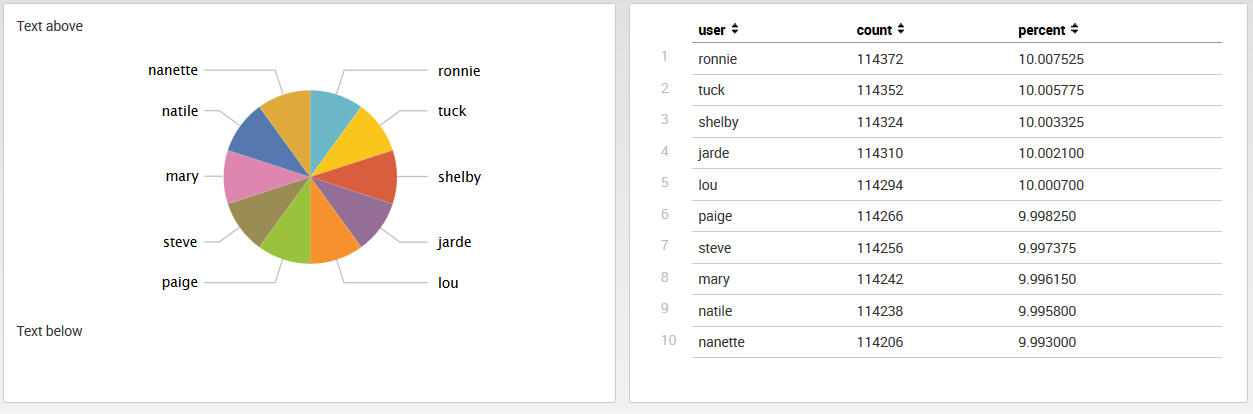
There are some things to notice in this XML:
- The data produced by HiddenSearch is used by both child modules.
- JSChart inherits layoutPanel="panel_row1_col1" from HiddenSearch.
- SimpleResultsTable has its own layoutPanel attribute set to panel_row1_col2, so the table draws to the right.
- Both StaticContentSample modules specify layoutPanel="panel_row1_col1" and, therefore, appear in the same panel as the chart. Even though they are at different depths in the XML, the order drawn follows the order seen in the XML.