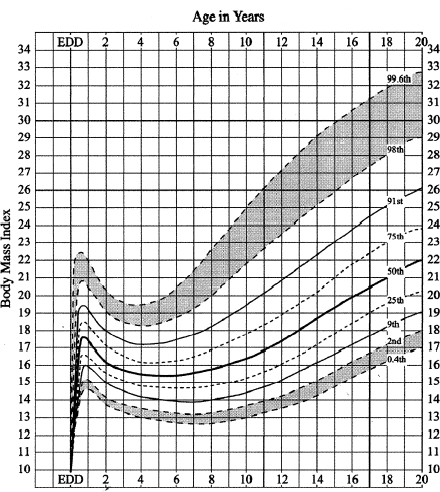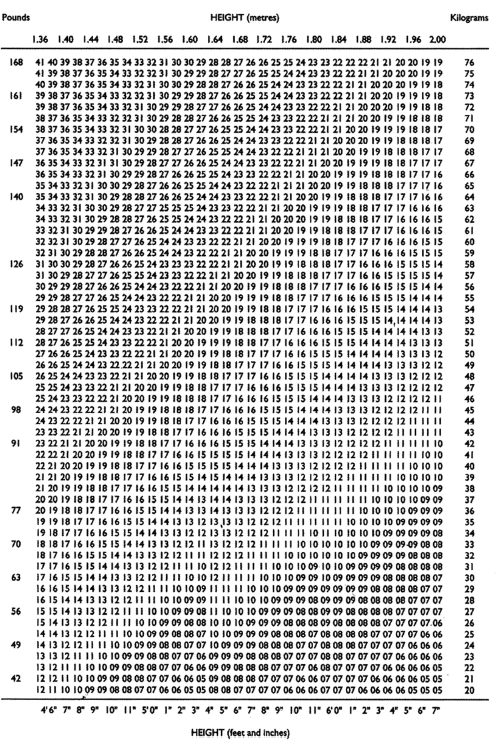
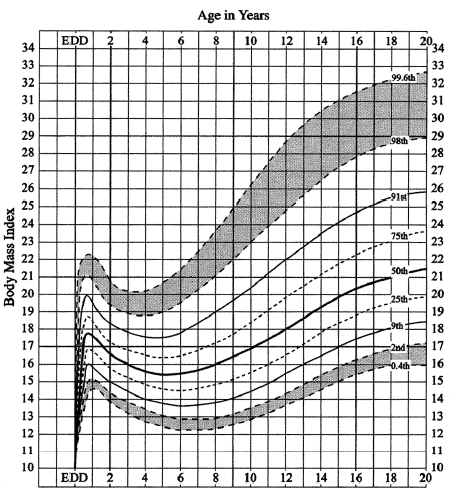
The chart on the next page can be used to determine your body mass index (BMI) and is applicable to both men and women, at any age. Once you have found your BMI on the first graph, there are two subsequent graphs plotting the full BMI range, one for boys and one for girls, with ‘at risk’ levels shown as shaded areas. Between the ages of 0 and 20 the graph is curved, to take into account the growth rates and growth spurts that naturally occur at different ages. It is important to remember that weight gain is usual up until the late teens, and that staying the same weight for prolonged periods during these years is equivalent to losing weight once growth has stopped. At around 20 years of age the graph will plateau, so this level should be used to determine your potential risk status from that age onwards.
Work out your BMI from the chart on page 246, and check below to see where your rating falls.
A girl should be considered for referral if her BMI falls above the 99.6th centile (significantly overweight) or below the 0.4th centile (significantly underweight). It is possible that a girl whose BMI falls in the tinted areas should also be referred.
Work out your BMI from the chart on page 246, and check below to see where your rating falls.
A boy should be considered for referral if his BMI falls above the 99.6th centile (significantly overweight) or below the 0.4th centile (significantly underweight). It is possible that a boy whose BMI falls in the tinted areas should also be referred.