Chapter 3
Establishing Existing Conditions Using Survey Data
With our tour of the AutoCAD® Civil 3D® software user interface and our study of its capabilities behind us, it’s now time to do what we came here to do: Use Civil 3D to complete a land-development project. To begin to understand the task ahead, let’s imagine land development as creating a sculpture, but on a very large scale. If sculptors were to create works of art from wood, they would probably begin by studying the original piece of wood, assessing its dimensions, shape, and surface features. These elements would all factor into how the sculptors would approach their work. A sculptor with some computer savvy might even model the original piece of wood on a computer and plan out each cut of material.
In this chapter, we are going to explore the first activities that are performed during a land-development project: the measurement, mapping, and modeling of the land in its existing form. To plan out how the land will be reshaped, you must first understand how it’s shaped right now. This is analogous to the sculptor’s measurement and assessment of their medium. The measurement and mapping of land is known as surveying, and the data that is collected during the process is known as survey data.
In this chapter, you’ll learn to
- Understand the purpose and function of survey data
- Create a survey database
- Import survey data
- Automate field-to-finish
- Edit survey points
- Edit survey figures
- Create points
What Is Survey Data?
Think back to the last time you played connect-the-dots to draw a picture. Ever wonder who made the dots and how they were made? I’m no expert, but I’m guessing someone took the original picture, laid a piece of tracing paper over it, and made dots along the edges of key features in the picture. Someone skilled at this would make just enough dots to define the features but not so many as to make them confusing or wasteful. The dots are a way of capturing an image and transferring it to another location.
In land development, the land is the picture and the surveyor is the one who makes the dots—referred to as points. Obviously, tracing paper can’t be used, so the surveyor lays an imaginary grid over the land (a coordinate system) and creates the points as information by recording their coordinates on this grid paper. The tools the surveyor uses are extremely accurate and are capable of capturing the location of each point within a tolerance of about 1/8 of an inch (3 mm). Something different about the surveyor’s “dots” is that their location is recorded in all three dimensions. This enables a technician to play connect-the-dots in 3D to create a 3D model in addition to a 2D map of the features of the land. Another difference is that a surveyor’s dots have description codes next to them instead of just numbers. A description code identifies the type of feature that a dot, or point, is intended to represent (see Figure 3-1).

Figure 3-1: Survey points shown as dots, giving a sense of how they are used to create mapping
If you’re thinking that it takes a lot of points to capture several acres of land, you’re absolutely right. How can you keep track of all those points? How can they be easily turned into a 3D model of the land? Is there some way of automating the connect-the-dots process? Civil 3D has the answers to these questions, and in this chapter, you’ll learn how you can use Civil 3D to transform raw field points into maps and 3D models of the land.
Creating a Survey Database
In Chapter 2, “Leveraging a Dynamic Environment,” you learned about the importance of relationships in Civil 3D and saw firsthand how Civil 3D makes use of interactions between different object types. When you’re dealing with survey data, these relationships are managed in a survey database. The raw data is linked with the screen representation of the points in the survey database, which is linked with the linework generated by connecting those points, and so on. The survey database is unique in Civil 3D in that it’s stored outside the drawing file.
Exercise 3.1: Create a Survey Database
In this exercise, you’ll create a survey database.
If you haven’t already done so, go to the book’s web page at www.sybex.com/go/civil3d2015essentials and download the files for Chapter 3. Unzip the files to the correct location on your hard drive according to the instructions in the introduction. Then, follow these steps:
- Open Civil 3D, and click New on the application menu. When prompted for a template, browse to the

Chapter 03class data folder and openEssentials.dwt. - Click the Survey tab of the Toolspace.
- Right-click Survey Databases, and select Set Working Folder.
- Browse to and select the
Chapter 03class data folder, and click OK. - Right-click Survey Databases, and click New Local Survey Database.
- Type
Essentialsas the new database name, and click OK. - The
Essentialsdatabase is now shown on the Survey tab. Note the components of the survey database, such as Import Events, Networks, Figures, and Survey Points (see Figure 3-2). The survey database establishes and manages relationships between these different components. - Close the drawing without saving.
There is no “Complete” drawing for this exercise because you did not modify a drawing file. You did create a new survey database, but it’s currently empty. In the next exercise, you’ll use the Essentials 1 survey database, which has already been created for you.
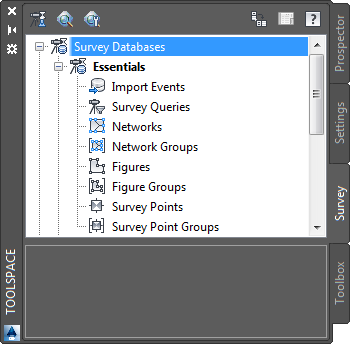
Figure 3-2: The Essentials survey database shown in Prospector after the completion of step 7
Importing Survey Data
After creating a survey database to receive the data, the next step is to transfer the raw data into Civil 3D so the analysis and mapping can begin. There are several ways to accomplish this, but in this chapter you’re going to do it the way a surveyor would do it. The process of importing data requires some important questions to be answered. For your first try, however, you’re going to accept all the defaults and see what happens.
Exercise 3.2: Import Survey Data
In this exercise, you’ll import survey data into a survey database and into a drawing.
If you haven’t already done so, go to the book’s web page at www.sybex.com/go/civil3d2015essentials and download the files for Chapter 3. Unzip the files to the correct location on your hard drive according to the instructions in the introduction. Then, follow these steps:
- Open the drawing named
Import Survey Data.dwglocated in theChapter 03class data folder. - On the Home tab of the ribbon, click Import Survey Data.

- Select the
Essentials 1survey database, and click Next. - Under Data Source Type, select Point File.
- Click the plus icon under Selected Files, and browse to the

Chapter 03class data folder. - For Files Of Type, select the Text/Template/Extract File (*.txt) option. Then select
Topo Survey.txt, and click Open. - Under Specify Point File Format, select PNEZD (Comma Delimited).
- Click Next. In the Specify Network dialog box, note that <none> is selected for the current network. Click Next.
- In the Import Options dialog box, check the boxes next to Process Linework During Import and Insert Survey Points.
- Verify that Current Figure Prefix Database and Current Linework Code Set are both set to Sample.
- Click Finish.
- Zoom in to the drawing, and examine what you see (see Figure 3-3).
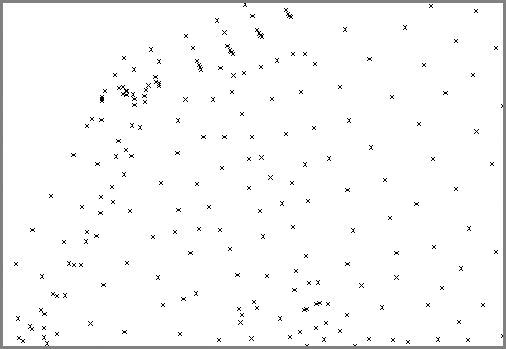
Figure 3-3: So far, importing data shows only a bunch of relatively meaningless x markers in the drawing.
- Save and close the drawing.
You can view the results of successfully completing this exercise by opening Import Survey Data - Complete.dwg. The survey database named Essentials 2 is provided for the next exercise and matches what you should have at the end of this exercise. It contains the same points you just imported.
Automating Field-to-Finish
The term field-to-finish refers to the process of transforming raw survey field data into a finished drawing. Before computers, the point data collected in the field was plotted on paper by hand, and draftspeople skillfully connected the dots and employed other methods to create the desired topographic map. The process was manual in the truest sense of the word. Next came the first CAD programs, in which points could be plotted on a computer screen and the dots connected using primitive entities such as lines, arcs, polylines, and blocks. This is what many would now refer to as a “manual” process.
As you might guess, the process of making a drawing out of point data is quite tedious and presents an opportunity for automation. Imagine using the result from the steps in the previous section (see Figure 3-3) to create a map of the land. With no information accompanying the points, it would be nearly impossible. In the following sections, you’ll see how to use several Civil 3D features to automate this process, resulting in a drawing that is 80 to 90 percent complete immediately after you import the raw field data. However, as is usually the case, the more automation you want, the more setup you’re required to perform. Automation is another way of saying that you’re going to make a bunch of decisions ahead of time and ask the computer to carry out those decisions when needed.
The following Civil 3D features enable you to convert raw field data into drawing information.
Linework Code Set
To create linear features using connected points, someone has to tell those features when to start, when to end, when to draw curves, when to draw straight lines, and so on. In other words, it can be a bit more complicated than “Draw a line from point 1 to point 2.” Field crews use codes to carry out these geometric instructions. For example, they might include the string BEG when locating the first point on a fence line, which means to begin a new feature at that point. The linework code set correlates these field codes with instructions that control the generation of linework in the drawing. This is the way of telling Civil 3D that BEG means “begin drawing here,” BCV means “begin curve here,” and so on. Another way to think of a linework code set is as a translator between field language and Civil 3D language.
Exercise 3.3: Apply a Linework Code Set
In this exercise, you’ll assign a linework code set to your drawing and apply it to points that have been imported.
If you haven’t already done so, go to the book’s web page at www.sybex.com/go/civil3d2015essentials and download the files for Chapter 3. Unzip the files to the correct location on your hard drive according to the instructions in the introduction. Then, follow these steps:
- Open the drawing named
Linework Code Set.dwglocated in theChapter 03class data folder. - Click the Survey tab of the Toolspace.
- If the contents beneath the
Essentials 2survey database are not visible, right-clickEssentials 2and select Open For Edit. - Expand Import Events. Right-click
Topo Survey.txt, and select Properties. - Click the Browse icon next to File to open the text file. Notice the codes BEG, BCV, ECV, and END. These are the codes used in the field to represent Begin Feature, Begin Curve, End Curve, and End Feature. If you scroll down in the text file, you’ll also see the CLS code, which represents Close Feature.

- Close the text file, and click Cancel to dismiss the Import Event Properties dialog box.
- Click the icon in the top-left corner of the Survey tab to edit the survey user settings.

- Click the Browse icon next to Linework Code Sets Path, browse to the

Chapter 03class data folder, and click OK. Click OK to dismiss the Survey User Settings dialog box. - On the Survey tab, right-click Linework Code Sets and select Refresh. Click the plus sign next to Linework Code Sets. You should now see Essentials listed as a Linework Code Set.
- Under Linework Code Sets, right-click Essentials and select Make Current.
- Under Linework Code Sets, right-click Essentials and select Edit. Notice that the codes used for Begin, End, Begin Curve, End Curve, and Close now match what you saw in the text file. The codes in the linework code set named Sample were different, and therefore no linework was drawn when you imported the survey data.
- Click Cancel to dismiss the Edit Linework Code Set dialog box.
- Under Import Events, right-click
Topo Survey.txtand select Process Linework. - For Current Linework Code Set, select Essentials, and click OK.
- Save and close the drawing.
You can view the results of successfully completing this exercise by opening Linework Code Set - Complete.dwg. The survey database named Essentials 3 is provided for the next exercise and matches what you should have at the end of this exercise.
Point Styles
Not all points are meant to be connected with other points. Some represent stand-alone features such as power poles, manholes, or trees. These types of features are typically represented with a symbol that either resembles their true form or uniquely identifies them. With the Point Styles feature, a symbol can be used to mark a point, meaning the likeness of a power pole, manhole, or tree can be used instead of an x or a dot.
Point Label Styles
For some points, you might want labeling to be included automatically. For example, you may want trees to be labeled with their common names or manholes to be labeled with their top elevations. When the annotation is very uniform, Point Label Styles can be employed to provide the desired labels automatically.
Description Keys

As discussed, it takes a lot of points to capture several acres of land effectively. To make things even more challenging, field crews often use abbreviated versions of descriptions to represent points, such as EP for edge of pavement, CLRD for centerline of road, and so on. The result is hundreds or even thousands of points all clumped together and labeled with cryptic abbreviated descriptions.
Description keys solve this problem by automatically sorting the points onto the appropriate layers, rewriting the abbreviated descriptions to full-length descriptions, and automatically applying point styles to control the appearance of the points. For example, a description key takes a point coded as PP, places it on the utility layer, displays it as a power pole, and rewrites the description to say POWER POLE. Imagine the time saved when this is done automatically for 10,000 points.
Exercise 3.4: Configure and Apply a Description Key
In this exercise, you’ll configure a description key for the tree points in your drawing. You’ll apply the description key and observe the automation that it enables.
If you haven’t already done so, go to the book’s web page at www.sybex.com/go/civil3d2015essentials and download the files for Chapter 3. Unzip the files to the correct location on your hard drive according to the instructions in the introduction. Then, follow these steps:
- Open the drawing named
Description Keys.dwglocated in theChapter 03class data folder. - Click the Settings tab of the Toolspace, and expand Point ⇒ Description Key Sets.
- Right-click Essentials, and select Edit Keys.
- Click the cell in the Style column for code TR* to open the Point Style dialog box.
- Select Tree as the point style, and click OK.
- Click the green check mark to dismiss Panorama.

- Click the Prospector tab, and then click Points.
- In the listing of points at the bottom of Prospector, scroll to the right and click the Raw Description column heading to sort the points by that property.
- Scroll to the bottom of the list where all the TR points are now located.
- Right-click one of the points, and select Apply Description Keys. One of the points in the drawing should become a tree symbol.
- Select all the TR points, and use the Apply Description Keys command to change them. All the trees in the drawing are now clearly visible and appropriately represented.
- Return to the Settings tab, and edit the Essentials description key set once again. This time, assign a point label style of Description Only to the TR* code. Apply description keys to the TR points from within Prospector as you did before.
- Edit the TR* description key code again, this time changing the Format value to
$1″ $2($1mm $2). - Apply the description keys to the TR points again. This time, the labels make more sense and read 12″ (300mm) PINE, 15″ (375mm) MAPLE, and so on.
- Save and close the drawing.
You can view the results of successfully completing this exercise by opening Description Keys - Complete.dwg. No change was made to the survey database during this exercise.
Figure Prefix Database
As discussed, the linework code set handles how field codes are translated into linework commands, but what happens to those features once they are drawn? What layer are they drawn on? Do they have any special purpose such as a property line or breakline? The figure prefix database is the means by which these decisions can be made up front for specific codes. For example, any feature drawn through points coded EP (edge of pavement) will be drawn on the pavement layer and tagged as a key component for establishing a hard edge in the 3D model of the terrain, also known as a breakline.
Exercise 3.5: Apply a Figure Prefix Database
In this exercise, you’ll assign a figure prefix database to your drawing and apply its settings to the linework in your drawing.
If you haven’t already done so, go to the book’s web page at www.sybex.com/go/civil3d2015essentials and download the files for Chapter 3. Unzip the files to the correct location on your hard drive according to the instructions in the introduction. Then, follow these steps:
- Open the drawing named
Figure Prefix Database.dwglocated in theChapter 03class data folder. - On the Survey tab of the Toolspace, click the Edit Survey User Settings icon in the top-left corner.

- Click the Browse icon next to Figure Prefix Database Path. Browse to and select the

Chapter 03class data folder, and then click OK. - Click OK to dismiss the Survey User Settings dialog box. Right-click Figure Prefix Databases, and select Refresh. Click the plus sign next to Figure Prefix Databases to expand its contents. You should now see Essentials listed under Figure Prefix Databases.
- Right-click Essentials, and select Make Current. Right-click Essentials again, and, this time, select Manage Figure Prefix Database.
- Scroll down, and examine the codes in the Name column. These match the codes you saw in the text file containing the survey data.
- Click Cancel to dismiss the Figure Prefix Database Manager dialog box.
- If the contents of the
Essentials 3survey database are not visible, right-clickEssentials 3and select Open For Edit. - Expand Import Events. Right-click
Topo Survey.txt, and select Process Linework. - In the Process Linework dialog box, select Essentials for Current Figure Prefix Database and click OK. Civil 3D redraws the linework, this time doing so on the appropriate layers. This is evident in the linetypes that are applied to the treelines and fence lines, which are now appropriately represented on the drawing (see Figure 3-4).
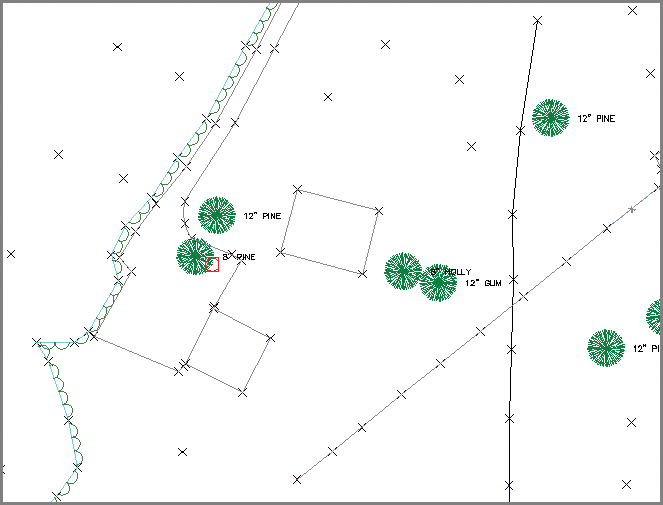
Figure 3-4: The appearance of the drawing makes more sense now that features such as fence lines and treelines have been drawn on the appropriate layers.
- Save and close the drawing.
You can view the results of successfully completing this exercise by opening Figure Prefix Database - Complete.dwg. The survey database named Essentials 4 is provided for the next exercise and matches what you should have at the end of this exercise.
Point Groups
Point groups are another way of managing large amounts of point data. This feature enables you to sort points based on a number of factors, such as description, elevation, point number, and manual selection. You can set up point groups ahead of time so that points can be automatically sorted into groups as they are imported into the drawing. You can also create new point groups on the fly to sort points as you go.
Once points have been grouped, you can use them to study and manipulate multiple points at once. The groups are listed in Prospector, and you can view the points contained in each group simply by clicking the group name and viewing the contents of the point group in the item view at the bottom (see Figure 3-5). In addition, many point-editing commands allow you to select points by group, enabling you to modify large numbers of points at once.
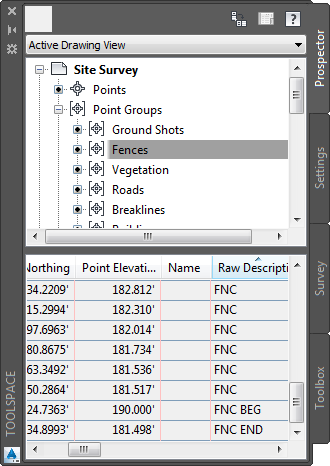
Figure 3-5: The contents of a specific point group shown in the item view of Prospector
Point groups also enable you to assign default point styles and label styles to points within the group. With this capability, you can make points in a certain group take on specific graphical characteristics by controlling the point style and point label style.
Exercise 3.6: Create and Apply Point Groups
In this exercise, you’ll configure several point groups and use them to organize points in your drawing as well as control their appearance.
If you haven’t already done so, go to the book’s web page at www.sybex.com/go/civil3d2015essentials and download the files for Chapter 3. Unzip the files to the correct location on your hard drive according to the instructions in the introduction. Then, follow these steps:
- Open the drawing named
Point Groups.dwglocated in theChapter 03class data folder. - In Prospector, right-click Point Groups and select New.
- On the Information tab of the Point Group Properties dialog box, type Buildings in the Name field. Select Basic as the point style and <None> as the point label style.
- Click the Raw Description Matching tab. Check the box next to BLD*, and click OK.
- Expand Point Groups, and click the Buildings point group in Prospector. Examine the list of points shown in the Prospector item view at the bottom. Note that they all are points with a BLD description.
- Create the following point groups with the associated raw descriptions listed. Use a default Point Style value of Basic and a default Point Label Style of <None> for each point group:
- Breaklines: BOB, BOTD, SWL, TOB, TOPD
- Roads: CLRD, DW, EP, ES
- Vegetation: ESHB, TL, TR
- Fences: FNC
- Ground Shots: GS
- Click the Settings tab, and expand Point ⇒ Description Key Sets.
- Right-click Essentials, and select Edit Keys.
- Hold down the Shift key to select all rows except the last one (TR*). Then right-click the Style column heading, and select Edit.

- Select <default>, and click OK. Click the green check mark to close Panorama.
- In Prospector, right-click the All Points point group and select Apply Description Keys. This applies the new style choice of <default> to all points except trees. Now the point style assigned by the point groups is able to have an effect, and most of the points change from x markers to circle markers.
- In Prospector, right-click the Ground Shots point group and select Properties.
- On the Information tab, select Ground Shot as the default point style and Elevation Only as the default point label style. Click OK, and notice what happens to all the ground shot points in the drawing.
- Click the Output tab of the ribbon, and then click Export Points.

- Check the box next to Limit Points To Point Group, and choose the Roads point group.
- Click OK, and browse to your
Chapter 03class data folder. EnterRoad Pointsas the name of the file, and click Open. Then click OK to dismiss the Export Points dialog box. - Save and close the drawing.
You can view the results of successfully completing this exercise by opening Description Keys - Complete.dwg. The survey database was not changed as a result of this exercise.
Editing Survey Points
As discussed, it takes many points to survey a piece of land—that’s hundreds or even thousands of individual measurements and hand-typed field codes. On nearly every project, there will be items that require editing. Once the data has been imported into Civil 3D, the field crew is off to its next job, and the task of fixing things up belongs to you.
For several reasons, editing survey points is a bit different from editing “regular” points, properly referred to as COGO points. One reason is that survey points are considered “sacred” and are not typically moved or modified in any way without considerable thought and/or the supervision of a surveyor. The second reason, related to the first, is that Civil 3D uses a separate survey database system to store points. The points in the drawing are essentially locked and can’t be changed unless the information in the survey database changes. With this system, a surveyor can send out the drawing file without sharing the survey database that goes with it. When the points in the drawing are separated from the survey database, they become locked and can’t be easily modified. In this way, the survey database gives control of the points to the person who created them.
Exercise 3.7: Edit Survey Points
In this exercise, you’ll edit a survey point to correct a field coding error. You’ll demonstrate that access to the survey database is necessary for editing survey points.
If you haven’t already done so, go to the book’s web page at www.sybex.com/go/civil3d2015essentials and download the files for Chapter 3. Unzip the files to the correct location on your hard drive according to the instructions in the introduction. Then, follow these steps:
- Open the drawing named
Edit Survey Points.dwglocated in theChapter 03class data folder. If a survey database is open, right-click it and select Close Survey Database. - Locate and zoom in to the red point along the west treeline, as shown in Figure 3-6.
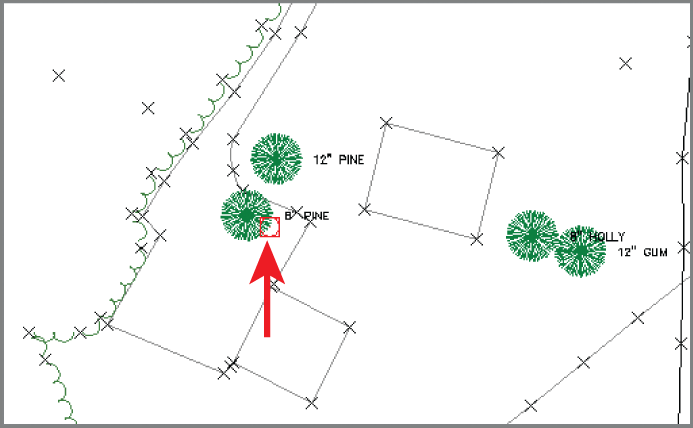
Figure 3-6: An error has caused this point to display incorrectly.
- Open the Properties window, and then select the red point. Note that there is a typo in the raw description. It should say TR 12 PINE (TR 300 PINE) instead of TTR 12 PINE (TTR 300 PINE). You can’t edit the raw description here because the data is stored in the survey database.
- With the point still selected, click Survey Point Properties on the ribbon. A dialog box opens, informing you that you must open a survey database.

- Click OK to dismiss the dialog box. Then right-click the
Essentials 4survey database on the Survey tab, and select Open For Edit. - With the red point still selected, click Survey Point Properties on the ribbon.

- Edit the description to say TR 12 PINE (TR 300 PINE), and click OK.
- Press Enter to end the command. You’re prompted to update linework in the drawing.
- Click No to dismiss the Edit Survey Point Properties—Process Linework dialog, because the change you made does not affect linework.
- Click the red point, right-click, and select Apply Description Keys.
- Save and close the drawing.
You can view the results of successfully completing this exercise by opening Edit Survey Points - Complete.dwg. The survey database named Essentials 5 is provided for the next exercise and matches what you should have at the end of this exercise.
Editing Survey Figures
Mistakes in the field can lead to errors in the way linework is drawn. Once again, the changes need to be made a certain way because you’re dealing with special survey objects, this time survey figures. Survey figures are linked to the survey database but unlike survey points, they can be edited without accessing the survey database. If you edit survey figures in this way, you need to be aware that the objects you've edited are no longer in sync with the survey database. When this occurs you should take steps to keep them in sync to ensure that the correct data is used in the future.
Exercise 3.8: Edit Survey Figures
In this exercise, you’ll edit several survey figures to correct errors that took place due to incorrect translation from the field to the drawing.
If you haven’t already done so, go to the book’s web page at www.sybex.com/go/civil3d2015essentials and download the files for Chapter 3. Unzip the files to the correct location on your hard drive according to the instructions in the introduction. Then, follow these steps:
- Open the drawing named
Edit Survey Figures.dwglocated in theChapter 03class data folder. - If the contents beneath the
Essentials 5survey database are not visible, right-clickEssentials 5and select Open For Edit. - In the top-right viewport, locate the building that is missing its north side. Click the building figure line, and then click Survey Figure Properties on the ribbon. Notice that point 285 is missing a CLS (close) code that would provide the north side of the building by closing the rectangle.

- Click point 285 in the point list; then set the Closed value to Yes, and click OK. The shape of the building is now closed. Because you used the Survey Figure Properties command to edit this figure, the drawing and the survey database are in sync.
- Press Esc to clear the previous selection. Pan to the southeast until you can see the building to the west of the 6″ (150mm) pine. This building should appear as two separate buildings.
- Click the building figure, and then click Survey Figure Properties on the ribbon.

- In the Figure Properties dialog box, click point 288 and then click the red X icon. Remove points 289, 290, and 291 in the same manner.

- Click OK to close the Figure Properties dialog box. Now only the north building is shown in the drawing.
- Right-click Figures on the Survey tab, and select Create Figure Interactively.
- When prompted, enter
BLD2as the figure name, and click OK. - Click the four points that make up the smaller building, and then press Enter.
- In the Figure Properties dialog box, set the Closed value to Yes. If necessary, adjust the order of the points using the arrow buttons. Click Apply and then OK when the blue figure outline appears as a rectangle in the drawing. The building figure now appears as it should, and the two separate buildings are represented properly, as shown in Figure 3-7.
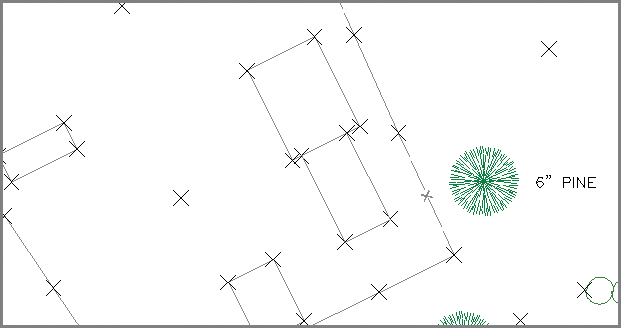
Figure 3-7: The result of editing the building figures
- Save and close the drawing.
You can view the results of successfully completing this exercise by opening Edit Survey Figures - Complete.dwg. The survey database named Essentials 6 is provided for the next exercise and matches what you should have at the end of this exercise.
Creating Additional Points
You may occasionally need to create your own points to establish key locations in the drawing. For example, early in the design, you may want to show specific locations for proposed test borings or property corners that need to be found. Another example is that you may have a point file that you would like to import into the drawing without including it in a survey database. Civil 3D has a multitude of tools designed to create points easily and efficiently. They are found on a special toolbar that opens when you click the Point Creation Tools command on the Home tab of the ribbon.
In many ways, the points you create using these tools are treated in the same manner as those created by importing survey data. They can be placed in point groups and can respond to description keys. They can also be affected by point styles and point label styles. There are differences, however, between these points and those created by importing survey data. For example, Civil 3D can’t automatically generate linework by importing points in this manner. Also, these points don’t have the protection of the survey database, allowing them to be edited by anyone who opens the drawing. Regardless of how they are created, all points can be exported to a file that can be uploaded to a portable device and taken to the field to be staked out.
Exercise 3.9: Import Points and Create Points Manually
In this exercise, you’ll begin by importing points that represent property corners that were found on the site. Then you’ll create stake-out points to assist field crews in locating several missing property corners. You’ll also create points along the proposed road centerlines. These points will represent the locations of soil-test borings to be performed on the site.
If you haven’t already done so, go to the book’s web page at www.sybex.com/go/civil3d2015essentials and download the files for Chapter 3. Unzip the files to the correct location on your hard drive according to the instructions in the introduction.
- Open the drawing named
Stake Out.dwglocated in theChapter 03class data folder. This drawing contains a calculated property boundary reconstructed from a deed or other source of information. It also contains a preliminary layout of the road centerlines that will be used to determine soil-test boring locations. You’ll begin by inserting points into the drawing that represent property corners located in the field. - On the Insert tab of the ribbon, click Points From File.

- In the Import Points dialog box, select PNEZD (Comma Delimited) as the format. Then click the plus sign icon and browse to the

Chapter 03class data folder. - For Files Of Type, select the Text/Template/Extract File (*.txt) option. Then select
Found Corners.txt, and click Open. - Click OK to dismiss the Import Points dialog box.
- In the Duplicate Point Number dialog box, under Resolution, select Add An Offset. Type 1000 in the box below Add An Offset From, and click OK.
- In Prospector, expand Point Groups. Right-click Found Corners, and select Update.
This applies the default styles from the point group to the newly imported points. Found corners appear with red markers and text. Notice that two points are missing along the south property boundary as well as one point on the east property boundary and one at the northwest corner (four points in all). Finding and locating these corners in the field will greatly improve the accuracy and validity of the property survey.
- On the Home tab of the ribbon, click Points ⇒ Point Creation Tools.

- On the Create Points toolbar, click the button on the far left to launch the Miscellaneous Manual tool. In the left viewport, snap to the locations of the missing points.

- In Prospector, right-click the Corners To Be Found point group and select Update.
These points display in blue.
- On the Create Points toolbar, click the chevron on the far right to expand the toolbar.

- Expand Points Creation, and enter BORE as the default description.
- Click the down arrow on the button farthest to the left, and then click Measure Object.

- Click one of the magenta road centerlines. Press Enter three times to accept the default starting station, ending station, and offset.
- Type an interval of 250 (80), and press Enter. The points are created at a 250″ (80m) interval along the polyline you’ve selected.
- In Prospector, update the Test Borings point group.
- Repeat steps 13 to 16 for the remaining road centerlines.
- On the Output tab of the ribbon, click Export Points.

- For format, select PNEZD (Comma Delimited). Check the box next to Limit To Points In Point Group, and select Corners To Be Found.
- Click OK, and browse to the
Chapter 03class data folder. Specify a filename ofCorners to be Found.txt. - Repeat steps 19 to 21 for the Test Boring point group to create a
Test Borings.txtpoint file. - Save and close the drawing.
You can view the results of successfully completing this exercise by opening
Stake Out - Complete.dwg. There was no change to the survey database as a result of this exercise.