Chapter 13
Displaying and Annotating Parcels
In the previous chapter, you used AutoCAD® Civil 3D® software to design a layout for subdividing the original project parcel into many smaller parcels. The reason for this was to create pieces of land that were the right size and shape for selling to prospective homeowners. However, before any sales can take place, that subdivision plan typically has to be reviewed and approved by an agency that oversees planning for that region. In many places, it must also be presented as an official legal document to be recorded at the local courthouse. Because of the need to create documentation of your layout, you must now address the appearance of the layout as well as the annotation needed to convey important information about it. In this chapter, you’ll study the use of parcel styles, parcel labels, and tables to effectively display and annotate your parcel layout.
In this chapter, you’ll learn to
- Apply parcel styles
- Apply parcel area labels
- Create parcel segment labels
- Edit parcel segment labels
- Create parcel tables
Applying Parcel Styles
Parcels can represent individually owned lots, public areas, road rights-of-way, easements, and so on. When different types of parcels are shown on the same plan, there must be some way of visually differentiating them. When using Civil 3D, this is best handled through parcel styles.
Using Parcel Styles to Control Appearance
Using a parcel style, you can control the appearance of the edges of the parcel as well as any hatching that is applied to the area. The hatching can be applied through the entire area or as a strip along the edges. Using these capabilities, you can graphically differentiate one type of parcel from another.
Exercise 13.1: Apply Parcel Styles
In this exercise, you’ll apply different styles to differentiate types of legal parcels. These include adjoiner parcels, rights-of-way, individual lots, open space lots, and easements.
- Open the drawing named
Applying Parcel Styles.dwglocated in theChapter 13class data folder.The drawing contains a complete parcel layout, and all the parcels have been assigned a style of Standard.

- Click the Standard : 3 label located near the center of the area containing the farm buildings. On the ribbon, click Parcel Properties.
- On the Information tab of the Parcel Properties dialog box, change Object Style to Adjoiner. Click OK.
The linetype of the parcel segments changes to a double-dashed pattern. Also, the label changes and now reads Adjoiner : 3.
- Press Esc to clear the previous selection. Click the Standard : 6 label located in the cul-de-sac of Madison Lane. Right-click, and select Properties.
- Using the Properties window, change Style to ROW. Press Esc to clear your selection.
The right-of-way area is now outlined by a dashed line and has been hatched with a dot pattern.
- Use either the Parcel Properties command or the Properties window to change the large parcels at the northeast and southeast corners of the site (Standard : 7 and Standard : 4) to a style of Open Space.
These parcels are now outlined in green and hatched with a green crossing pattern.
- Zoom in to the 90° bend on Jordan Court, and note the narrow Standard : 1 parcel located there.
- Change the style of the Standard : 1 parcel to Easement.
The area is hatched with a diagonal stripe pattern.
- Click one of the remaining parcels that is still labeled Standard, and change its style to Lot.
- Go to Prospector, and expand Sites ⇒ Lot Layout. Click Parcels to display all the parcels in the item view at the bottom of Prospector.
- Scroll to the right until you can see the Style column. Click the Style column heading to sort the parcels by style.
- Click the first parcel with a style of Standard. Then press and hold the Shift key, scroll down, and select the last parcel with a style of Standard.
- Right-click the Style column heading, and select Edit. In the Select Style dialog box, select Lot and click OK.
- Save and close the drawing.
You can view the results of successfully completing this exercise by opening Applying Parcel Styles - Complete.dwg.
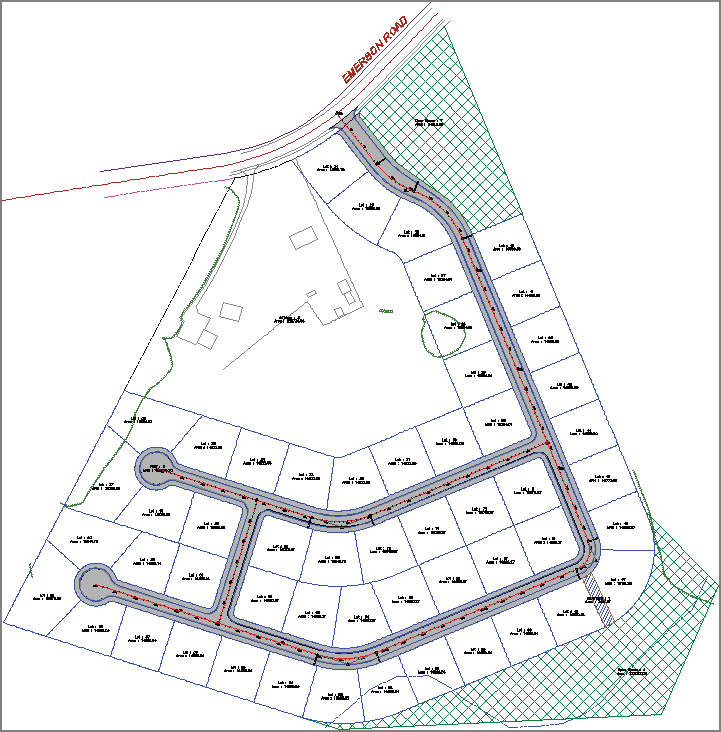
Figure 13-1: A view of the project after all the parcels have been assigned the appropriate styles
Applying Parcel Style Display Order
It’s quite common for adjacent parcels to share one or more segments. If the adjacent parcels have different styles assigned to them, you can control which style is used for the shared segments via the Site Parcel Properties dialog box. To access this dialog box, right-click Parcels in Prospector and select Properties. The Parcel Style Display Order list is displayed on the Composition tab, as shown in Figure 13-2. When two different styles are used for adjacent parcels, the style that is higher in this list is assigned to the shared segments. You can control the result for the shared segments by using the arrow keys, or by dragging and dropping the style names to change the order of the list.
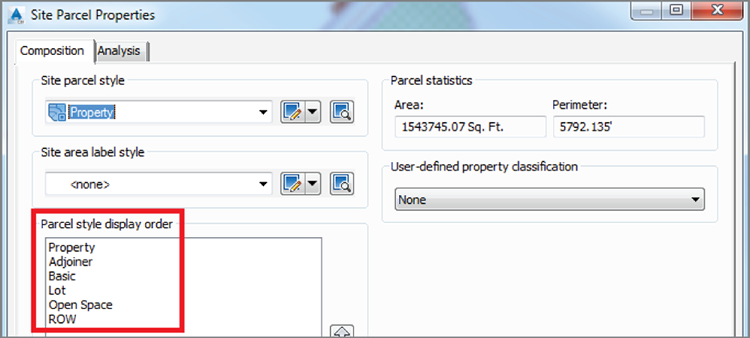
Figure 13-2: Parcel Style Display Order shown in the Site Parcel Properties dialog box
Typically you’ll want certain types of parcel line styles to always override others. For example, right-of-way lines are considered one of the most important boundaries in the drawing, so their style is often placed at the top of the list. As a result, the color and linetype of the right-of-way lines are uninterrupted throughout the drawing. On the other hand, the lot lines are considered one of the least important, so their styles are typically placed at the bottom of the list.
Exercise 13.2: Control Parcel Style Display Order
In this exercise, you’ll apply the Parcel Style Display Order function to control the display behavior when parcels of different styles share common segments.
- Open the drawing named
Applying Parcel Style Display Order.dwglocated in theChapter 13class data folder. - In Prospector, expand Sites ⇒ Lot Layout.
- Right-click Parcels, and select Properties.
- On the Composition tab of the Site Parcel Properties dialog box, click ROW under Parcel Style Display Order.
- Click the upward-pointing arrow icon three times, until ROW is at the top of the list. Click OK.

Lot : 23 is now bounded by a purple dashed line on the south and east sides and a blue dashed line on the north and west sides. The ROW parcel style is being displayed “on top of” the Lot style, as dictated by Parcel Style Display Order (see Figure 13-3).
- In Prospector, right-click Parcels and select Properties.
- Arrange the styles under Parcel Style Display Order as follows: ROW, Adjoiner, Open Space, Lot, Property, and Basic. Click OK.
- Zoom in to the drawing, and study the different areas where parcels of different styles are adjacent to one another.
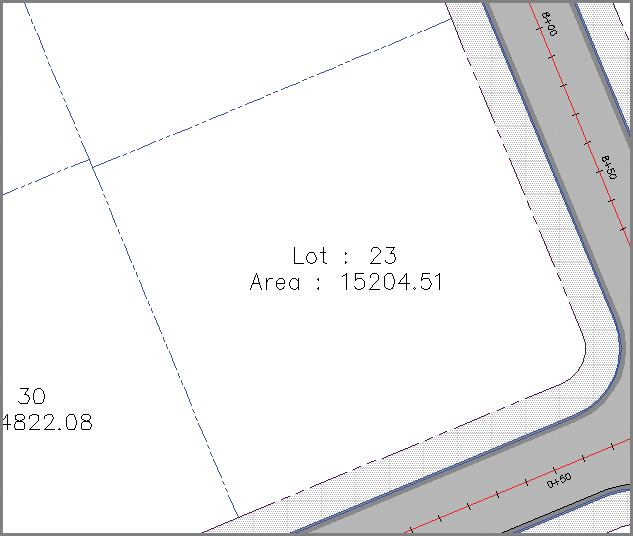
Figure 13-3: Parcel Style Display Order at work
- Save and close the drawing.
You can view the results of successfully completing this exercise by opening Applying Parcel Style Display Order - Complete.dwg.
Applying Parcel Area Labels
The labels you have seen at the center of each parcel are known as parcel area labels. They don’t have to contain information about the area of the parcel; however, they often do. You can create parcel area labels by using the Add Labels command as you have done before to create other labels. One unique capability of parcel area labels is that they can also be assigned through the Parcel Properties command. As with all other labels you have learned about, the appearance and content of parcel area labels are controlled by styles.
Exercise 13.3: Apply Parcel Area Labels
In this exercise, you’ll apply parcel area label styles in a number of ways. For adjoiner parcels, you’ll use them to display ownership information. For the ROW parcel, you’ll remove the area label because it isn’t needed. Finally, for individual lots, you’ll apply a style that shows only the lot number.
- Open the drawing named
Applying Parcel Area Labels.dwglocated in theChapter 13class data folder. - Click the Adjoiner : 3 label, and then click Parcel Properties on the ribbon.

- Click the Composition tab of the Parcel Properties dialog box. For Area Selection Label Style, select Existing Description And Area.
- Click the Information tab. In the Description box, enter JOHN SMITH on the first line and DBV 1234, PG 567 on the second line, as shown in Figure 13-4. Click OK, and press Esc to clear the selection.
The appearance and content of the label changes dramatically. This is a possible format for labeling a parcel that isn’t part of the main project but is adjacent or nearby. It includes the owner’s name plus the deed book and page where the official documentation of the parcel is recorded. Notice how this label style combines the hand-entered Description value along with the calculated area value.
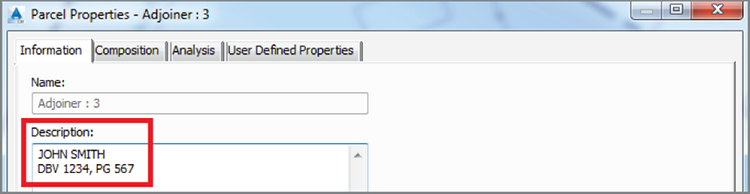
Figure 13-4: Entering a description for the Adjoiner : 3 parcel
- Click the ROW : 6 label located in the cul-de-sac at the end of Madison Lane, and then click Parcel Properties on the ribbon.

- On the Composition tab of the Parcel Properties dialog box, change Area Selection Label Style to <None>. Click OK. Press Esc to clear your selection.
- Click the parcel area labels for both open space parcels hatched in green. Right-click, and select Properties.
- Use the Properties window to change the Parcel Area Label Style value to Proposed Description And Area.
- Press Esc to clear the selection from the previous command. On the Annotate tab of the ribbon, click Add Labels.

- In the Add Labels dialog box, do the following:
- For Feature, select Parcel.
- For Label Type, select Replace Area.
- For Area Label Style, select Lot Number.
- Click Add.
- Click several parcels labeled Lot, and press Enter.
- Click one of the parcels, and then click Multiple Parcel Properties on the ribbon.

- When prompted for a start point, pick a point in one of the parcels with the original Lot label style. Then click several more points to create a line through several parcels with the same label style. Press Enter when you have finished selecting points.
- Press Enter again when prompted for a start point.
- In the Edit Parcel Properties dialog box, set Area Selection Label Style to Lot Number.
- Click the diskette icon to the right of Lot Number.

- Click Yes to apply the change. You should see the area label styles immediately change for the parcels you selected.
- Click OK to dismiss the Edit Parcel Properties dialog. Repeat steps 12–17 until all the Lot parcels have the Lot Number area label style.
- Save and close the drawing.
You can view the results of successfully completing this exercise by opening Applying Parcel Area Labels - Complete.dwg.
Creating Parcel Segment Labels
The most common use of parcel segment labels is to provide numerical information that defines the geometry of property boundaries. This numerical information appears as bearings and distances for line segments and curve data for curve segments. When an adequate numerical description of a parcel is provided, the parcel can be re-created either on paper or in the field.
To add labels to parcel segments, you use the Add Labels command. You can label the segments one by one, or you can provide labels for all the segments that make up a parcel.
Exercise 13.4: Label Parcel Segments
In this exercise, you’ll use parcel segment labels to provide bearings, distances, and curve data in your drawing.
- Open the drawing named
Creating Parcel Segment Labels.dwglocated in theChapter 13class data folder. - Zoom in to lots 32 and 33 near the center of the project.
- On the Annotate tab of the ribbon, click Add Labels.

- In the Add Labels dialog box, select Parcel as the feature. Click Add.
- Click the north side of lot 33.
- Click the east and west sides of lot 33.
- Pan south to lot 69, and click the curve that makes up the south boundary of the lot.
A curve label is created that displays the delta, length, and radius.
- In the Add Labels dialog box, select Multiple Segment as the label type, and then click Add.
- Click the parcel area label for lot 32. When you’re prompted to select a direction, press Enter to accept the default direction of clockwise.
- Save and close the drawing.
You can view the results of successfully completing this exercise by opening
Creating Parcel Segment Labels - Complete.dwg.
Editing Parcel Segment Labels
Once you have placed parcel segment labels in the drawing, you usually need to do some work to change their position, style, orientation, and whatever else is necessary to create a readable, professional-looking legal document. Fortunately, Civil 3D provides a number of ways for you to do this.
Applying Segment Label Styles
You can use parcel segment label styles to change the appearance, content, and behavior of the segment labels. For example, when labeling an existing property line, you could assign a different style that displays the bearing and distance text slanted—a common practice for differentiating text that refers to existing features. In another part of the drawing, you might assign a different style to a curve label so that the appropriate combination of dimensions is shown according to local requirements.
Exercise 13.5: Apply Parcel Segment Label Styles
In this exercise, you’ll apply different parcel segment label styles to differentiate between different types of labels and to control the content that is shown for each label.
- Open the drawing named
Applying Parcel Segment Label Styles.dwglocated in theChapter 13class data folder. - Zoom in to the bearing and distance labels along the west side of the project.
Currently, these labels are all shown in a proposed style with both bearing and distance.
- Click the label for the west side of the John Smith property, and then click Label Properties on the ribbon.

- In the Properties window, change Line Label Style to (Span) Bearing And Distance With Crows Feet [Existing].
The color and text style of the label are changed, and the label now reflects the full length of the line.
- On the Annotate tab of the ribbon, click Add Labels.

- In the Add Labels dialog box, do the following:
- For Feature, select Parcel.
- For Label Type, select Single Segment.
- c. For Line Label Style, select Distance [Existing].
- Click Add.
- Click the west side of the John Smith property. A new label is created that reflects the distance associated with just the John Smith property, not the overall distance.
- Close the Add Labels dialog box, and press Esc to end the command. Pan to the south to view the labels for lots 36, 37, 60, and 59.
- Click these four labels, and then click Label Properties on the ribbon.

- In the Properties window, change Line Label Style to Distance.
- Save and close the drawing.
You can view the results of successfully completing this exercise by opening Applying Parcel Segment Label Styles - Complete.dwg.
Editing Parcel Segment Labels Graphically
You can use a number of methods to graphically edit parcel segment labels. The labels are equipped with special grips that enable you to move them easily. You can also capitalize on their built-in dragged state in areas where there isn’t enough room for the label to be placed right on the line or curve. In addition, you can flip labels to change which side of a line or curve they are placed on, and you can reverse labels to change a NE bearing to SW and vice versa.
Exercise 13.6: Edit Parcel Segment Labels Graphically
In this exercise, you’ll employ several graphical editing techniques on parcel segment labels in your drawing. These include grip-editing, flipping, and reversing labels as well as moving them to initiate their dragged state.
- Open the drawing named
Editing Labels Graphically.dwglocated in theChapter 13class data folder. The drawing is zoomed in to lot 68. - Click the label on the west side of lot 68, and then click Label Properties on the ribbon.

- In the Properties window, change Line Label Style to Bearing. Close the Properties window.
- With the label still selected, click Flip Label on the ribbon.

- Click the diamond-shaped grip of the label, and slide it south to the line that is shared between lots 68 and 62.
This bearing now serves both lots. Notice that this is a NE bearing, whereas those to the east are SW bearings.
- With the label still selected, click Reverse Label on the ribbon. The bearing now reflects a SW orientation.

- Press Esc to clear your current selection. Then repeat steps 2 through 4 for the label on the west side of lot 62 using a label style of Distance.
- Use the Add Labels command to add a new distance label to the west side of lot 68. Don’t forget to flip the label so that it’s shown on the inside of the lot.
- Click the curve label at the northwest corner of lot 68. Click the square grip, and drag it to the south and east. Place it in the open space between the lot 68 area label and the northwest corner of the lot.
The label is reoriented, and a leader appears that points back to the curve (see Figure 13-5).
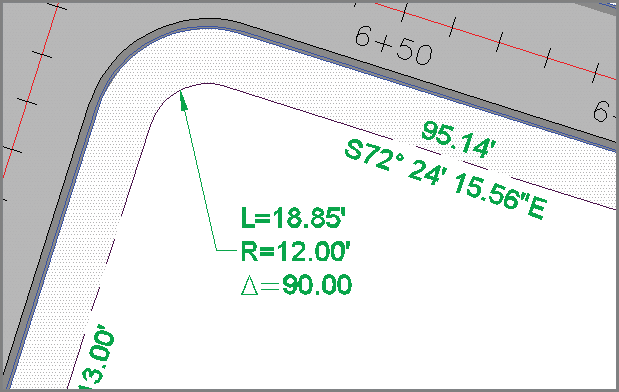
Figure 13-5: A curve label that has been dragged away from the curve to reveal its dragged state
- Continue moving, flipping, and reversing labels to improve the readability of the drawing and remove redundant bearings. Assign new styles where applicable.
- Save and close the drawing.
You can view the results of successfully completing this exercise by opening Editing Labels Graphically - Complete.dwg.
Creating Parcel Tables
As you can guess, property drawings can become cluttered with many labels for areas, bearings, distances, and curve dimensions. As the drawing becomes more complex, it might make sense to put all that information in a table instead of trying to place it directly on the lines and curves. Line labels can be replaced with tags such as L1, L2, and so on, and the same can be done for curves. These abbreviated labels take up much less space than the full bearing and distance labels, making the drawing appear less cluttered and easier to read. Of course, the trade-off is that now the person viewing the drawing will have to scan back and forth between the drawing and the table to obtain all the information that pertains to a given parcel. This is why not all drawings use tables to store parcel information. A drawing can be read more easily, and information obtained from it more efficiently, if the labels are placed directly on the lines and curves. However, for some drawings you simply can’t show the information directly on the lines and curves, and you must use a table.
Creating Area Tables
You can use area tables to display information about each parcel in the drawing. Depending on the table style you use, you can vary the amount of information as well as the formatting.
One thing you’ll probably need to do prior to creating an area table is renumber the lots. You do this by using the Renumber/Rename command on the ribbon.
Exercise 13.7 Create an Area Table
In this exercise, you’ll first renumber the lots in the drawing. Then you’ll create an area table that shows the lot number and corresponding area for each lot parcel.
- Open the drawing named
Creating An Area Table.dwglocated in theChapter 13class data folder. - Click one of the lot number labels, and then click Renumber/Rename on the ribbon.

- In the Renumber/Rename Parcels dialog box, check the box next to Use Name Template In Parcel Style. Click OK.
- When you’re prompted to specify a start point, click near the center of lot 24. Then, to select the parcels in the correct order, draw the line segments indicated by the red arrows in Figure 13-6.
- Press Enter twice to end the command and update the numbers. The numbers should now start at 1 and end at 40 along the same path you selected.
- Press Esc to clear the previous selection. Zoom to the lots in the center of the project. Select one of the lot labels, and then click Renumber/Rename on the ribbon.

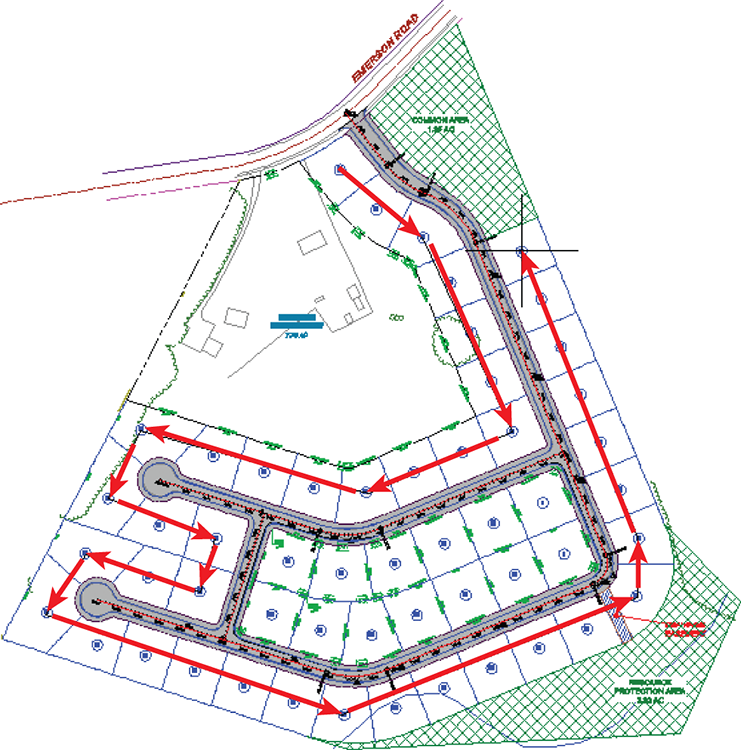
Figure 13-6: Selecting parcels in the order they are to be renumbered
- In the Renumber/Rename Parcels dialog box, check the box next to Use Name Template In Parcel Style. Click OK.
- Draw lines through the parcels as you did before, beginning at lot 68, drawing in a clockwise fashion and ending at lot 62. Press Enter twice to end the command.
- Press Esc to clear the previous selection. Click one of the lot labels, and then click Add Tables ⇒ Add Area on the ribbon.

- In the Table Creation dialog box, do the following:
- For Table Style, select Area Only.
- Under Select By Label Or Style, check the box in the Apply column that is across from Lot Number.
- Click OK.
- Click a point in an open area of the drawing to insert the tables.
- Save and close the drawing.
You can view the results of successfully completing this exercise by opening
Creating an Area Table - Complete.dwg.
Creating Parcel Segment Tables
The process of creating parcel segment tables is similar to the way you create area tables. You can select the segments that are listed in the table based on their label style or select each segment individually. When a segment is listed in the table, its label is transformed into a tag that simply assigns a number to the segment. Usually, you’ll want to renumber these tags to follow a sequential order that matches how they are laid out in the drawing. You can do this using the Renumber Tags command on the ribbon.
You can create three types of segment tables: line, curve, and segment. The last type (segment) is simply a combination of line and curve data in the same table.
Exercise 13.8: Create a Parcel Segment Table
In this exercise, you’ll create a parcel segment table that will contain curve tag numbers and corresponding curve geometry information. This will improve the appearance and clarity of the drawing by taking crowded curve labels and moving their information to a neat, organized table.
- Open the drawing named
Creating A Segment Table.dwglocated in theChapter 13class data folder. - On the Annotate tab of the ribbon, click Add Tables ⇒ Parcel ⇒ Add Curve.

- In the Table Creation dialog box, do the following:
- For Table Style, verify that Length Radius & Delta is selected.
- Under Label Style Name, scroll down and check the box in the Apply column across from Parcel Curve: Delta Over Length And Radius.
- Click OK.
- Pick a point in an open area of the drawing to insert the table.
- Click the curve label at the northwest corner of lot 41, and click the circular grip to reset the label and place it back on the curve.
- With the label still selected, click Renumber Tags on the ribbon. The label now reads C1.

- Continue working in a clockwise direction, clicking curve labels and then clicking the Renumber Tags command until all the tags have been renumbered.
- On the Annotate tab of the ribbon, click Add Labels.

- In the Add Labels dialog box, select Parcel as the feature and select Multiple Segment as the label type. Click Add.
- Click the lot 17 label, and press Enter to accept the default direction of clockwise. Do the same for the lot 18 label. New line and curve labels are placed in the drawing.
- Renumber the new curve tags so they continue the numbering sequence.
- Click the curve table, and then click Add Items on the ribbon. In the Add Selection dialog box, check the box across from Parcel Curve: Delta Over Length And Radius. Click OK.

- Pan over to the table, and note that the information was automatically added (see Figure 13-7).
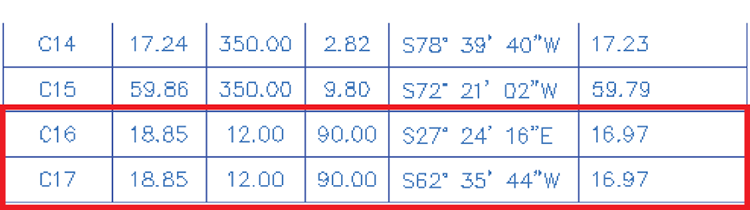
Figure 13-7: New lines added to a curve table
- Save and close the drawing.
You can view the results of successfully completing this exercise by opening Creating a Segment Table - Complete.dwg.