Part II
Pitfalls and Sources of Error
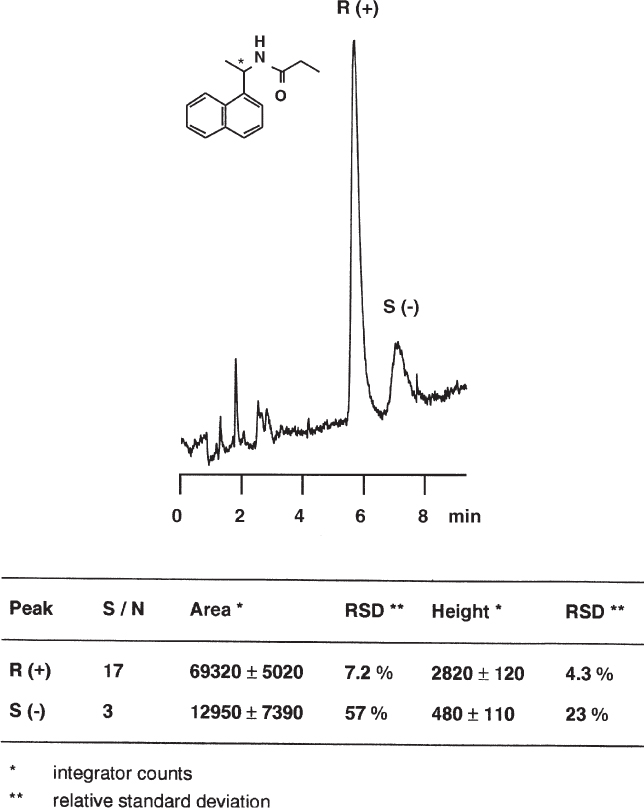
2.1 Mixing of the Mobile Phase
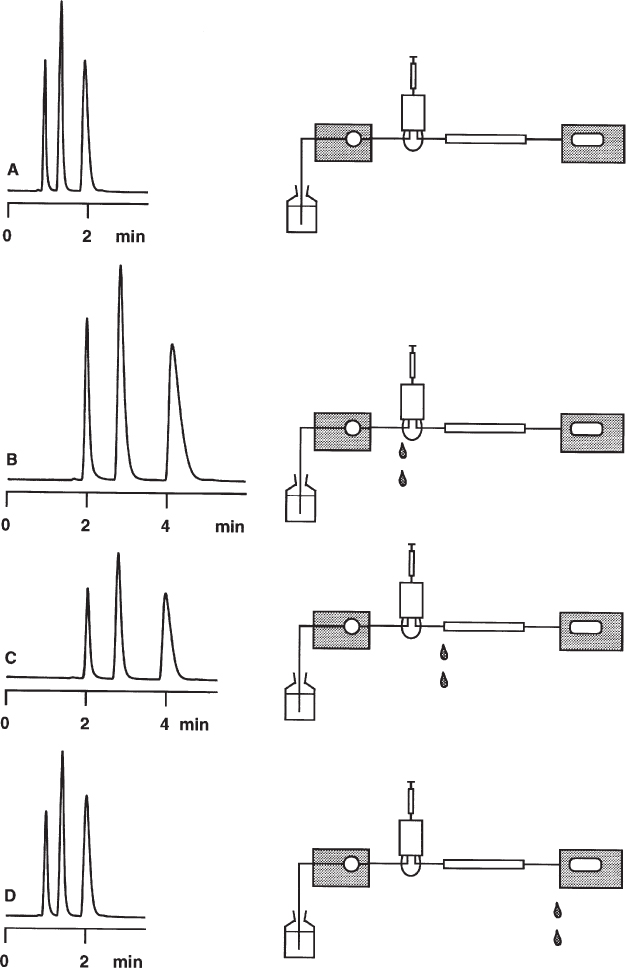
The usual mobile phases used for reversed-phase HPLC sustain a volume contraction when mixed; i.e. the volume of the mixture is smaller than the sum of the volumes of the components. This effect is most pronounced for mixtures of water and methanol (water and acetonitrile or water and tetrahydrofuran are less critical). Different compositions are obtained when the components are measured individually and mixed and when one of the components is poured into a measuring flask and topped with the other. The different mixing ratio then gives rise to mobile phases of different strength, and thus to different retention times.
Here four different methods for the preparation of the mobile phase are compared. They give markedly different retention times.
| A: |
To 400 mL of water methanol was added to give 1 L. Too much methanol! |
| B: |
400 mL of water and 600 mL of methanol were measured individually and mixed. Accurate. |
| C: |
In a HPLC system with high pressure gradient (two pumps and mixing chamber) 0.4 mL min−1 of water and 0.6 mL min−1 of methanol were pumped. The actual flow rate is less than 1 mL min−1; t0 and tR increase. |
| D: |
To 600 mL of methanol water was added to give 1 L. Too much water! |
Chromatographic Conditions
|
Sample: |
explosives dissolved in acetone (octogen, hexogen, tetryl, trinitrotoluene, nitropenta); the first small peak is from acetone |
|
Column: |
4.6 mm × 25 cm |
|
Stationary phase: |
Grom-Sil 80 ODS-7 PH, 4 µm (reversed phase C18) |
|
Mobile phase: |
water/methanol 4 : 6, 1 mL min−1 |
|
Detector: |
UV 220 nm |
|
Reference: V.R. Meyer |
2.2 Mobile Phase pH
Usually it is recommended to control mobile phase pH whenever ionic or ionizable compounds are to be separated. To this end pure water as the polar component of the mobile phase is replaced by buffer. Rugged conditions ( → 1.14) can be expected if the pH is separated by at least one unit from the pKS of the compound of interest. In principle, although this is not obligatory, non-dissolved species are preferred. For complex mixtures it can be difficult to find the optimum pH.
The separation of nicotine and salicylic acid is not rugged around pH 6; it would be better to work at pH 5 or 7. At pH 5.65 nicotine is eluted in front of salicylic acid, at pH 6.05 the elution order has reversed, and at pH 5.85 the two compounds merge to a single peak. The pKS1 of nicotine is 6.16 (15 °C), the pKS of salicylic acid is 2.96 (25 °C). If 67 mM citrate buffer is used (19.6 g L−1 of trisodiumcitrate dihydrate) the addition of 2.2 mL L−1 of 25% hydrochloric acid gives pH 6.05, 3 mL L−1 gives pH 5.85, and 4 mL L−1 gives pH 5.65. Needless to say, such differences in buffer preparation are quite large but errors of this kind can happen when work is performed carelessly.
Note that the nicotine peak has strong tailing if a conventional, not base-deactivated, stationary phase is used.
Chromatographic Conditions
|
Sample: |
nicotine and salicylic acid |
|
Column: |
4.0 mm × 25 cm |
|
Stationary phase: |
LiChrospher 60 RP-Select B, 5 µm (reversed phase C8) |
|
Mobile phase: |
67 mM citrate buffer pH 5.65, 5.85 or 6.05/methanol 6:4, 1.5 mL min−1 |
|
Detector: |
UV 240 nm |
|
Reference: V.R. Meyer |
2.3 Adjustment of Mobile Phase pH
For the preparation of many aqueous mobile phases not only is the pH prescribed but so also is the addition of extra components such as neutral salts (this example), solubility enhancers, ion pair reagents, or organic solvents. At which stage of the preparation should the pH be adjusted? It is possible that the separation will be markedly influenced by this decision.
For the separation of α-chymotrypsinogen, cytochrome C, and lysozyme on a strong cation exchanger a citrate buffer of pH 4.9 is used; the compounds are eluted by increasing ionic strength, i.e. by a gradient from 0 to 0.5 M sodium chloride. Therefore mobile phase B is also 1 M in neutral salt, and the separation is complete at 50% B.
For the upper chromatogram the pH of eluent B was adjusted after addition of the sodium chloride; because of the ionic equilibria of all the species involved the pH drops slightly from 4.9 to 4.8 during the gradient. For the lower separation the sodium chloride was added to one part of the buffer stock solution without extra pH adjustment. Now cytochrome C and lysozyme are no longer separated and the pH drops from 4.9 to 4.5.
The second method cannot be used for this separation and it does not meet scientific standards. (Although not ‘scientific’, it is not forbidden to lazy people to use this approach but it is obvious that totally new method development would be necessary.) The first method is correct and recommended, yet less convenient. In any case it is necessary to describe mobile phase preparation in detail ( → 3.11, 3.13).
Chromatographic Conditions
|
Sample: |
0.5 mL solution with α-chymotrypsinogen, cytochrome |
|
|
C and lysozyme |
|
Column: |
10 mm × 10 cm |
|
Stationary phase: |
Mono S HR, 10 µm (strong cation exchanger) |
|
Mobile phase: |
20 mM trisodium citrate pH 4.9 with linear gradient from 0 to 0.5 mM sodium chloride (corresponding to 50% B) in 40 min, 4 mL min−1 |
|
Detector: |
UV 280 nm |
|
Reference: G. Malmquist, Pharmacia Biotech AB, Uppsala, Sweden, poster at the 20th International Symposium on Column Liquid Chromatography, San Francisco, 1996 |
2.4 Influence of the Acid Type and Concentration in the Eluent
If ionized or ionizable analytes are present in the sample, it is often necessary to work with a mobile phase of well-defined pH. A rugged pH can only be obtained by a buffer (acid or base and corresponding salt) of high enough capacity. However, there are also separations which can be performed with just adding some acid or base alone. In such a case the preparation of the mobile phase is much simpler, but one should be aware of the fact that this approach does not guarantee a stable pH.
It may be observed that not only the concentration of the acid influences the separation but also the type of acid, as in the example shown here. The resolution pattern, especially of the late eluted impurity peaks, differs markedly under these various conditions, with both mineral and organic acids (perchloric, phosphoric, hydrochloric, trifluoroacetic, formic, and acetic acid).
Similar variability of the separation pattern may also be observed when different types of buffers (of identical pH) are used for the preparation of the mobile phase.
Chromatographic Conditions
|
Sample: |
active pharmaceutical ingredient and its impurities |
|
Column: |
4.6 mm × 15 cm |
|
Stationary phase: |
HALO fused core C18, 2.7 µm (reversed phase C18) |
|
Mobile phase: |
A: water with 0.05, 0.1 or 0.2 % of different acids |
|
|
B: acetonitrile |
|
Gradient: |
40-60 % B from 0 to 13 min, 60-98 % B from 13 to 25 min, hold for 5 min, 1.2 mL min−1 |
|
Temperature: |
40 °C |
|
Detector: |
UV 220 nm |
|
Reference: F. Bernardoni, P. Sajonz, J. Zang, C. Lee, S. Marcinko, A. Abrahim and R. Helmy: Chromatographia 70 (2009) 1561 |
2.5 Water as an Unintentional Additive in the Mobile Phase
In normal-phase separations, the mobile phase is of low polarity. Under certain circumstances, even traces of water in the eluent will influence the separation. This effect is probably more pronounced on silica or silica-based (and not fully end-capped) stationary phases than on others. It can be beneficial as in the example shown here.
The chiral compound flavanone can convert to 2′-hydroxychalcone, therefore a method is needed which can separate all three analytes. The stationary phase is Chiralcel OD, the mobile one consists of 10% isopropanol in heptane. With a fresh bottle of HPLC-quality isopropanol, the peaks of the reaction product and of the (S) enantiomer elute at the same time by chance. If 250 ppm or more of water is added to the mobile phase, the peaks are resolved well. The same effect is observed if the amount of water in the eluent bottle reaches this level after it was in use over months and was in contact with the laboratory atmosphere. This latter case – old eluent vs. freshly prepared one – is shown in the figure.
Chromatographic Conditions
|
Sample: |
(R,S)-flavanone and 2′-hydroxychalcone |
|
Column: |
4.6 mm × 25 cm |
|
Stationary phase: |
Chiralcel OD, 10 µm (cellulose tris (3,5-dimethylphenyl-carbamate)) |
|
Mobile phase: |
n-heptane/isopropanol 90 : 10 with ≈ 1000 ppm water (top) or anhydrous (bottom), 1 mL min−1 |
|
Temperature: |
20 °C |
|
Detector: |
UV 254 nm |
|
Reference: L. Hintermann: J. Org. Chem. 72 (2007) 9790 |
2.6 Inadequate Purity of Mobile Phase Water
For most HPLC analyses, deionized water is not suitable as a component of the mobile phase because it may contain traces of impurities. A dedicated water purification system does a much better job. Another possibility is the purchase of extra-pure HPLC water. Different qualities are available, such as “HPLC Grade” or “HPLC/MS Grade”. The first one will guarantee an excellent transparency in low UV, the second one also the absence of extra peaks with MS detection, besides other quality parameters (non-volatile impurities, fluorescence properties etc.). Usually the disturbing extra peaks appear only during gradient separations, therefore a blank gradient chromatogram shows if the selected water quality is suitable. However, the source of extra peaks can also originate from the B (organic) solvent ( → 2.7). Note that impurities in water can be concentrated at the top of the column during rinsing or equilibration steps with low or no organic amount in the mobile phase. They will be eluted during the subsequent gradient run.
For MS detection, the water quality obtained with a water purification system, here Milli-Q®, or an “HPLC water” grade may not be pure enough. In such a case it is necessary to buy water especially designed for LC-MS applications.
Chromatographic Conditions
|
Sample: |
none (dummy gradients) |
|
Column: |
2 mm × 15 cm |
|
Stationary phase: |
Jupiter C4, 5 µm (reversed phase C4) |
|
Mobile phase: |
A: different qualities of water |
|
|
B: acetonitrile |
|
Gradient: |
from 0 to 50% B within 30 min, 100% B for 2 min, re-equilibration with 100% A for 10 min, 0.2 mL min−1 |
|
Detector: |
MS, TIC mode |
|
Reference: H.M.D.R. Herath, P.N. Shaw, P. Cabot and A.K. Hewavitharana: |
|
|
Rapid Comm. Mass Spectrom. 24 (2010) 1502 |
|
|
See also: J.B. Reust and V.R. Meyer: Analyst 107 (1982) 673 |
2.7 Inadequate Purity of a Mobile Phase Solvent
All common solvents for liquid chromatography can be bought in so-called HPLC qualities with specified polarity, UV transparency, and purity. In some cases special “gradient grade” solvents are available. They are more expensive than many other qualities but may well be worth the extra money.
One of the problematic solvents is tetrahydrofuran because of its tendency to form peroxides. A common inhibitor is BHT (butyl-hydroxy-toluene, 2,6-di-tert-butyl-4-methylphenol). This additive is unwanted for HPLC separations because it appears as a distinct peak in gradient separations.
The quality of commercially available THF, with or without inhibitor, can differ between brands and between batches. This fact may be of minor interest for isocratic separations but with gradients the situation can be unsatisfactory. With poor quality THF, which may nevertheless fulfill the written specifications, ghost peaks will appear during a gradient, even if the amount of THF in the eluent is low.
Chromatographic Conditions
|
Sample: |
none (dummy gradients) |
|
Column: |
4.6 mm × 15 cm |
|
Stationary phase: |
Zorbax SB-C18, 3.5 µm (reversed phase C18) |
|
Mobile phase: |
A: water with 0.1% formic acid |
|
|
B: methanol with 0.1% formic acid |
|
|
C: BHT-free THF with 0.1% formic acid |
|
Gradient: |
from 10 to 95% B within 15 min with a constant amount of 5% C, 1.5 mL min−1 |
|
Temperature: |
40 °C |
|
Detector: |
UV 265 nm |
|
Reference: S. Williams: J. Chromatogr. A 1052 (2004) 1 |
2.8 Inadequate Purity of a Mobile Phase Reagent
All constituents of the mobile phase need to be of such high quality that no extra peaks appear in the chromatogram; with gradient separations, the baseline drift should be negligible. Sometimes this goal is difficult to reach. The usual HPLC solvents are available in adequate purity from many suppliers but it can be critical to find buffer salts, ion pair reagents, and other additives of proper quality. In cases of a detector-active, e.g. UV-absorbing, mobile phase, system peaks can occur ( → 2.10). Isocratic separations are less prone to interferences than gradient separations; during gradients impurities can be concentrated in the column and later a mobile phase of appropriate composition might elute them as peaks.
The illustration shows dummy gradients (without sample injection) of a separation which was run with ion pair reagents. Three different qualities of sodium dodecyl sulfate did not match purity requirements and gave large extra peaks and baseline disturbances. Fortunately a sodium octane sulfonate could be found which yielded a disturbance-free chromatogram with the exception of a single small peak.
Chromatographic Conditions
|
Sample: |
none (dummy gradients) |
|
Column: |
4.6 mm × 15 cm |
|
Stationary phase: |
Supelcosil LC 18-DB, 5 µm (reversed phase C18) |
|
Mobile phase: |
A: 12 mM ion pair reagent as indicated, 3 mL L−1 triethylamine, pH 2.5 with phosphoric acid |
|
|
B: methanol/acetonitrile 82 : 18 |
|
Gradient: |
35% B for 5 min, 35–80% B from 5 to 20 min, 80% B from 20 to 23 min, 80–95% B from 23 to 25 min, then 95% B; 1 mL min−1 |
|
Detector: |
UV 280 nm |
|
Reference: J.D. Stafford and B.A. Olsen, Eli Lilly and Company, Lafayette, IN, USA |
2.9 Incomplete Degassing
Injected air may appear in the chromatogram as a retained peak with truly “chromatographic” shape ( → 2.23). Another type of air peaks comes from incomplete degassing of the mobile phase. If the eluent is degassed by continuous sparging with helium, the problem should not show up. However, if one tries to degas by vacuum filtration only, this procedure may not be of high efficiency and air will remain in the solvent. During a gradient, the solubility of the gases in the mobile phase alters. It can be lowest at a 1:1 mixture of water and organic component. As a consequence, a peak of “non-chromatographic”, triangular shape may appear; it has a vertical front and an oblique backside.
Outgassing at the end of the column can be prevented by installing a backpressure regulator at the detector outlet (but check the maximum pressure limit of its cell before doing so!).
Chromatographic Conditions
|
Sample: |
none |
|
Column: |
4.6 mm × 15 cm |
|
Stationary phase: |
Zorbax XDB C8, 5 µm (reversed phase C8) |
|
Mobile phase: |
A: water/methanol 90 : 10 with 0.1% formic acid |
|
|
B: methanol with 0.1% formic acid |
|
Gradient: |
from 55 to 95% B within 18 min, 1.5 mL min−1 |
|
Temperature: |
25 °C |
|
Detector: |
UV 265 nm |
|
Reference: S. Williams: J. Chromatogr. A 1052 (2004) 1 |
|
For another example see: J.W. Dolan, LC GC Int. 5 (1992) 22 or LC GC Mag. 10 (1992) 294 |
2.10 System Peaks and Quantitative Analysis
With detector-active mobile phases system peaks commonly appear in the chromatogram. “Detector-active” means that the mobile phase itself gives rise to a detector signal; with a UV detector, the eluent absorbs at the chosen wavelength. System peaks are additional peaks in the chromatogram which appear at a particular retention time (in contrast to ghost peaks, which have random retention times). They do not belong to a sample compound but are characteristic of a mobile phase component.
System peaks are unwanted because any additional peaks increase the difficulty of the separation. They are, moreover, the reason for another unwanted effect, as can be seen in the figure. The peak areas of the regular peaks do not only depend on the mass of sample injected but also on their position relative to the system peaks.
The separation of racemic bupivacaine on a chiral stationary phase was detected at 215 nm. At this low wavelength the mobile phase used has some UV absorption, coming maybe from isopropanol or from buffer reagents of inadequate quality. Two system peaks are observed, one with a negative signal. Because a racemate was injected the peak areas of both enantiomers should be identical but obviously this is not so. If a proper calibration curve has previously been established it will be possible to obtain the accurate analytical result; otherwise the ratio of enantiomers calculated by the integrator will be wrong.
Chromatographic Conditions
|
Sample: |
racemic bupivacaine |
|
Stationary phase: |
EnantioPac, 10 µm |
|
|
(α1-acid glycoprotein, chiral phase) |
|
Mobile phase: |
phosphate buffer pH 7.2/2-propanol 92 : 8 |
|
Detector: |
UV 215 nm |
|
Reference: G. Schill and J. Crommen, TrAC 6 (1987) 111 |
2.11 Sample Preparation with Solid Phase Extraction
The steps involved in sample preparation can be the source of numerous errors. The problem shown here is only a single example of how a chromatogram can be influenced drastically by a deviation from the recommended procedure.
For the isolation of tricyclic antidepressants a solid phase extraction step was necessary. The cartridge was wetted with 1 mL methanol followed by 1 mL water. After application of 1 mL sample solution and a washing step with 1 mL 5% methanol in water the antidepressants were eluted with 1 mL methanol. The solvent was evaporated and the residue dissolved in 200 µL phosphate buffer/methanol 80 : 20. This correct procedure gives the upper chromatogram.
If, however, a solution of 2% phosphoric acid in methanol was used for elution from the cartridge the acid was concentrated during evaporation, and therefore the drugs became protonated and the final sample solution was ca. 10% in phosphoric acid. Thus the retention times of the tricyclic antidepressants are shorter and the peaks are distorted as seen in the lower chromatogram.
Chromatographic Conditions
|
Sample: |
20 µL solution with tricyclic antidepressants (nordoxepin, nortriptyline, doxepin, amitriptyline) |
|
Column: |
3.9 mm × 15 cm |
|
Stationary phase: |
Symmetry C18, 5 µm (reversed phase C18) |
|
Mobile phase: |
20 mM phosphate buffer pH 7/methanol 32 : 68, 1 mL min−1 |
|
Temperature: |
35 °C |
|
Detector: |
UV 254 nm |
|
Reference: Y. F. Cheng, Waters, Milford, MA, USA |
2.12 Inadequate Stabilization of the Extraction Solvent
Although chloroform is a toxic solvent, it is still used for the extraction of anthracyclines from biological samples. In the presence of oxygen, chloroform reacts to phosgene CO(Cl)2 which can be prevented by the addition of a stabilizer. Besides non-stabilized grades, the market also offers ethanol- or amylene-stabilized chloroform. Ethanol is more efficient than amylene because it reacts with phosgene to ethyl chloroformate Cl–CO–O–C2H5.
On the other hand, phosgene attacks amines and converts them to carbamoyl chlorides R–NH–CO–Cl or (R1,R2)–N–CO–Cl. If non- or poorly stabilized chloroform is used for the preparation of anthracycline samples, phosgene will react with the analytes because they contain an amino group. In the example shown here, the anthracyclines were extracted with chloroform stabilized with ethanol (top) or with amylene (bottom). Since amylene is a poor stabilizer, the latter solvent contained traces of phosgene which decreased the concentration of the anthracyclines and produced a number of additional peaks.
Chromatographic Conditions
|
Sample: |
anthracyclines and metabolites, extracted at pH 9.0 with chloroform stabilized with ethanol or amylene |
|
Column: |
4.6 mm × 15 cm and guard column 4 mm × 4 mm |
|
Stationary phase: |
Merck Purospher Star RP-18, 5 µm (reversed phase C18) |
|
Mobile phase: |
water/acetonitrile with 0.1% formic acid, 1.0 mL min−1, gradient |
|
Temperature: |
30 °C |
|
Detector: |
fluorescence 480/555 nm |
|
1 = 13-S-dihydrodoxorubicin, 2 = 13-S-dihydroepirubicin, 3 = doxorubicin, 4 = epirubicin, 5 = daunorubicin, 6 = idarubicin |
|
Reference: K.E. Maudens, S.M.R. Wille, W.E. Lambert: J. Chromatogr. B 848 (2007) 384 |
2.13 Poor Choice of Sample Solvent: Peak Distortion
Samples for HPLC analysis usually need to be dissolved in a suitable solvent, either to furnish a solution for analysis or to obtain a convenient dilution. The best general recommendation is to dissolve the sample in the mobile phase itself; this protects against unwanted phenomena such as precipitation within the column, excessive band broadening, or unusual peak shapes. With gradient separations the sample solvent should correspond to the mobile phase composition at the time of injection. One exception, however, is usually allowed: the solvent may be weaker than the mobile phase. For reversed-phase chromatography this means more water, for normal-phase chromatography, more hexane, than is present in the mobile phase. This trick can even be used to concentrate the samples at the column entrance, thus making the peaks narrower.
The example shows the analysis of phenylalanine, which needed a very weak mobile phase containing only 8% acetonitrile. Dissolving the sample in pure water resulted in a satisfactory peak shape. When the acetonitrile content of the sample solution was higher than that of the mobile phase, peak broadening and even very strange distortion of the phenylalanine peak were observed. The reasons for these phenomena are the differences in viscosity or elution strength between sample solvent and mobile phase or a combination of both effects.
Chromatographic Conditions
|
Sample: |
phenylalanine, 20 µL with 0.9 µg of Phe dissolved in various mixtures of water and acetonitrile |
|
Column: |
4.6 mm × 25 cm |
|
Stationary phase: |
ODS, 5 µm (reversed phase C18) |
|
Mobile phase: |
5 mM phosphate buffer pH 3.5/acetonitrile 92 : 8, 1 mL min−1 |
|
Detector: |
UV 210 nm |
|
Reference: N. E. Hoffman, S. L. Pan and A. M. Rustum: J. Chromatogr. 465 (1989) 189 |
|
See also: S. Keunchkarian : J. Chromatogr. A 1119 (2006) 20 |
2.14 Poor Choice of Sample Solvent: Tailing
Although an inappropriate sample solvent does not necessarily result in severe peak distortion ( → 2.13), more subtle impairment of peak shape is also unwanted. During analysis of fat-soluble vitamins, tailing was observed at the very bottom of the peaks if the sample was dissolved in methanol instead of mobile phase. This is surprising because the eluent was almost pure organic solvent with a water content of only ca. 1%.
Tailing is always unwanted because it reduces peak height, impedes the detection of trace components, reduces the resolution of adjacent peaks ( → 2.56) and, as the worst effect, makes peak integration more difficult. The integrator, with its programmed algorithms, has more difficulty defining the end of the peak as tailing increases; accurate integration can be impossible. With a data system the peak start and end can be manipulated subsequently but, especially for the circled peak in the upper chromatogram, it is difficult for man or computer to define the peak end.
Chromatographic Conditions
|
Sample: |
uracil (as breakthrough marker), vitamin A, vitamin D3 and vitamin E, dissolved in methanol or in mobile phase |
|
Column: |
3.9 mm × 15 cm and precolumn 3.9 mm × 2 cm |
|
Stationary phase: |
Symmetry C8, 5 µm (reversed phase C8) |
|
Mobile phase: |
water/methanol/acetonitrile 1 : 25 : 25, 1 mL min−1 |
|
Detector: |
UV 280 nm |
|
Reference: U. D. Neue, D.J. Phillips, T. H. Walter, M. Capparella, B. Alden and |
|
|
R. P. Fisk: LC GC Int. 8 (1995) 26 |
2.15 Sample Solvent and Calibration Curve
Sometimes in analytical HPLC one experiences unexpected effects which are difficult to explain. In the example presented here fosinopril sodium was separated on silica with an aqueous mobile phase; this is an unusual but nevertheless valid phase system. The detection wavelength was, moreover, very low. The analysts found that the peak areas were very strongly dependent on the particular sample solvent although not more than 20 µL were injected. They could not explain this effect. As long as the same sample solvent is used for calibration and analysis no problems will arise with this method. If for some reason, however, the solvent is changed for the analyses the results will be extremely inaccurate (although precise). It is, therefore, indispensable to prescribe the sample solvent for calibration curve and analysis and to mention the problem in the method description ( → 3.10, 3.11).
As long as the circumstances have not been studied it is never possible to exclude such phenomena, not even with conventional phase systems. In this example the possible analytical errors are serious; with another method they could be much smaller but not negligible.
Chromatographic Conditions
|
Sample: |
fosinopril sodium, 20 µL solution in ethanol, methanol or water |
|
Column: |
3.9 mm × 15 cm |
|
Stationary phase: |
Resolve Silica, 5 µm (silica) |
|
Mobile phase: |
acetonitrile/water/orthophosphoric acid 4000 : 15 : 2, 1 mL min−1 |
|
Detector: |
UV 205 nm |
|
Reference: J. Kirschbaum, J. Noroski, A. Cosey, D. Mayo and J. Adamovics: J. Chromatogr. 507 (1990) 165 |
2.16 Impurities in the Sample
The signal of a sample component in the UV detector is proportional to its molar absorptivity ε and its concentration. The absorptivity is a function of the wavelength, as every UV spectrum shows, and, of course, depends on the particular molecule ( → 2.39). It is, therefore, never permissible to postulate a certain mass ratio from a given peak-size ratio.
An extreme example is the pair chlorostilbene oxide and chlorobenzophenone if detection is at 254 nm. The commercially available trans-4-chlorostilbene oxide (first peak) has a purity of 98% and contains some 4-chlorobenzophenone as an impurity (plus several other trace components). As the UV spectra show, chlorostilbene oxide has much lower absorptivity at 254 nm (dotted line) than does chlorobenzophenone. This leads to almost identical peak heights of main component and impurity at the chosen wavelength. When analysis was performed on a chiral stationary phase the two peaks were taken erroneously as the enantiomers of chlorostilbene oxide.
The authors of the paper cited below list two other pairs of compounds as similar examples: trans-stilbene oxide/benzophenone and α-methoxy-α-(trifluoromethyl)phenylacetonitrile/2,2,2-trifluoroacetophenone.
Chromatographic Conditions
|
Sample: |
trans-4-chlorostilbene oxide (Aldrich, 98%), containing 4-chlorobenzophenone as impurity, dissolved in mobile phase |
|
Column: |
3.2 mm × 25 cm |
|
Stationary phase: |
LiChrosorb SI 60, 5 µm (silica) |
|
Mobile phase: |
hexane/tetrahydrofuran 99 : 1, 1 mL min−1 |
|
Detector: |
UV 254 nm |
|
UV spectra: |
40 µm solutions in mobile phase |
|
Reference: V. R. Meyer, after L. Oliveros and C. Minguillòn: J. Chromatogr. A 653 (1993) 144 |
2.17 Formation of a by-Product in the Sample Solution
An irksome analytical error is the formation of a by-product during sample preparation or in the solvent which is used for injection. By such a reaction the content of the analyte decreases and an additional peak might appear in the chromatogram (although this is not inevitable because it is possible that the by-products will not be eluted under the given conditions). The reaction can be time-dependent; then the error is larger the longer the time necessary for sample preparation or the longer the sample will be stored between preparation and injection. Sample storage at low temperature can be advantageous.
Primary amines can react with aldehydes and ketones to give Schiff bases. This was observed during the analysis of bendroflumethiazide when the sample was dissolved in methanol containing a trace of formaldehyde. The concentration of formaldehyde was not higher than 3 µL L−1 but this small amount was enough to produce the azomethine which appeared then as a small peak in the chromatogram. The area and height of the bendroflumethiazide peak decreased accordingly. With formaldehyde-free methanol the problem was not observed.
Chromatographic Conditions
|
Sample: |
bendroflumethiazide, dissolved in methanol with or without formaldehyde |
|
Stationary phase: |
phenyl |
|
Mobile phase: |
water with 0.1 M NaCl and 25 mM sodium acetate/methanol 6 : 4 |
|
Detector: |
UV 270 nm |
|
Reference: J. Kirschbaum, S. Perlman and R.B. Poet: J. Chromatogr. Sci. 20 (1982) 336 |
2.18 Decomposition by the Sample Vial
The driving force of analyte decomposition can be an unexpected one, in this case the type of glass of the vial.
Carnosic acid, a main component of rosemary extract, is known to have weak stability because it is prone to oxidation, especially when dissolved in methanol. In order to protect the samples from light, they were stored in amber autosampler vials. The observed decomposition, i.e. the decrease of the peak area over a time period of 30 h, was higher than expected. In fact, the decomposition was markedly lower in clear glass even when no extra light protection was used.
Amber glass has significant contents of iron and titanium: 0.7–1% Fe2O3 and 3–5% TiO2. In contrast to these high amounts, clear glass (for vials) has only 0.04% Fe2O3. Obviously, the transition metal cations act as catalysts for the oxidation of carnosic acid.
Chromatographic Conditions
|
Sample for stability test: |
|
|
carnosic acid of 99% purity, dissolved in methanol, 293 µg mL−1 |
|
Sample for chromatogram: |
|
|
carnosol and carnosic acid, dissolved in dimethyl sulfoxide |
|
Column: |
3.0 mm × 15 cm |
|
Stationary phase: |
Zorbax SB-C18, 3.5 µm (reversed phase C18) |
|
Mobile phase: |
water/acetonitrile/trifluoroacetic acid 40 : 60 : 0.15, 0.42 mL min−1 |
|
Vial temperature: |
ambient |
|
Column |
|
|
temperature: |
45 °C |
|
Detector: |
UV 230 nm |
|
Reference: M.A. Thorsen and K.S. Hildebrandt: J. Chromatogr. A 995 (2003) 119 |
2.19 Artifact Peaks from the Vial Septum
Sample vials for autosampler injection need to be closed with a septum cap. The septum allows a tight closure even after puncture with the syringe needle. If the septum elastomer is not properly chosen with regard to the sample solution it is possible that artifact peaks will appear in the chromatogram.
For the analysis of impurities in a new drug substance the vials were closed with teflon-lined rubber septa. The first injection showed a large peak of the active compound plus the minor peaks of its impurities from synthesis (upper chromatogram). However, with the second injection from the same vial some additional small peaks showed up in the chromatogram; for investigation purposes the vial was shaken vigorously before the second injection was made (lower chromatogram). If teflon-lined silicone septa were used no extra peaks were found even if the liner was punctured and the vial was shaken. With the first set-up several compounds could be extracted from the rubber once the teflon protection layer was damaged, whereas the silicone material was inert.
Chromatographic Conditions
|
Sample: |
50 µL of drug solution (active compound with impurities), approx. 2 mg mL−1 in mobile phase |
|
Vial septum: |
teflon-lined rubber |
|
Column: |
4.6 mm × 15 cm |
|
Stationary phase: |
Symmetry C18, 5 µm (reversed phase C18) |
|
Mobile phase: |
10 mM phosphate buffer pH 6.0/acetonitrile 60 : 40, 1 mL min−1 |
|
Temperature: |
40 °C |
|
Detector: |
UV 220 nm |
|
Reference: G.R. Strasser and I. Váradi: J. Chromatogr. A 869 (2000) 85 |
2.20 Formation of an Associate in the Sample Solution
A rare source of error is the formation of an associate from two sample compounds which then appears as one peak in the chromatogram. The associate behaves like a molecule and cannot be separated with the given phase system.
As an example, methylprednisolone (top) and tetrahydrocortisone (middle) are such a pair because they can form a total of four intermolecular hydrogen bonds in the preferred configuration. The interaction energy is rather high, namely − 137 kJ mol−1. For the individual steroids the retention factors are 2.36 and 2.26, respectively, and the peaks are broad. If the mixture is injected the retention factor of the associate drops to 2.02; obviously the interaction with the stationary phase is now more favorable and the peak is narrow. An analogous effect is observed with cortisone (with two keto groups in positions 3 and 11 of the steroid skeleton) and tetrahydrocortisol (with two hydroxyl groups).
Chromatographic Conditions
|
Sample: |
methylprednisolone and tetrahydrocortisone dissolved in acetonitrile |
|
Column: |
4.6 mm × 47 cm |
|
Stationary phase: |
Spheri-5 RP-18, 5 µm (reversed phase C18) |
|
Mobile phase: |
water/acetonitrile 65 : 35, 0.5 mL min−1 |
|
Detector: |
UV 240 nm |
|
Reference: P.H. Lukulay and V.L. McGuffin: J. Liquid Chromatogr. 19 (1996) 2039 |
2.21 Precision and Accuracy with Loop Injection
Injection valves are equipped with a loop which is filled with a syringe either manually or by means of an automated machine. With a subsequent turn of the valve the liquid in the loop is transferred to the column by the flowing mobile phase. The loop is, therefore, full of eluent before the next sample is applied.
When the loop is fed with sample an adverse effect takes place: the sample solution is partially mixed with the solvent which it must replace. As a consequence less than, e.g., 20 µL of sample are confined in a 20 µL loop if 20 µL had been applied because a small amount penetrates into the overfill capillary and some old solvent still remains. For this reason the manufacturers of injection valves recommend, for quantitative analyses, either filling the loop with not more than 50% of its volume or, if enough sample is available, injecting fivefold its volume.
In the experiment with a 20 µL loop it was found that accuracy is only achieved with approx. 100 µL of sample and that 200 µL or more is better (upper graph). The accuracy is especially poor if the exact loop volume (20 µL) is injected. With 40 µL and more the precision is better than 0.5%; with smaller volumes it depends on the capability of reproducible injection (lower graph).
The poor accuracy (although not the precision) is not of importance if the analysis is performed with an external standard and with constant volume (!). If an internal standard is used neither injection accuracy nor precision has any an influence on the result.
Chromatographic Conditions
|
Sample: |
thiourea, 50 µg mL−1 in water |
|
Injection: |
manual injection, means of 5 determinations, 20 µL loop, Rheodyne 7125 valve |
|
Column: |
3.2 mm × 25 cm |
|
Stationary phase: |
Spherisorb ODS, 5 µm (reversed phase C18) |
|
Mobile phase: |
water, 1 mL min−1 |
|
Detector: |
UV 238 nm |
|
Reference: V.R. Meyer, see also J. W. Dolan: LC Magazine 3 (1985) 1050 |
2.22 Injection Technique
With manual injection the question arises whether the syringe should be kept within the injector or removed during switching. As can be seen from the data in the figure it is not possible to achieve high precision if the loop is filled partially ( → 2.21) and the syringe is removed.
When the syringe is pulled out of the injector one cannot avoid withdrawing some sample solution back into the needle channel. With partial loop filling a fraction of the carefully injected sample is lost; the volume of this loss is unknown and not defined, and therefore the analytical precision (here given as relative standard deviation) decreases (top left). This sample imprecision would also be observed with 100% loop fill. Only with adequate overfill, as e.g. with the fivefold volume shown here, can enough sample solution flow back from the outlet capillary into the loop (bottom). Under these circumstances it makes no difference whether the syringe remains in the loop or not (the indicated differences in precision are not significant).
It is, nevertheless, a recommended habit to leave the syringe in the injector whenever quantitative analysis is performed because it isolates the loop from the exterior if needle and seal fit correctly. Remember: if the end of the outlet capillary is not positioned at the same height as the needle seal there is a danger that sample will be lost by a siphon drain when the syringe is removed before the valve is turned.
Chromatographic Conditions
|
Sample: |
nitrobenzene dissolved in mobile phase, k = 4 |
|
Injection: |
manually, means from 10 injections, 10 µL (top) or 100 µL (bottom) into a 20 µL loop, Rheodyne 7125 valve |
|
Column: |
4.6 mm × 7.5 cm |
|
Stationary phase: |
Zorbax SB C-18, 3.5 µm (reversed phase C18) |
|
Mobile phase: |
water/acetonitrile 6 : 4, 2 mL min−1 |
|
Detector: |
UV 280 nm |
|
Reference: V.R. Meyer |
2.23 Injection of Air
If several microlitres of air are injected, a small, retained peak with severe tailing will appear in the chromatogram if detection is performed at low UV wavelength (not to be confused with signals generated by air bubbles from a poorly degassed eluent). If, because the analyte concentration is high, the chromatogram can be recorded at low attenuation, one will not be aware of this peak. With low concentrations and trace analysis it can be disturbing.
Although nobody injects air intentionally this can happen with careless manual injection, if the autosampler needle is not properly adjusted to the vials in use, if the flush solvent reservoir is empty, or if the vials are not filled with enough sample.
Chromatographic Conditions
|
Sample: |
solution of octogen in water and a little acetone |
|
Column: |
2 mm × 15 cm |
|
Stationary phase: |
YMC 120 ODS-AQ, 3 µm (reversed phase C18) |
|
Mobile phase: |
water/acetonitrile, 67 : 33, 0.3 mL min−1 |
|
Detector: |
UV 210 nm |
|
The small peak in the lower chromatogram which appears at the appropriate retention time is probably caused by dissolved air in the sample. |
|
Reference: V.R. Meyer |
|
see also J.W. Dolan, D.H. Marchand and S.A. Cahill: LC GC Int. 10 (1997) 274 or LC GC Mag. 15 (1997) 328 (with printing errors: mL instead of µL) |
2.24 Sample Adsorption in the Loop
If the analyte is only poorly soluble in the sample solvent it can become adsorbed on the inner wall of the injector loop (and of other capillaries); basic compounds are possibly more prone to such effects than others. If the mobile phase is different and is a better solvent it might be expected that the adsorbed compounds will be desorbed during the injection process although an unpleasant surprise cannot be excluded.
It is possible that such reversible adsorption would not affect the analysis and would, in fact, not even be recognized. Problems will, however, arise if the recommended technique of loop overfill ( → 2.21) is used. If terfenadine is dissolved in water (a poor solvent for this compound), the peak area increases with increasing sample volume. This means that the advantage of loop overfill, i.e. excellent reproducibility, is lost; now it is necessary to inject the standard and sample solutions with high volume precision. As usual, the recommended procedure is to dissolve the sample in the mobile phase – then the peak area is independent of sample volume, even with a 15-fold overfill. For this analysis the same is even true for methanol as sample solvent; methanol is a stronger eluent than the mobile phase (although it should be remembered that stronger solvents are often unsuitable and give rise to other problems ( → 2.13, 2.14)).
The authors of the study found analogous results for astemizole, bromhexine, and ergotamine, all molecules with amine nitrogen; with phenylephrine, caffeine, betamethasone, ambroxol, and enapril, on the other hand, no problems were observed.
Chromatographic Conditions
|
Sample: |
terfenadine, 5 µg mL−1 in water, mobile phase or methanol |
|
Injection: |
60, 150 or 300 µL in a 20 µL loop (stainless steel) |
|
Column: |
4.6 mm × 15 cm |
|
Stationary phase: |
MicroPak MCH-5, 5 µm (reversed phase C18) |
|
Mobile phase: |
0.03 M phosphate buffer pH 3.0/acetonitrile 7 : 3, 1.7 mL min−1 |
|
Detector: |
UV 230 nm |
|
Reference: G.C. Fernández Otero, S.E. Lucangioli and C.N. Carducci: J. Chromatogr. A 654 (1993) 87 |
2.25 Extra-Column Volumes
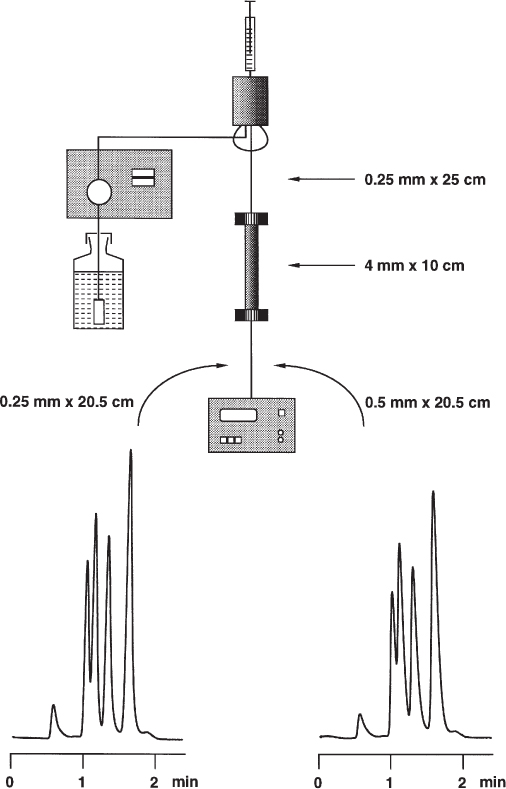
The separation performance of the column is affected by the extra-column volumes (also called dead volumes) of the instrument; these should, therefore, be kept as low as possible. All elements of the HPLC instrument between injector and detector are part of the extra-column volume, i.e. several fittings, two capillaries (or even more), the column frits, and the detector cell. As the user of an HPLC system one can usually only modify the capillaries because the design of the column end fittings is fixed. Sometimes, however, it is worthwhile inspecting the detector also because many instruments are equipped with long, winding internal capillaries to improve heat exchange. Then a new and short capillary can be built in, a measure which will reduce this part of the extra-column volume; it is necessary to check whether noise increases markedly. If so it is necessary to protect the instrument from short-term temperature fluctuations (e.g. draught) or to thermostat it.
The capillaries between injector, column, and detector should have a maximum inner diameter of 0.25 mm. The inner diameter dc is far more important than the length! It influences the separation performance by the fourth power, i.e. by  . It is not really detrimental to use a capillary of double length if this is necessary because of the use of a short column. On the other hand, replacement of 0.25 mm capillary by one of 0.5 mm inner diameter can affect the chromatogram as the example shows, even when a column of moderate performance is used. Peaks with small retention factors thereby undergo more broadening than later eluted ones.
Chromatographic Conditions
|
Sample: |
8 µL of solution of methyl, ethyl, propyl, and butyl parabene |
|
Column: |
4.0 mm × 10 cm |
|
Stationary phase: |
Nucleosil 5 C18, 5 µm (reversed phase C18) |
|
Mobile phase: |
water/methanol 1 : 3, 1.2 mL min−1 |
|
Detector: |
UV 254 nm |
|
Resolution: |
R12 (tR = 1.02 min and 1.13 min) = 0.85 and 0.7, respectively (N1 = 1400 and 1000, respectively) R34 (tR = 1.32 min and 1.63 min) = 1.9 and 1.7, respectively |
|
Reference: V.R. Meyer |
2.26 Dwell Volume
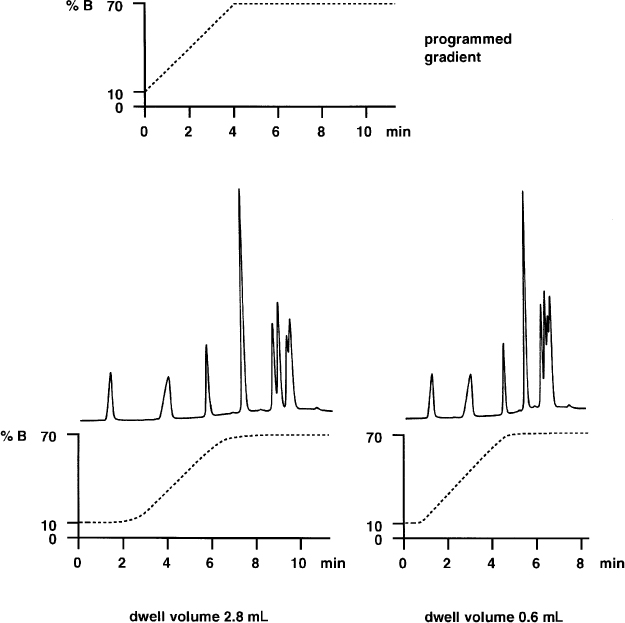
When working with gradient separations, the dwell volume is a parameter which is often not taken into consideration. This is the volume within the HPLC system between the mixing point of the various solvents and the column entrance. Besides the connecting capillaries the dwell volume includes mainly the mixing chamber (with high pressure gradients) or the mixing valve and the pump (with low pressure gradients); depending on instrument design the volumes of fittings and other items also contribute. The sum of all these volumes delays the time until the gradient profile becomes effective at the column entrance; it also smooths the profile as a result of mixing effects.
If a gradient separation is always performed on the same unmodified HPLC system the dwell volume does not show up (with the exception of computer-aided gradient optimization). In fact a surprise will result if the separation needs to be reproduced on another instrument which probably has a different dwell volume, or if the original instrument is modified.
This separation of PTH amino acids was performed with a high-pressure gradient system of 2.8 mL dwell volume; the volume was the sum of mixing chamber, precolumn (scavenger column), and connecting capillaries (left). Without precolumn and with shorter, narrower capillaries the dwell volume dropped to 0.6 mL (right). Now the retention times are shorter and the separation needs less time but the resolution of the peak cluster at the end is much worse than before because the gradient profile was not designed for the modified HPLC system.
Chromatographic Conditions
|
Sample: |
phenylthiohydantoin derivatives of Asn, Asp, Glu, Ala, His, Pro, Val, Ile and Phe, dissolved in water/methanol 9 : 1 |
|
Column: |
3.2 mm × 25 cm |
|
Stationary phase: |
Spherisorb ODS, 5 µm (reversed phase C18) |
|
Mobile phase: |
gradient from 10% methanol in water to 70% methanol in 4 min, then isocratic, 1 mL min−1 |
|
Detector: |
UV 254 nm |
|
Reference: V.R. Meyer |
2.27 Elution at t0
Elution at t0, i.e. at the breakthrough time, is basically unwanted. Compounds which appear that early in the chromatogram have not been retained which means that no chromatography took place. If more than one compound runs through the column this way they cannot be separated. Under such circumstances the certainty that a peak represents a single compound only is much lower than with retained peaks. In addition the standard deviation of peak area (as shown here) or height can be atypically high or low. Quite often the peaks at t0 have an unusual shape which can make their integration more difficult or easier. The two examples present t0-peaks of exceptionally poor (top) or good (bottom) peak area reproducibility.
Chromatographic Conditions
|
Top: |
means of 8 analyses |
|
Sample: |
50 µL of anion standards in water |
|
Column: |
4.0 mm × 25 cm |
|
Stationary phase: |
Dionex AS4A-SC |
|
|
(anion exchanger for ion chromatography) |
|
Mobile phase: |
1.8 mM sodium carbonate + 1.7 mM sodium hydrogen carbonate, 2 mL min−1 |
|
Detector: |
conductivity (after cation-exchange suppressor) |
|
Reference: R. Brügger, Central Laboratory, Blood Transfusion Service, Swiss Red Cross, Bern, Switzerland |
Chromatographic Conditions
|
Bottom: |
means of 8 analyses |
|
Sample: |
extract from tablet containing paracetamol, acetylsalicylic acid, and hexobarbital |
|
Column: |
3.0 mm × 15 cm |
|
Stationary phase: |
Inertsil ODS-3, 5 µm (reversed phase C18) |
|
Mobile phase: |
1% potassium dihydrogen phosphate pH 3/acetonitrile/tetrahydrofuran 50 : 25 : 25, 0.8 mL min−1 |
|
Detector: |
UV 218 nm |
|
Reference: V.R. Meyer |
2.28 Classification of C18 Reversed Phases
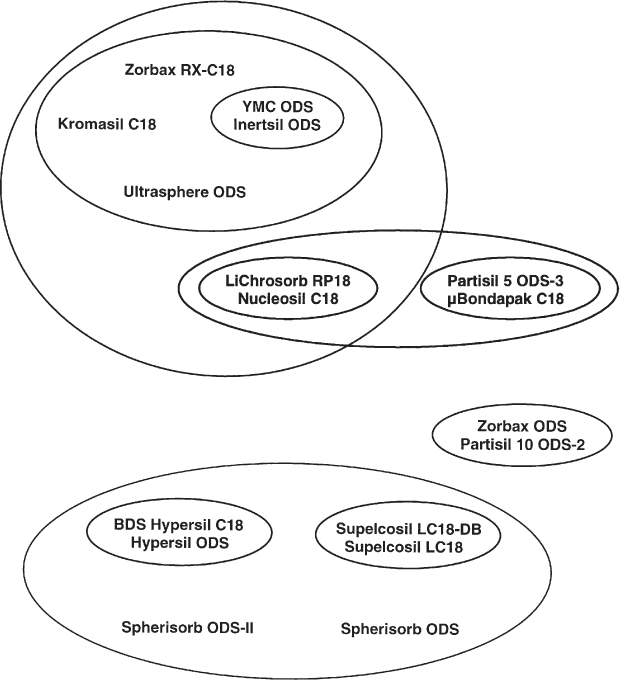
The properties of stationary phases depend on their manufacturing process. The first step is the synthesis of the bare silica; the end-product is influenced by solvents, pH, catalysts, impurities, and the details of the manufacturing process. The material is, therefore, different from one manufacturer to another. The subsequent covalent anchoring of the bonded phase is again subject to widely variable conditions. Thus it is obvious that the commercially available HPLC phases can have very different properties even when, as an example, all belong to the class of C18 materials. They differ in pore diameter, pore width distribution, carbon content (the mass fraction of chemically bonded phase), amount of residue silanols and their accessibility as well as in their acidic or basic character.
One can try to classify commercially available C18 phases according to their similarity or their differences. A proposal is presented in the diagram. It was established on the basis of the behavior of the phases with regard to hydrophobicity, silanol activity, metal trace activity, and geometric shape selectivity. Adjacent phases are very similar; it would, e.g., be possible to replace YMC ODS by Inertsil ODS. Phases which are far apart show very different properties; it is, e.g., not recommended to use a Spherisorb-type phase for a separation which was developed and optimized on Kromasil.
Depending on the methods of investigation the classification could also look different. For practical purposes it is important to know that the differences exist and that they can be distinct ( → 2.29).
These considerations are true not only for C18 phases but for unmodified silica and for all types of bonded phases as well.
2.29 Different Selectivity of C18 Reversed Phases
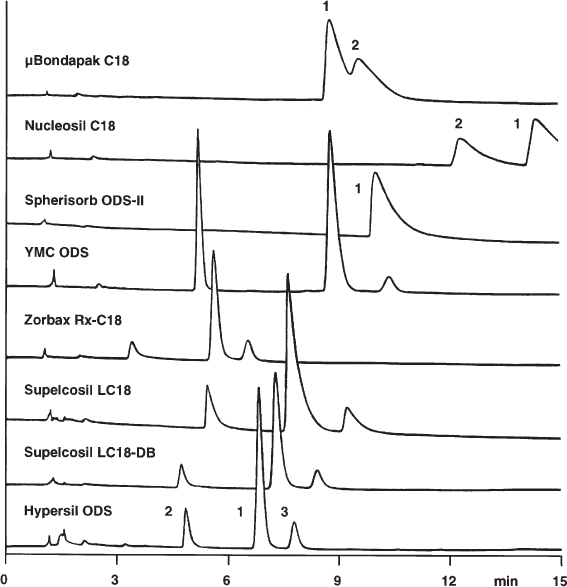
Because of the different properties of different C18 phases ( → 2.28) it is often not possible to use a stationary phase other than that with which a particular application was developed. Of course, a first attempt can be made with the phase which is at hand and it makes no sense to discourage this approach. A (bad) surprise could, however, result.
This becomes obvious with the presented separations of dirithromycin (an antibiotic) and its degradation products. Retention factors (or retention times), separation factors, resolutions, and elution order can differ markedly. The nice separation on Hypersil ODS looks very different on µBondapak C18. This does not mean that Hypersil is better than Bondapak; perhaps some phases are less suited for certain separations, and the favorable conditions, i.e. the composition of the mobile phase, need to be adapted to the stationary phase. The only consequence of this example is: do not expect to be able to reproduce a published separation on any phase whatever even if it belongs to the same general class.
This is true not only for C18 materials but also for all types of HPLC phase. The stationary phase used must be mentioned clearly in the method description ( → 3.11).
Chromatographic Conditions
|
Sample: |
1 = dirithromycin, 2 = erythromycylamine, |
|
|
3 = epidirithromycin |
|
Column: |
4.6 mm × 25 cm |
|
Stationary phase: |
various reversed phases C18, 5 µm |
|
Mobile phase: |
50 mM potassium phosphate pH 7.5/acetonitrile/methanol 37 : 44 : 19, 2 mL min−1 |
|
Temperature: |
40 °C |
|
Detector: |
UV 205 nm |
|
Reference: B.A. Olsen and G.R. Sullivan: J. Chromatogr. A 692 (1995) 147 |
2.30 Different Batches of Stationary Phase
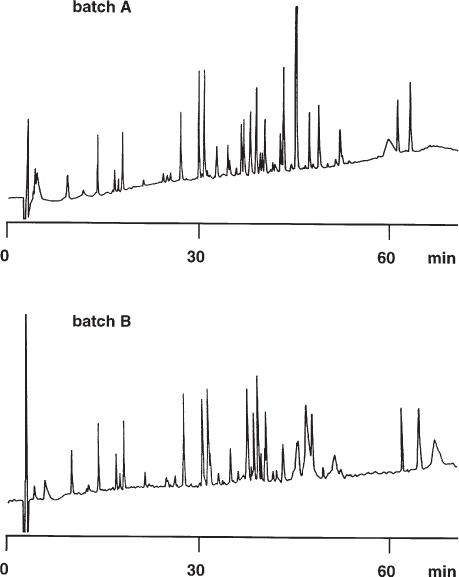
When working with difficult separation problems it is possible that the stationary phase used will not be available with identical properties over a long period of time. In fact even the test chromatograms of the different batches can be almost identical and the difference will only be seen when a critical sample is injected.
The upper separation has more features and is more detailed than the lower one, especially over the second half of the chromatogram. The authors of the study mentioned that only approximately 5% of the columns tested behaved in the desired manner.
In principle only one recommendation can be given for such problems – buy as many columns of a good batch as will be needed to perform the analyses during the next few years. Perhaps another stationary phase would be more rugged in this regard but every change of an optimized difficult separation leads to much work, and it takes a long time to find out about batch reproducibility (in fact, certainty in these matters is an impossibility).
Chromatographic Conditions
|
Sample: |
tryptic peptides from biosynthetic human growth hormone |
|
Column: |
4.0 mm × 25 cm |
|
Stationary phase: |
LiChrosorb RP-18, 5 µm (reversed phase C18) |
|
Mobile phase: |
water/acetonitrile with 0.1% trifluoroacetic acid, 1 mL min−1, gradient from 0 to 50% acetonitrile in 60 min |
|
Temperature: |
45 °C |
|
Detector: |
UV 215 nm |
|
Reference: B.S. Welinder, H.H. Sørensen, K.R. Hejnæs, S. Linde and |
|
|
B. Hansen, in: M.T.W. Hearn, HPLC of Proteins, Peptides and |
|
|
Polynucleotides, VCH, New York 1991, pp. 495–553, Figs. 15–22 |
2.31 Chemical Reaction within the Column
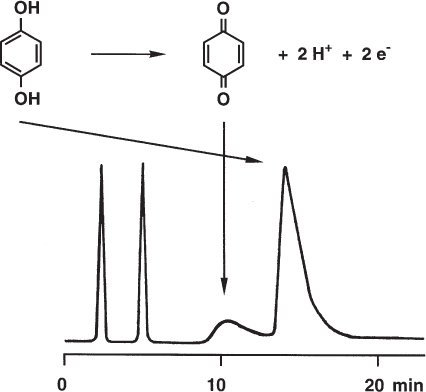
Under exceptional circumstances a chemical reaction can occur in the HPLC column. As in the case of decomposition in the sample solution ( → 2.17, 2.18) the relevant peak decreases in area and an additional peak can appear.
It can be difficult to recognize that a reaction is taking place during chromatography, although it is possible to utilize the general properties of chemical reactions – longer residence time (lower flow rate) or higher temperature should increase the extent of the observed phenomena.
During the separation presented here hydroquinone was partially oxidized to benzoquinone. The oxidizing agent was obviously Fe3+ which was present at sufficient concentration in an old, often used silica column. On a new column with identical packing the reaction did not occur and a benzoquinone peak was not found. The reaction was enhanced by dissolved oxygen in the mobile phase.
Chromatographic Conditions
|
Sample: |
hydroquinone (last peak), 1-phenyloctane and diethyl phthalate (first and second peaks) |
|
Column: |
4.6 mm × 30 cm |
|
Stationary phase: |
Spherisorb S10W, 10 µm (silica) |
|
Mobile phase: |
hexane/2-methyl-2-propanol 92 : 8, 0.82 mL min−1 |
|
Detector: |
UV 270 nm |
|
Reference: C.Y. Jeng and S.H. Langer: J. Chromatogr. Sci. 27 (1989) 549 |
2.32 Tailing of Phosphate Compounds in the Presence of Steel
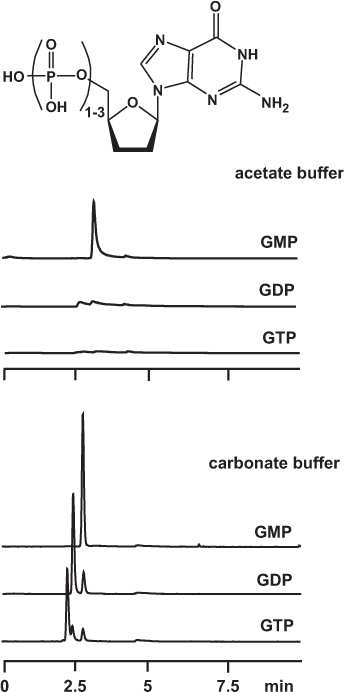
For a long time it is known that phosphate compounds may be eluted as tailed peaks if the separation is performed in a common HPLC system with stainless steel parts. Phosphate groups, especially if there is more than one in a molecule, form a chelate with iron, nickel, chromium and other metal ions. This interaction, although it is less strong than a covalent chemical bond, is an additional and unwanted process, thus leading to peak asymmetry. The effect can be suppressed by using a phosphate buffer as the aqueous part of the mobile phase. However, such non-volatile eluents are not suitable for MS detection.
Of the volatile buffers, ammonium hydrogen carbonate yields sharp peaks whereas ammonium acetate does not if used for the separation of phosphate nucleotides. The authors suppose that carbonate ions undergo a similar interaction with metal ions as phosphate ions do. Therefore the cations on the steel surfaces of capillaries and column are “capped” with carbonate.
Chromatographic Conditions
|
Sample: |
10 µL with guanosine 5′-mono-, -di- and -triphosphate (GMP, GDP, GTP), 2.5 µg/mL each in water/acetonitrile 1 : 1 |
|
Column: |
4.6 mm × 25 cm |
|
Stationary phase: |
Capcellpak C18-AQ, 5 µm (reversed phase C18) |
|
Mobile phase: |
10 mM buffer pH 6.7/methanol 95 : 5, 1 mL min−1 |
|
|
top: ammonium acetate |
|
|
bottom: ammonium hydrogen carbonate |
|
Temperature: |
35 °C |
|
Detector: |
UV 253 nm |
|
Reference: Y. Asakawa : J. Chromatogr. A 1198-1199 (2008) 80 |
2.33 Recovery and Peak Shape Problems with Proteins
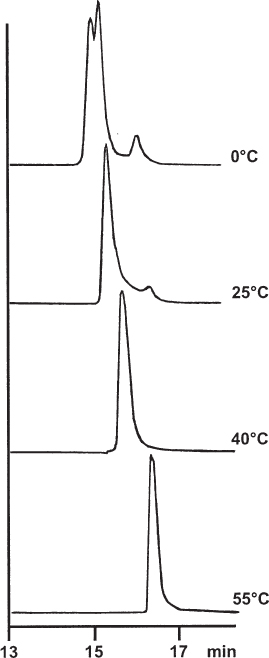
Surprising (and unwanted) behavior of the analytes is not uncommon in HPLC separations of proteins: changes of conformation, loss of activity, and poor recovery. It is not straightforward to explain the observations since there is a great variety of possible interactions of a protein with the stationary phase and of the various possibilities for unfolding and other shape effects.
In general, such problems are less pronounced in hydrophobic interaction chromatography than in ion-exchange chromatography. Nevertheless, very puzzling phenomena can also be observed in HIC as shown here with the separation of cytochrome c. A decent peak shape is only found at elevated temperature but at the cost of decreased peak area, which means loss of protein. The retention time depends on temperature. The effects could not be explained satisfactorily.
Chromatographic Conditions
|
Sample: |
20 µL with 20 µg of cytochrome c dissolved in starting buffer |
|
Column: |
4.6 mm × 3.5 cm |
|
Stationary phase: |
HIC Butyl NP, 2.5 µm (non-porous reversed phase C4) |
|
Mobile phase: |
A: 5 mM Tris buffer pH 7.4 with 3 M ammonium sulfate |
|
|
B: 5 mM Tris buffer pH 7.4 without ammonium sulfate |
|
Gradient: |
from 0 to 100% B in 10 min, 1.0 mL min−1 |
|
Temperature: |
as indicated |
|
Detector: |
UV 280 nm |
|
Reference: S.H. Goheen and B.M. Gibbins: J. Chromatogr. A 890 (2000) 73 |
2.34 Double Peaks from Stable Conformers
Some classes of compounds, e.g. proline derivatives, form stable conformational isomers in solution with interconversion rates of the same order of magnitude as the chromatographic analysis time. The stability of the isomers comes from the amide bond which has some double bond character, thus giving rise to cis and trans structures.
When captopril, i.e. (S)-1-(3-mercapto-2-methyl-1-oxopropyl)-L-proline is analyzed in aqueous neutral solution two peaks are obtained which belong to the cis and trans isomers. In order to obtain a single peak the mobile phase needs to be acidic in the region of pH 2. Then the interchange of conformation is rapid compared with the residence time in the chromatographic phase system. The peak shape can be further improved by increasing the temperature to 30 °C.
A by-product of captopril is the dimer; with some formulations, therefore, even three chromatographic peaks are found.
Double peaks from analogous isomers can also be found during the analysis of carbohydrates on common HPLC phases not especially designed for sugar separations. In this case the two peaks represent the two possible anomeric forms of the molecules.
Chromatographic Conditions
|
Sample: |
captopril dissolved in mobile phase |
|
Column: |
3.0 mm × 15 cm |
|
Stationary phase: |
Inertsil ODS-3, 5 µm (reversed phase C18) |
|
Mobile phase: |
water/acetonitrile 88 : 12, without additive or at pH 2 with phosphoric acid, 0.8 mL min−1 |
|
Detector: |
UV 220 nm |
|
Reference: V.R. Meyer, after U.D. Neue, D.J. Phillips and M. Morand: Waters (Europe) Column, Spring 1995, p. 11 |
2.35 Influence of Temperature on the Separation
The partition equilibria on which chromatography is based ( → 1.1) are temperature-dependent. Both the degree and sign of the temperature behavior are specific for any compound, which means that the separation can be influenced by the appropriate setting of the column oven in many cases. Without knowledge of the thermodynamic data it is, however, impossible to predict whether an increase or a decrease in temperature would be advantageous for a given problem. If a separation is optimized for routine analysis it is recommended in any case to investigate the parameter temperature also.
If the analysis is performed without temperature control one should not be surprised by changes in the chromatogram which arise as a result of fluctuations in ambient temperature during a day or a year.
The example presents the separation of explosives which is well-known to be temperature-sensitive with most phase systems. It can be expected that the resolution between peaks 4 and 5 will increase at even higher temperatures, maybe at the expense of the resolution between compounds 3 and 4.
Chromatographic Conditions
|
Sample: |
explosives at 10 µg/mL: 1 = tetryl, 2 = trinitrotoluene, 3 = 2-amino-4,6-dinitrotoluene (DNT), 4 = 4-amino-2,6-DNT, 5 = 2,4-DNT, 6 = 2,6-DNT |
|
Column: |
2.1 mm × 10 cm |
|
Stationary phase: |
Acquity UPLC BEH C18, 1.7 µm (reversed phase C18) |
|
Mobile phase: |
water/methanol 72 : 28, 0.5 mL min−1 |
|
Temperature: |
as specified |
|
Detector: |
UV 254 nm |
|
Reference: E. Grumbach, Waters, Milford, MA, USA |
2.36 Thermal Non-Equilibrium within the Column
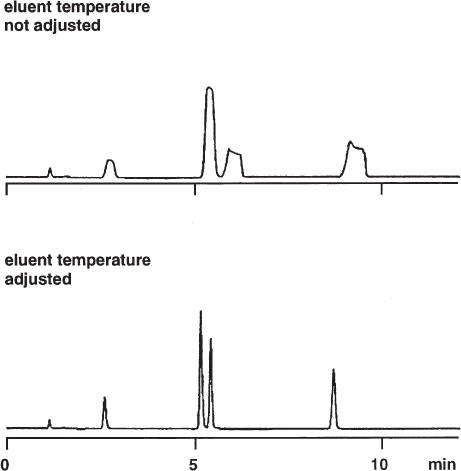
Eluent viscosity and analyte diffusion coefficients are temperature dependent. Therefore it is important that there are no radial and lateral temperature gradients within the column (or almost no gradients; some temperature rise over the column length is inevitable because of friction heat which is generated by the flow resistance of the column packing). Temperature gradients will occur if the mobile phase has a different temperature than that of the column when it enters the chromatographic bed. This is not the case when both the solvent reservoir and the column are at ambient temperature. However, if the column is heated or cooled it is necessary to thermostat the eluent to the same temperature. If this is not done there will be different flow rates and different mass transfer coefficients over the cross-section of the column, which will result in strange peak shapes and even double peaks.
The upper chromatogram shows a separation which was performed at 77 °C without the use of a preheater, giving grossly deformed peaks. For the lower separation, a stainless steel tube of 0.25 mm × 1 m, coiled to a diameter of 10 cm, was installed between the autosampler and the column and clamped against the heating block in the column oven. This procedure led to peaks of excellent shape. One must not forget that the extra-column volume ( → 2.25) and the dwell volume ( → 2.26) were larger now.
Chromatographic Conditions
|
Sample: |
uracil (not retained), nitroethane, 3,5-dimethylaniline, 3-cyanobenzoic acid, and nitrobenzene |
|
Column: |
4.6 mm × 15 cm |
|
Stationary phase: |
Zorbax SB-C18, 5 µm (reversed phase C18) |
|
Mobile phase: |
50 mM potassium phosphate buffer pH 2.6/acetonitrile, 1.5 mL min−1, gradient from 5 to 65% acetonitrile in 13 min |
|
Temperature: |
77 °C |
|
Detector: |
UV 215 nm |
|
Reference: R.G. Wolcott and J.W. Dolan: LC GC Int. 12 (1999) 14 or LC GC Mag. 16 (1998) 1080 |
|
See also: R.G. Wolcott : J. Chromatogr. A 869 (2000) 211 |
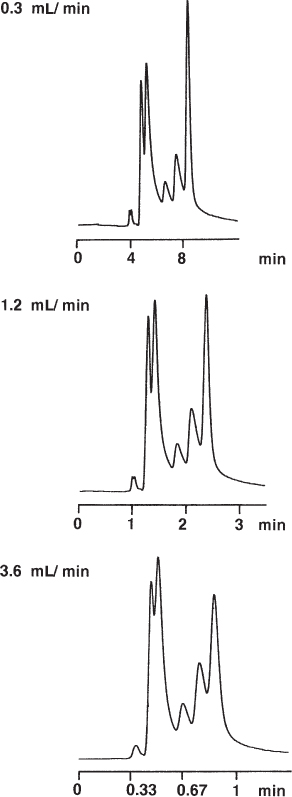
2.37 Influence of the Flow Rate on the Separation
The van Deemter curve ( → 1.5) illustrates that the height of a theoretical plate depends on the linear flow rate of the mobile phase. This phenomenon becomes more familiar when discussed as the dependence of peak width on the flow rate. Its influence on the chromatogram can be remarkably large.
In the figure this is illustrated by a rather unfavorable (or interesting) example, i.e. the incomplete separation of nine PTH amino acids. The peak widths increase with increasing flow rate. This reduces their height. The poorly separated peak pair early in the chromatogram (which probably arises from more than two compounds) loses resolution, which results in increased peak heights. The reason for this behavior, paradoxical at first glance, lies in the overlap of poorly resolved peaks with strong tailing ( → 2.56).
In most cases chromatographic separations are performed too fast with regard to the van Deemter optimum. The adverse effects on the chromatogram are, however, much less severe than when the flow rate is too low as becomes obvious from study of the van Deemter curve. Especially in reversed-phase chromatography with its rather high-viscosity mobile phases it would be favorable to perform the separations with lower flow rates than usual; a linear flow rate of approximately 0.6 mm s−1 is close to the optimum (as calculated for phenol in acetonitrile/water 1 : 1 with u = νDm/dp( → 1.4), diffusion coefficient Dm = 1 · 10−9 m2 s−1, particle diameter dp = 5 µm). For compounds of higher molar mass the optimum lies at even lower flow rates!
Chromatographic Conditions
|
Sample: |
phenylthiohydantoin derivatives of Asn, Asp, Glu, Ala, His, Pro, Val, Ile and Phe, dissolved in mobile phase |
|
Column: |
3.2 mm × 25 cm |
|
Stationary phase: |
LiChrosorb SI 60, 5 µm (silica) |
|
Mobile phase: |
tert-butyl methyl ether |
|
Detector: |
UV 254 nm |
|
Reference: V.R. Meyer |
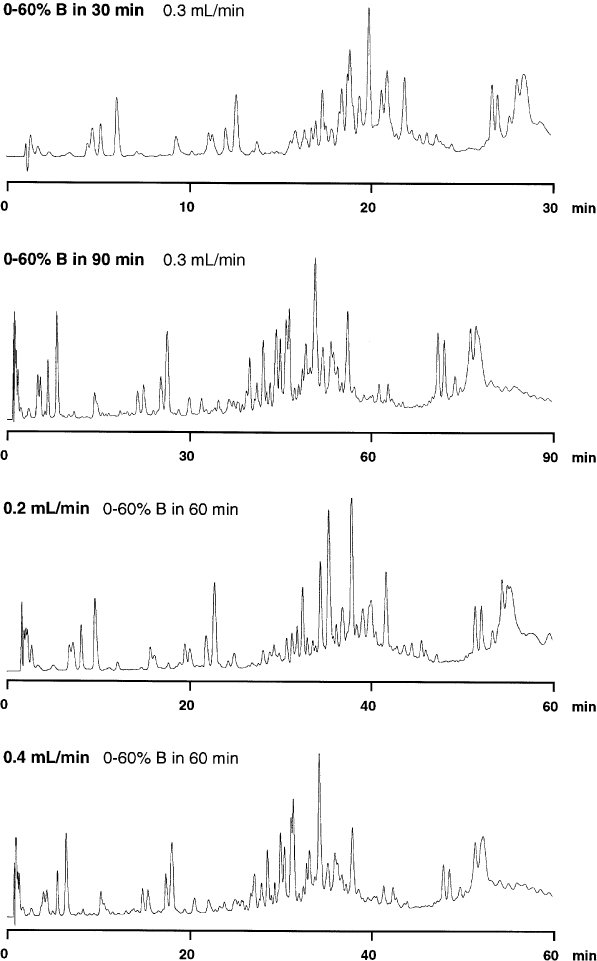
2.38 Influence of Run Time and Flow Rate on Gradient Separations
The separation of a complex mixture can be influenced markedly by both the run time and the mobile phase flow rate. The separation is mainly driven by the increase in the amount of the strong mobile phase; it will (usually) be complete when the final concentration of the B eluent is reached, irrespective of the time necessary for this. The influence of the flow rate is less pronounced. Nevertheless a change of the flow will be apparent from the chromatogram (besides the possible van Deemter effects, → 2.37) because the flowing eluent transports the components, depending on their individual and %B-dependent partition coefficients, to a certain place within the column. The combination of both parameters then gives the chromatogram. If one or the other is changed this will be visible in the peak pattern. Therefore both gradient run time and flow rate (together with the column dimensions), and the dwell volume ( → 2.26) must be noted in the method description ( → 3.11, 3.13).
For the separations presented here it is interesting to note that both combinations, 90 min with 0.3 mL min−1 and 60 min with 0.4 mL min−1, give almost identical separations whereas the other chromatograms differ markedly. The resolution patterns should be identical if the product of gradient time and flow rate is constant.
Chromatographic Conditions
|
Sample: |
pepsin-digested lactalbumin (48 h, 37 °C) |
|
Column: |
2.1 mm × 10 cm |
|
Stationary phase: |
Bakerbond Butyl, 7 µm (reversed phase C4) |
|
Mobile phase: |
A:0.1% trifluoroacetic acid in water |
|
|
B:0.1% trifluoroacetic acid in water/acetonitrile 2 : 8 |
|
Detector: |
UV 210 nm |
|
Reference: P. von Haller, Department of Chemistry and Biochemistry, University of Bern, Switzerland |
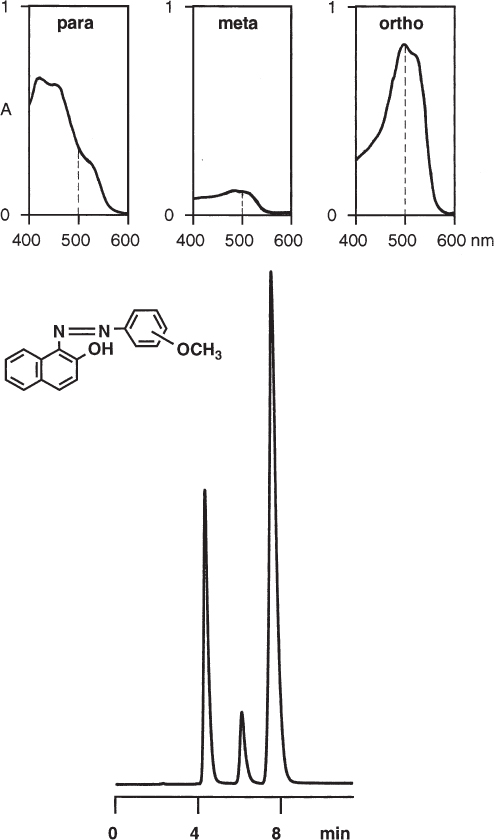
2.39 UV Spectra and Quantitative Analysis
The intensity of a chromatographic peak depends on the injected sample amount, the column properties (dimensions and number of theoretical plates), and the spectroscopic properties of the analyte. With UV detection, an intense signal can be expected if the compound has a high molar absorptivity and if the wavelength of maximum absorptivity is chosen. It is often necessary to detect at a wavelength where all the analytes have some absorptivity but which is not the optimum for one of them. (If this is a problem, the diode array detector should be used.) Without careful checking it is not acceptable to perform a quantitative analysis based on peak heights or areas only. In almost every case it is necessary to determine the calibration curves for all the analytes of interest by the injection of standard solutions ( → 1.15).
Even for positional isomers the UV-VIS spectra can be highly different in shape and intensity. Of the three isomers of an azo dye, the meta compound has a markedly lower absorptivity in the 400–600 nm range than that of the ortho and para isomers. This leads to highly different peak areas (or heights) when identical amounts are injected.
Chromatographic Conditions
|
Sample: |
isomers of 1-(methoxyphenyl-azo)-2-naphthol (red dyes), 17 ng each in mobile phase; 10 ppm solutions for the spectra |
|
Column: |
2 mm × 5 cm |
|
Stationary phase: |
YMC-Pack Silica, 3 µm (silica) |
|
Mobile phase: |
hexane/dichloromethane 1 : 1, 0.5 mL min−1 |
|
Detector: |
VIS 500 nm |
|
Peak areas: |
para, 25.5%; meta, 7.5%; ortho, 67.0% |
|
Reference: V.R. Meyer |
2.40 UV Detection Wavelength
In most cases UV spectra have broad absorption bands which could lead to the assumption that it is of minor importance even for quantitative analyses whether the detector is really working at the desired wavelength. In reality even a deviation of only 1 nm can influence the analytical result although the effect is usually not as severe as in the example shown here.
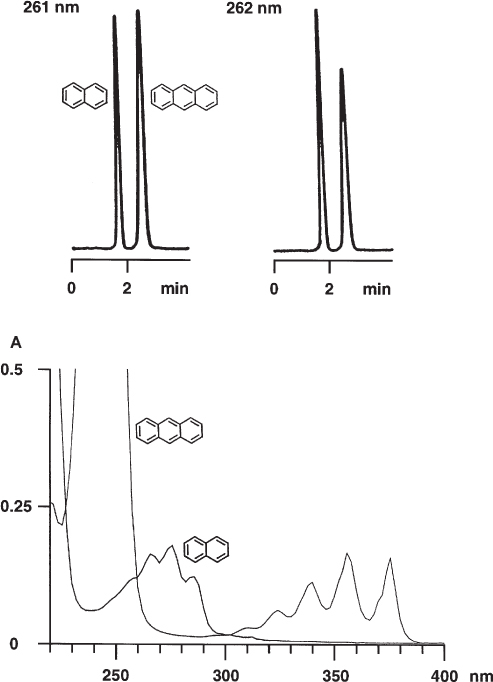
If naphthalene and anthracene are to be detected quantitatively it is, in fact, very difficult to choose a suitable wavelength. At around 260 nm the absorbance of anthracene depends extremely strongly on the wavelength, which means that a change of not more than 1 nm substantially influences the signal intensity. If identical amounts of the two compounds are injected the anthracene peak is slightly higher than the naphthalene peak at 261 nm under the given chromatographic conditions whereas it is markedly smaller at 262 nm. This analytical method is not rugged ( → 1.14) with regard to detection wavelength. It would be better to detect at 300 nm, a wavelength where both UV spectra are flat. Unfortunately the detection limit will be poor because of the low absorbance.
Chromatographic Conditions
|
Sample: |
naphthalene and anthracene, 4 µg mL−1 each in methanol (also for the UV spectra) |
|
Column: |
4.6 mm × 10 cm |
|
Stationary phase: |
Kontron RP-8, 10 µm (reversed phase C8) |
|
Mobile phase: |
water/acetonitrile 4 : 6, 2 mL min−1 |
|
Detector: |
UV 261 or 262 nm |
|
Reference: V.R. Meyer |
2.41 Different Detection Properties of Diastereomers
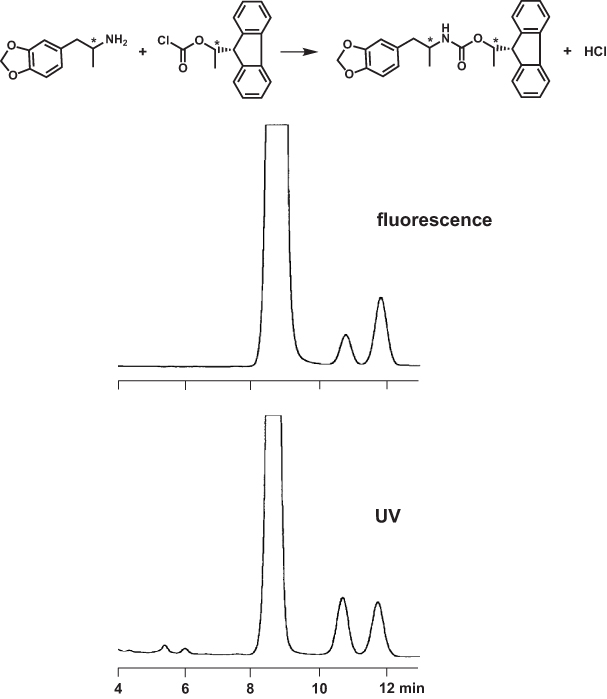
Enantiomers have identical detection properties, therefore it is possible to determine R/S ratios from their peak area ratios without calibration curve (but not from peak heights). However, this must not be true for diastereomers. There are a number of reports in the literature that diastereomers obtained from the derivatization of a pair of enantiomers with an optically pure chiral reagent may differ in their detector response, especially in fluorescence detection. The UV properties may be identical, as in the example shown here, but a case of different UV absorption is e.g. shown in D.M. Desai and J. Gal: J. Chromatogr. 629 (1993) 215.
For the analysis of 3,4-methylenedioxyamphetamine on a non-chiral ODS phase, the racemate was derivatized with enantiomerically pure (−)-1-(9-fluorenyl)ethyl chloroformate, yielding fluorescing diastereomers. Whereas the peak areas in the UV were identical, the first eluting compound had only 55% of the area of the second one with fluorescence detection.
Chromatographic Conditions
|
Sample: |
racemic 3,4-methylenedioxyamphetamine (MDA) after derivatization with (-)-1-(9-fluorenyl)ethyl chloroformate (FLEC) |
|
Column: |
4 mm × 12.5 cm |
|
Stationary phase: |
LiChrospher 100 RP18, 5 µm (reversed phase C18) |
|
Mobile phase: |
50 mM acetate buffer pH 4.5/methanol 30 : 70, 1 mL min−1 |
|
Detector: |
fluorescence 212 nm/313 nm or UV 265 nm |
|
Note: |
peak at 8.4 min is unreacted FLEC |
|
Reference: P. Campíns-Falcó, J. Verdú-Andrés and R. Herráez-Hernández: Chromatographia 57 (2003) 309 (with an error in the structure of the FLEC reagent in Fig. 1) |
2.42 Fluorescence Quenching by Air
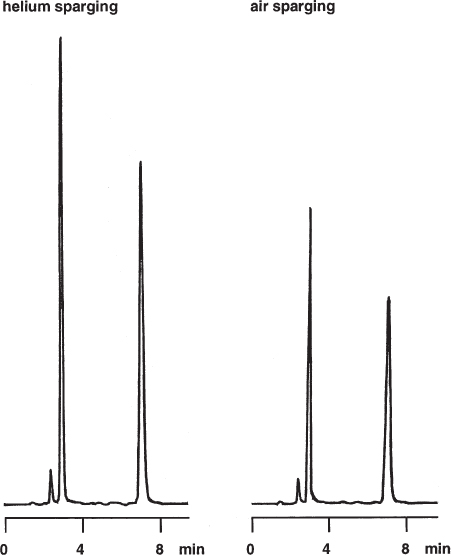
Air (i.e. oxygen) in the mobile phase quenches the fluorescence emission signal: the amount of emitted light is lower than it is in the absence of oxygen. It is therefore necessary to degas the mobile phase thoroughly when a fluorescence detector is used. Otherwise the signal-to-noise ratio ( → 2.48) is worse or the peak size determination for quantitative analysis can be inaccurate.
Usually the air content of the eluent is unintended. For one of the separations shown here the air was added by sparging because the authors wanted to study the problem in detail. Therefore the quenching effect can be expected to be lower than that found here because the mobile phase is usually not saturated with air. However, without degassing the situation is out of control. For this separation of A vitamins, the intensity of the signals in the air-sparged eluent was approximately two thirds of that using helium-sparged conditions.
Chromatographic Conditions
|
Sample: |
vitamin A esters (13-cis-A-palmitate, all-trans-A-palmitate, all-trans-A-acetate) |
|
Column: |
4.6 mm × 15 cm |
|
Stationary phase: |
Alltech Econosphere Silica, 3 µm (silica) |
|
Mobile phase: |
hexane with 3% diisopropyl ether, 0.04% acetic acid and 0.02 mg mL−1 α-tocopherol, 1.5 mL min−1 |
|
Detector: |
fluorescence 330 nm/470 nm |
|
Reference: A.S. van Brakel, A.R. Matheson and A.K. Hewavitharana: J. Chromatogr. Sci. 35 (1997) 545 |
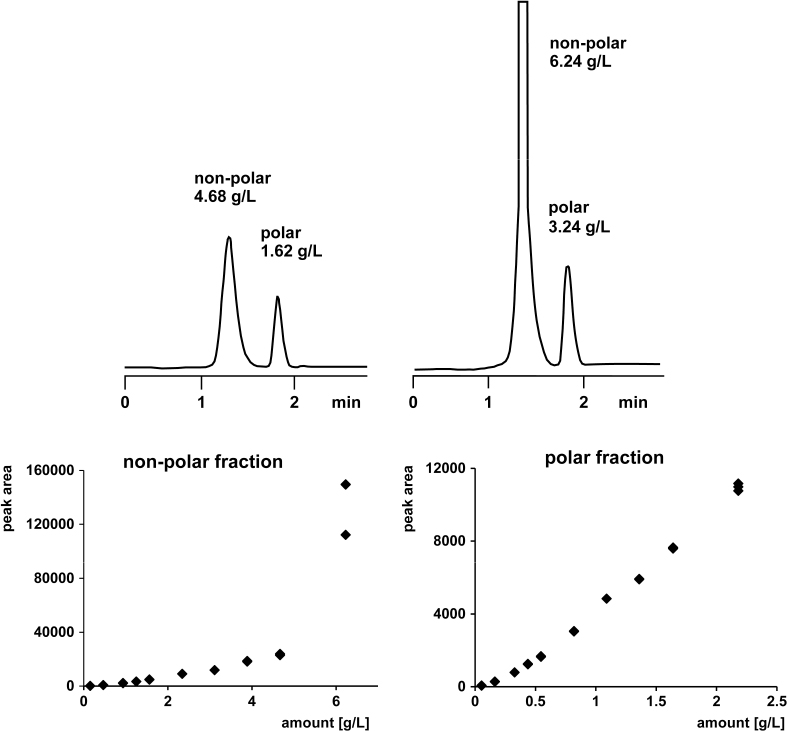
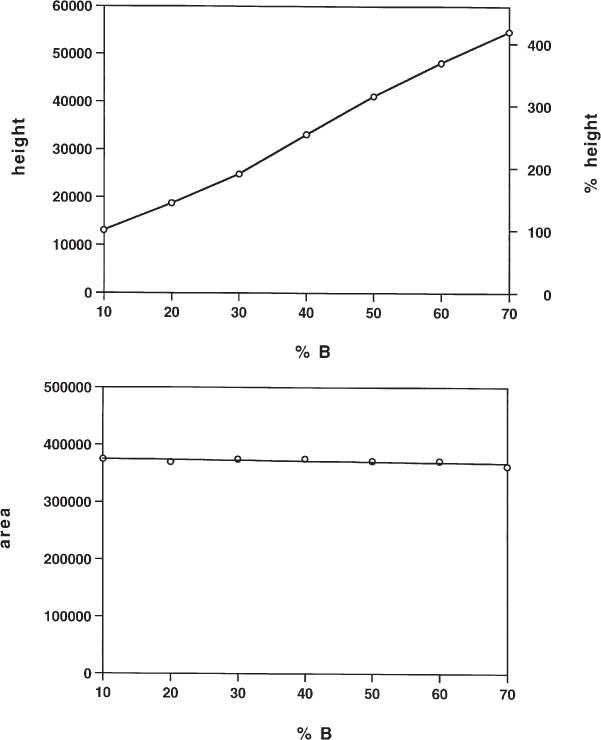
2.43 Detector Overload in UV
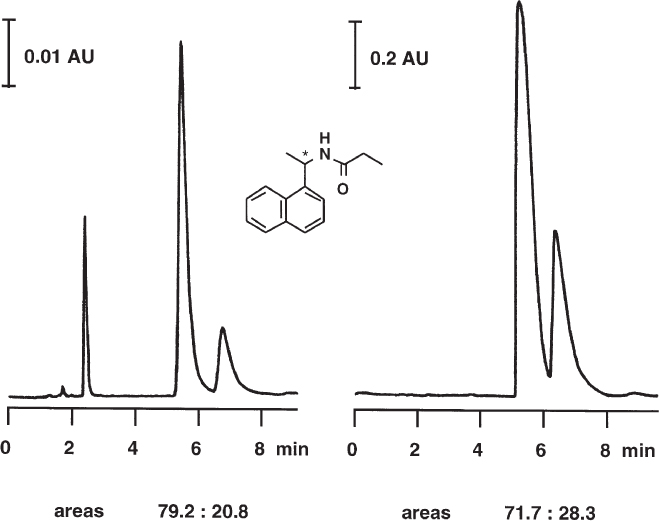
The detector response curve ( → 1.17) shows that the signal of an analyte is too small if detection takes place above the linear range. The analytical result is inaccurate to a lower or higher degree depending on whether the signal is still within the dynamic range or beyond it. To avoid this it is necessary to dilute standard and sample solutions adequately.
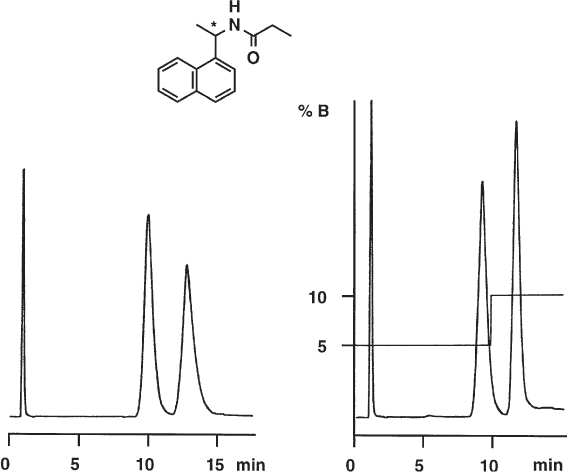
The example shows the separation of the enantiomers of 1-(1-naphthylethyl)propylamide on a chiral stationary phase. For the diluted solution (left) the integrator found an area ratio of 79.2 : 20.8. If a concentrated solution of the same mixture of enantiomers is injected (with attenuated detector signal) an unusual shape is observed for the large peak (right); it is not narrow but much too broad. The shape is also not of the type such as arises from severe tailing. In principle the peak should be much higher but the detector cannot register its true height and, therefore, neither its true area because the large mass of compound within the detector cell absorbs the light almost totally. The integrator calculates an area ratio of 71.7 : 28.3, a severe deviation from the accurate value found previously.
Chromatographic Conditions
|
Sample: |
(R,S)-1-(1-naphthylethyl)propylamide dissolved in mobile phase |
|
Column: |
4.6 mm × 25 cm |
|
Stationary phase: |
Chiral (R)-DNBPG, 5 µm (dinitrobenzoylphenylglycine, chiral phase) |
|
Mobile phase: |
hexane/isopropanol 8 : 2, 1 mL min−1 |
|
Detector: |
UV 254 nm |
|
Reference: V.R. Meyer |
2.44 Detector Overload in ELSD
The response function of an evaporative light scattering detector ELSD is not linear (or linear over a narrow range only). A typical calibration graph is shown at the bottom right (polar fraction). It was fitted by the function y = 1100 x2 + 2797 x − 122. Such a quadratic equation is less convenient than a linear one, but its use poses no problem. However, the range between quadratic response and detector overload is narrow with an ELSD, see the graph at the bottom left (non-polar fraction). The peaks resulting from too large a sample amount have a huge chimney-like shape and their areas do not fit into the calibration function as is evident from the data points at 6 g/L.
The separation shown here is for the quantification of oxidized triglycerides in chip fat (giving a rotten taste). On a nitrile stationary phase the non-polar analytes, present in excess, are eluted before the polar ones. Their quantitative analysis is only possible up to a concentration of approx. 5 g/L. On the left there is a chromatogram within the calibration range, the right one shows a sample with too high a concentration of the non-polar amount, resulting in a chimney peak.
Chromatographic Conditions
|
Sample: |
chip fat, diluted with diethyl ether and hexane, 10 µL |
|
Column: |
4 mm × 3 cm (a longer column would separate the individual triglycerides) |
|
Stationary phase: |
Nucleosil 110-10 CN, 10 µm (nitrile) |
|
Mobile phase: |
A: hexane |
|
|
B: hexane/ethanol/water 50 : 49 : 1 |
|
Gradient: |
from 0 to 100% B during the interval between 0.5 and 2.2 min; 1 mL min−1 |
|
Temperature: |
10 °C |
|
Detector: |
ELSD |
|
Reference: D. Baumann, Amt für Lebensmittelsicherheit und Tiergesundheit Graubünden, Chur, Switzerland |
|
See also:T. Zhang, D. Nguyen and P. Franco: J. Sep. Sci. 29 (2006) 1517 |
2.45 Influence of the Retention Factor on Peak Height
Under isocratic conditions the later a peak is eluted the broader it is, i.e. the higher its retention factor k. As a consequence its height decreases if the amount of sample remains constant. The k value depends on the composition of the mobile phase and increases with decreasing eluent strength, e.g. in a reversed-phase system with decreasing amount of organic solvent.
This means that the peak height depends strongly on the composition of the mobile phase whereas the peak area is not influenced (although exceptions are possible in very special cases ( → 2.10)). For quantitative analyses based on peak heights a constant eluent composition must be guaranteed. This is also true for gradient separations: now the gradient profile needs to be reproduced exactly ( → 2.50).
Some reasons for fluctuations in mobile phase composition:
–The solvent with the lower boiling point evaporates from a bottle of mixed eluent.
–In a gradient system (which can also be used for isocratic separations) the mixing ratio is not (or is no longer) correct because of instrument problems.
–When mixing solvents with pronounced volume contraction, such as methanol and water, the analysts do not always follow the same procedure ( → 2.1). The best method is to measure both components individually and to mix them afterwards in the reservoir flask.
Chromatographic Conditions
|
Sample: |
10 µg of phenol dissolved in water/methanol 1 : 1 |
|
Column: |
3.2 mm × 25 cm |
|
Stationary phase: |
Spherisorb ODS, 5 µm (reversed phase C18) |
|
Mobile phase: |
water/methanol, 1 mL min−1 |
|
Detector: |
UV 254 nm |
|
Reference: V.R. Meyer |
|
See also: S.R. Bakalayar and R.A. Henry: J. Chromatogr. 126 (1976) 327 |
2.46 Influence of the Flow Rate on Peak Area
Most detectors used in HPLC measure the concentration of the analyte in the detector cell – they are concentration-sensitive. The most common example is the UV detector whose signal follows the Lambert-Beer law:

(There are also mass-sensitive detectors in use such as the flame ionization detector of GC; these measure a mass flow, in this case the number of ions per unit time.)
When a peak reaches the cell of a concentration-sensitive detector its width is equal to its residence time whereas its height is governed by the analyte concentration at the peak maximum. These two parameters are independent of each other. As a consequence, the peak area depends very strongly on the flow rate of the mobile phase. For quantitative analyses based on peak areas high flow constancy of the pump must be guaranteed.
As can be seen from the lower graph the peak height also depends slightly on the flow rate. This is a result of the dependence of the separation performance on the linear flow rate ( → 1.5). The higher the theoretical plate number of a column the narrower, and thus higher, the peak will be. Here a flow rate of 0.3 mL min−1 was still above the van Deemter minimum (the reduced flow rate, v, was approximately 7).
Chromatographic Conditions
|
Sample: |
10 µg of phenol dissolved in mobile phase |
|
Column: |
3.2 mm × 25 cm |
|
Stationary phase: |
Spherisorb ODS, 5 µm (reversed phase C18) |
|
Mobile phase: |
water/methanol 1 : 1 |
|
Detector: |
UV 254 nm |
|
Reference: V.R. Meyer |
|
See also: S.R. Bakalayar and R.A. Henry, J. Chromatogr. 126 (1976) 327 |
2.47 Leaks in the HPLC Instrument
Leaks in the instrument can influence the chromatogram by multifarious and surprising means. Of course nobody works intentionally with leaky fittings but this does not diminish the danger of this source of error.
Here at three different positions in the instrument a leak of approximately 50% was created, i.e. the flow in each was reduced from 1 mL min−1 to 0.5 mL min−1 by loosening the appropriate fitting. Such large leaks provoke distinct changes in the chromatogram, which illustrate the effects. With a small leak the consequences are less severe yet large enough to lead to inaccuracies in retention times, peak heights, peak widths or peak areas.
| A: |
No leak. |
| B: |
Leak between pump and injector. The flow rate is reduced which gives broader peaks ( → 2.46). The present situation with regard to the van Deemter curve ( → 1.5) gives rise to increased peak heights. The peak areas increase. |
| C: |
Leak between pump and injector. The flow rate is reduced which gives broader peaks ( → 2.46). The present situation with regard to the van Deemter curve ( → 1.5) gives rise to increased peak heights. The peak areas increase. |
| D: |
Leak between column and detector. In principle the chromatogram remains unaltered because the detector measures the concentration and not the mass. Solely the early-eluting, narrow peaks become broader and thus less high because their volume is now too small in relation to the detector cell volume (note the peak height ratios!). |
Chromatographic Conditions
|
Sample: |
thiourea, acetone, and methy ethyl ketone dissolved in mobile phase |
|
Column: |
4.0 mm × 10 cm |
|
Stationary phase: |
Nucleosil 5 C18, 5 µm (reversed phase C18) |
|
Mobile phase: |
water/methanol 7 : 3, 1 mL min−1 |
|
Detector: |
UV 280 nm |
|
Reference: V. R. Meyer, see also V.R. Meyer: J. Chromatogr. A 767 (1997) 25 |
2.48 Impairment of Precision as a Result of Noise
It has already been mentioned that for quantitative chromatographic analysis a signal-to-noise ratio S/N of 10 or more is usually required ( → 1.18). In a study it was, however, found that S/N must be higher than 50 if a relative standard deviation (= standard deviation/mean) of the peak areas of less than 2% was required (other sources of error which would also affect the precision could be excluded in this study). Although these data were obtained for a particular analytical problem, the determination of chlorthalidone, the assertion is generally valid. The curve presented in the graph matches many HPLC methods, which means that quantitative analysis should not be attempted if S/N is lower than 50 (otherwise the number of injections per sample should be increased). Only the lower x axis of the graph, which gives the amount of sample injected, is not generally valid.
Chromatographic Conditions
|
Sample: |
chlorthalidone (k ≈ 2), sample volume 10 µL |
|
Autosampler: |
Perkin-Elmer ISS-200 |
|
Column: |
4.6 mm × 3.3 cm |
|
Stationary phase: |
Reduced Activity C18, 3 µm (reversed phase C18) |
|
Mobile phase: |
water/methanol/acetic acid 65 : 34 : 1, 1.5 mL min−1 |
|
Temperature: |
30 °C |
|
Detector: |
UV 235 nm |
|
Data: |
relative standard deviations from 8 analyses each |
|
Reference: M.W. Dong: Views, Perkin-Elmer Newsletter, Fall 1994, p. 7 |
|
See also: C. Meyer, P. Seiler, C. Bies, C. Cianculli, H. Wätzig and V.R. Meyer: Electrophoresis 33 (2012) 1509 |
2.49 Determination of Peak Area and Height at High Noise
Integrators and data systems can be misleading as they perform quantitative analysis always with peak areas, whereas the determination of peak heights is often less prone to error (the most important exception being inconstancy of k values, → 2.45). For low signal-to-noise ratios the determination of peak heights is more precise.
The example shows a separation with such high noise that the precision is not satisfactory for analysis of the large peak and is unacceptably low for the small peak. The signal-to-noise ratios are approximately 17 for the (R)-amide and 3 for the (S)-enantiomer. In both cases height determination is markedly more precise (or less imprecise) than area determination and is, therefore, recommended. The data obtained for the areas fit well into the curve of M.W. Dong which gives the relationship between the relative standard deviation and the signal-to-noise ratio ( → 2.48).
Chromatographic Conditions
|
Sample: |
(R,S)-1-(1-naphthylethyl)propylamide dissolved in mobile phase |
|
Column: |
4.6 mm × 25 cm |
|
Stationary phase: |
Chiral (R)-DNBPG, 5 µm (dinitrobenzoylphenylglycine, chiral phase) |
|
Mobile phase: |
hexane/isopropanol 8 : 2, 1 mL min−1 |
|
Detector: |
UV 254 nm |
|
Integrator: |
Hewlett-Packard 3390 A |
|
Data: |
means and standard deviations from 5 analyses |
|
Reference: V.R. Meyer |
2.50 Peak Height Ratios
It seems to be a matter of course for quantitative analyses that a calibration curve is established. There is in principle just one single exception to this rule: Enantiomer ratios may be determined without calibration if the chiral compounds are not derivatized to diastereomers and if quantitation is performed by peak area. The procedure can be used for isocratic and gradient separations as well. (If, however, high accuracy is needed it is necessary to check this approach carefully with calibration standards.)
In contrast to peak area determinations it is not permissible to perform quantitative analyses without a calibration curve if peak heights are used, not even with enantiomers. Under isocratic conditions the peaks become broader with increasing retention time, and thus also less high, as shown in the chromatogram to the left. The effect can be less pronounced than in the example but it is always present. With gradient separations it is not possible to predict the peak height ratio; the second peak of a racemate can be smaller, equally high by chance or even higher, depending on relative retention and gradient profile. For the chromatogram to the right the gradient step was positioned intentionally at the appropriate retention time, which caused the second peak to be narrower and, therefore, also higher than the first.
Thus peak height determination for quantitative analysis is only possible in combination with an accurate calibration curve, even for enantiomers.
Chromatographic Conditions
|
Sample: |
racemic 1-(1-naphthylethyl)propylamide and toluene (t0 peak) |
|
Column: |
2.1 mm × 12.5 cm |
|
Stationary phase: |
Nucleosil 5 NH2 with ionically bound (R)-DNBPG, 5 µm (dinitrobenzoylphenylglycine, chiral phase) |
|
Mobile phase: |
hexane/isopropanol, 0.5 mL min−1 |
|
|
left: 95 : 5 isocratic |
|
|
right: step gradient from 5 to 10% isopropanol after 10 min |
|
Detector: |
UV 254 nm |
|
Reference: V.R. Meyer: J. Chromatogr. 623 (1992) 371 |
2.51 Incompletely Resolved Peaks
Incompletely resolved peaks always give rise to inaccurate area integration. This error is often ignored or underestimated because ‘only’ the accuracy is affected but not the precision, and therefore the analyst does not become aware of it.
The graph shows two pairs of overlapping peaks. The contours of the individual peaks are visible, which is not the case with real chromatograms. In reality both man and computer only see the sum curve which is drawn here with a bold line. During the integration the data system identifies the lowest point between the peaks and divides them (usually) with a vertical drop. The areas left and right of this line belong then to the left and right peaks, respectively. From the drawings it becomes clear that this area separation is wrong, with only a few special cases being exceptions. Let us look at the situation with regard to the second peak:
With a vertical drop the second peak wins the additional area which is marked in black, but it loses the hatched part. If the peaks have Gaussian (symmetrical) shape the hatched area is larger than the black one and the total area is too small. In the case of tailing, which is common in chromatography, the relationship is reversed and the integrated area is too large.
The large peak also is not integrated accurately; in the upper chromatogram its area is too large, in the lower one it is too small. Yet its relative error is lower; the absolute areas which belong to the wrong peak are identical for both peaks (with opposite sign) but the effect is less severe for the large one.
These errors are purely geometrical in nature and do not depend on the integrator or data system used. Peak deconvolution software packages are commercially available but in any case it is better to optimize a separation for high resolution than to perform correcting calculations afterwards.
Conditions
|
Gaussian: |
area ratio 3 : 1, resolution 1.0. Area of the small peak is 97% of true |
|
Tailing: |
a tailing b/a of 1.5 ( → 1.2) was overlaid on the same peaks. Area of the small peak is 115% of true |
|
See also: V.R. Meyer: LC GC Int. 7 (1994) 590 |
2.52 Area Rules for Incompletely Resolved Peaks
The errors which occur in the determination of the areas of incompletely resolved peaks can be described qualitatively in a very simple manner. No more than the following rules need to be known:
With Gaussian (symmetrical) peaks the large peak is too large, the small one is too small, irrespective of the order of elution.
With tailing peaks the first peak is too small, the second one is too large, irrespective of the size ratio.
The ratio of the relative errors is inversely proportional to the peak area ratio, i.e. small peaks are affected more strongly. For an area ratio of, e.g., 10 : 1 the percentage error is ten times greater for the small peak than for the large one.
The errors increase with decreasing resolution and with increasing tailing. The larger the difference between the sizes of the peaks, the greater the relative error becomes for the small peak and the less it becomes for the large one.
Conditions
Area ratio 1 : 3 and 3 : 1, respectively
Resolution of the Gaussian peaks 1.0
Tailing b/a of the asymmetric peaks 1.5
See also: V.R. Meyer: J. Chromatogr. Sci. 33 (1995) 26
2.53 Areas of a 1 : 10 Peak Pair
The graph presents the areas, as found by an integrator, of the small peaks of a poorly resolved pair of size ratio 1 : 10 or 10 : 1, respectively. On the x axis the resolution of the two peaks runs from 2.0 to 0.8 with the small peak eluted before the large one in the left half of the graph and vice versa in the right half. The small drawings show the pairs with certain resolution, without tailing, however. The y axis indicates the areas found in integrator counts if the peaks are separated by a vertical drop at the deepest point between them. (With another type of integrator the numbers on the y axis would be different but the curves would be identical.) The horizontal line in the middle of the graph shows the true area of the small peak. Different degrees of asymmetry (of both peaks), determined as tailing b/a ( → 1.2) were investigated. The empty space in the middle of the graph represents the conditions where the integrator was no longer able to differentiate between the two peaks.
As discussed previously the area of the small peak is too small for symmetrical peaks ( → 2.52); the unbroken line with b/a = 1.0 drops from the true area to smaller values with decreasing resolution. With tailing (b/a > 1.0) the integrated area is too small if the small peak is eluted first and too large if it is eluted last. It can be seen that even a resolution of 2.0 is not high enough if the small peak lies behind the large one and if the peaks tail, as is common in most HPLC separations.
For the large peak the errors are ten times smaller and have the opposite sign.
For quantitative analysis of peak areas the resolution must be reasonably (!) high. The resolution must be higher the more extreme is the size ratio of the peaks.
|
Reference: V.R. Meyer: LC GC Int. 7 (1994) 94 or LC GC Mag. 13 (1995) 252 |
2.54 Heights of a 1 : 10 Peak Pair
For the same peak pair with a size ratio of 1 : 10 or 10 : 1, respectively, the height of the small peak instead of the area ( → 2.53) is now considered. The integrator separated the two peaks by a vertical drop at the deepest point between them. For this problem no ‘generally true’ peak height can be indicated because the peak becomes smaller and smaller with increasing tailing if the area remains constant; therefore this graph has no horizontal line in the middle.
It becomes obvious that in the case of tailing (of both peaks although in principle only the shape of the first one is of importance) the small peak must not be eluted after the large one if the resolution is not large enough. ‘Enough’ means that the baseline must be really reached between the peaks. With stronger tailing better resolution is necessary. The curves on the right side of the graph make clear that ‘rider peaks’ on the slowly falling trailing edge of a large peak cannot be quantitated accurately; this is also true for their area determination ( → 2.55). In contrast to this the quantitative analysis is accurate or has only a minor error if the small peak is eluted in front of the large one and if its height is measured. Even with resolution which is at the limit of peak recognition, here as low as 0.8, the error is small.
Reference: V.R. Meyer: LC GC Int. 7 (1994) 94 or LC GC Mag. 13 (1995) 252
2.55 Quantitative Analysis of a Small Peak
Without calibration under ‘real’ conditions it is impossible to quantitate a small peak which sits on a large one. ‘Real’ conditions means here that the standard solutions used for the calibration curve contain all the components in the typical concentrations at which they are present in the sample and which influence the quantitative analysis by peak overlap, as shown here, or by any other effects.
The figure shows the quantitative analysis of 2,3-dimethylphenol, which is eluted on the tail of the 2,3-xylidine peak. Injected as a pure compound (top) 0.8 µg of dimethylphenol gives a peak area of 0.405 mV min and a height of 2.51 mV. In the presence of 80 µg of xylidine (middle) the question arises which method is best for the quantitative analysis of the small rider peak. The peak borders can be drawn by vertical lines or by means of a tangent, the peak size can be determined by area integration or by measurement of height.
It is found that no method gives an accurate result.
| Vertical drop, area: |
0.893 mV min = 220% |
| Vertical drop, height: |
4.03 mV = 161% |
| Tangent, area: |
0.333 mV min = 82% |
| Tangent, height: |
2.26 mV = 90% |
With slightly better resolution, which would bring the small peak to a lower position on the xylidine tail, other results would be obtained. Nevertheless it can be stated as a general rule that the vertical drop method, applied to rider peaks, gives values which are too high. In this case even two vertical drops were drawn; an integration down to the peak end would result in a much greater area. The widely used tangent method generally yields values which are too small, not only with this separation problem!
Chromatographic Conditions
|
Sample: |
80 µg of 2,3-xylidine and 0.8 µg of 2,3-dimethylphenol |
|
Column: |
4.0 mm × 25 cm |
|
Stationary phase: |
LiChrospher 60 RP Select B, 5 µm (reversed phase C8) |
|
Mobile phase: |
water/methanol 33 : 67, 1.5 mL min−1 |
|
Detector: |
UV 280 nm |
|
Reference: V.R. Meyer, see also V.R. Meyer: Chromatographia 40 (1995) 15 S. Jurt : J. Chromatogr. A 929 (2001) 165 |
2.56 Incompletely Resolved Peaks with Tailing
Most peaks of real chromatograms are not symmetrical but show some tailing. With inadequate resolution this leads to wrong apparent peak heights. For us observers as well as for the data system only the sum curve is visible and not the individual peak contours.
The graph shows two identical peaks with tailing b/a = 1.5 ( → 1.2) in the upper half. Although the resolution does not go down to the baseline it is good enough to present both signals with identical heights. In the chromatograms below the resolution is much poorer, either because of broader peaks (the theoretical plate number N is smaller) or because of a decrease in the relative retention (separation factor α). The same effect could be observed with a strong increase of the peak tailing, e.g. as a result of column ageing: the second peak is definitely higher than the first one because it sits on its broad tail. The relative heights which were initially 1 : 1 now are 1 : 1.09 in both cases. This ratio depends on the individual circumstances, of course.
Likewise peak areas cannot be determined accurately if the integrator divides the peaks by a vertical drop at the lowest point between them ( → 2.51, 2.52). The integrated area ratio changes from the initial value of 1 : 1.03 (due to incomplete resolution) to 1 : 1.3 in both cases.
2.57 Integration Threshold and Number of Detected Peaks
Not only the detector range ( → 2.59) but also the integrator threshold can strongly influence the analytical result. By the selection of a certain threshold value the analyst defines the positive deviation from the baseline, which will be recognized by the data acquisition as the starting point of a peak. If the threshold, measured in millivolts, is set high above the baseline, small signals will not be recognized as peaks and will not be integrated. For the analyst it can be difficult to choose the proper threshold: if it is too low, noise “peaks” will also be detected, if it is too high, the small true peaks will be lost. It can be necessary to indicate both the type of data system and the chosen threshold in the standard operating procedure ( → 3.13).
When analyzing a reactive textile dyestuff (a technical product with many by-products), it was found that the number of peaks which were detected by the data system was strongly dependent on the threshold value. This parameter could be selected on a scale from −12 (sensitive) to + 4 (not sensitive). With regard to the integration parameters this method is not rugged ( → 1.14).
Chromatographic Conditions
|
Sample: |
Cibacron Red C-2G in water |
|
Column: |
4.0 mm × 12.5 cm |
|
Stationary phase: |
ODS-Hypersil, 5 µm (reversed phase C18) |
|
Mobile phase: |
water/acetonitrile with 28% methanol, 0.4 g L−1 tetrabutylammonium perchlorate and sodium citrate, pH 6.2, gradient from 10 to 90% acetonitrile, 1 mL min−1 |
|
Detector: |
UV 254 nm |
|
Reference: Y.L. Grize, H. Schmidli, and J. Born: J. Chromatogr. A 686 (1994) 1 |
2.58 Detector Time Constant and Peak Shape
The time constant of an electronic device is the time which is needed by an incoming rectangular signal to reach 63% of its height. Electronic data processing distorts all signals because of this inevitable delay. Since a detector is built up from numerous electronic parts some minimum distortion is always happening. In addition, the time constant of a detector used in the laboratory can be selected over a wide range. A small (perhaps too small) time constant allows the true peak shape to be represented as well as the noise. An increase in the time constant distorts the peaks and smooths the noise. Although the peak area remains constant the tailing increases and the peak height decreases.
Peak data for hexylbenzene/octylbenzene:
Chromatographic Conditions
|
Sample: |
hexylbenzene and octylbenzene in mobile phase |
|
Column: |
4.0 mm × 12.5 cm |
|
Stationary phase: |
LiChrospher RP-18, 5 µm (reversed phase C18) |
|
Mobile phase: |
water/methanol 90 : 10, 1 mL min−1 |
|
Detector: |
UV 250 nm (Merck LaChrom) |
|
Reference: D. Stauffer, Hoffmann-La Roche AG, Basel, Switzerland |
2.59 Quantitative Analysis in the 99% Range
For content analyses of, e.g., intermediates from synthesis or pharmaceutical end-products an HPLC separation is often demanded. A common assay is to add all peak areas or heights, as integrated at a certain wavelength, and to equate the sum to 100% (being aware that the various compounds have their individual absorbances); the purity of the analyte as determined by this method must then be higher than 99% or the like.
The height of the small peaks, and thus their detectability, now depends strongly on external parameters: the detector range chosen, the integration parameters, and the signal-to-noise ratio, which itself depends on the amount of sample injected. In addition the main peak might be so large that it exceeds the linear range of the detector ( → 1.17, 2.43) and cannot be integrated accurately. The approach is unfavorable and not recommendable; high-low chromatography is to be preferred ( → 3.7). If a data system is used it is, in fact, possible to set the integration limits manually (with the danger of subjectivity) after the separation; this is not possible with an integrator.
For this example two different detector ranges were used whereas all the other parameters remained unchanged. This gave a main peak ‘purity’ of either 100% or 98.9%. But even the latter content is certainly not accurate because the peaks overlap ( → 2.51) and some of the by-products of lowest concentration are not integrated at all.
Chromatographic Conditions
|
Sample: |
10 µL solution of vitamin B12 derivative in mobile phase |
|
Column: |
3.2 mm × 25 cm |
|
Stationary phase: |
LiChrosorb SI 60, 5 µm (silica) |
|
Mobile phase: |
hexane/dichloromethane/isopropanol 8 : 2 : 1, 1 mL min−1 |
|
Detector: |
VIS 360 nm, 0.1 and 0.5 AU, respectively |
|
Integrator: |
Hewlett-Packard 3390 A |
|
Reference: V. R. Meyer |
2.60 Correlation Coefficient of Calibration Curves
The correlation coefficient, r, represents how well a calculated calibration curve fits the experimental data points. The maximum value is 1.0; attempts are always made to reach this value. Because the calibration curve should be linear, its usual representation is y = ax + b, where x stands for the pre-set data, such as concentrations, and y means the found data, such as peak areas or heights.
It is not advisable to obtain the correlation coefficient from the computer without having a look at the curve. The upper graph shows data with an unambiguous trend which is best described by a quadratic equation (upper right); the function is not straight but curved. However, the deviations are small enough to give a correlation coefficient of 0.999 with linear fit. The lower example shows a data set with commonly observed scatter – some points are too high whereas others are too low, but there is no trend. The correlation coefficient is again 0.999. Now the linear fit is correct ( → 3.5).
Of course it is not advisable to fit each set of data with a polynomial (of any degree). Before doing so it is necessary to explain the reason for the deviation from linearity. The goal should always be to obtain linear relationships.
Data:
| x |
y top |
y bottom |
| 0 |
|
|
| 1 |
1.2 |
1.2 |
| 2 |
2.1 |
1.9 |
| 3 |
3.0 |
3.0 |
| 4 |
3.9 |
4.1 |
| 5 |
4.8 |
4.8 |
| 6 |
5.9 |
6.1 |
| 7 |
7.0 |
7.0 |
| 8 |
8.1 |
7.9 |
| 9 |
9.2 |
9.2 |
| 10 |
10.3 |
9.7 |

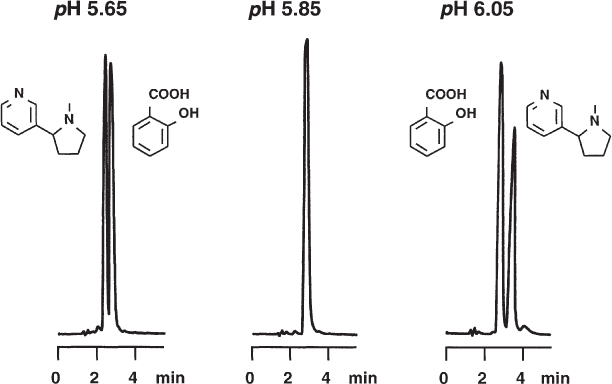
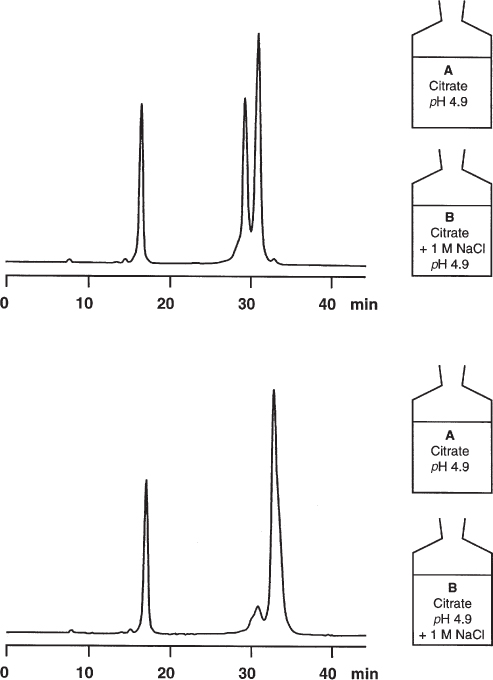


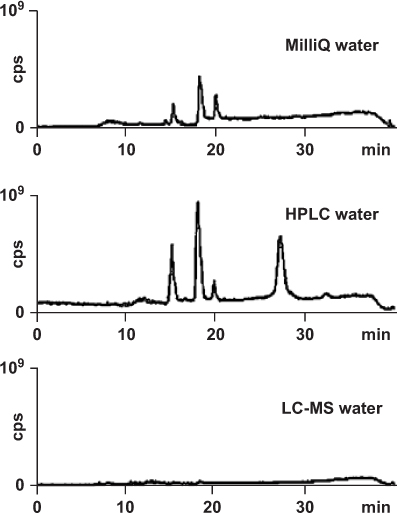
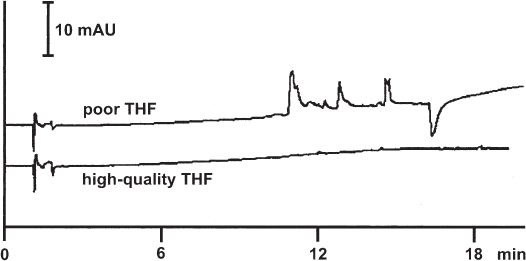
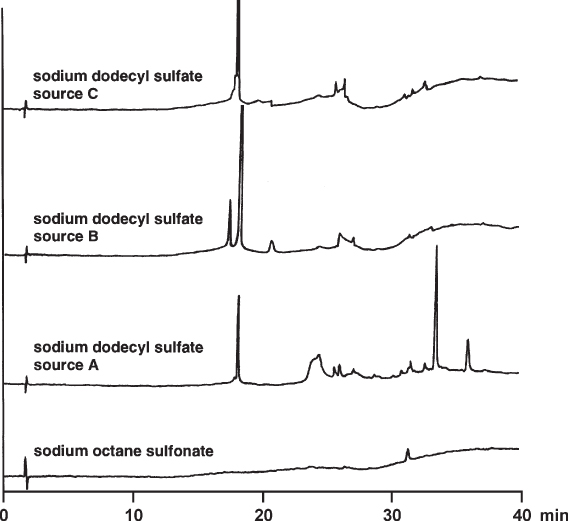
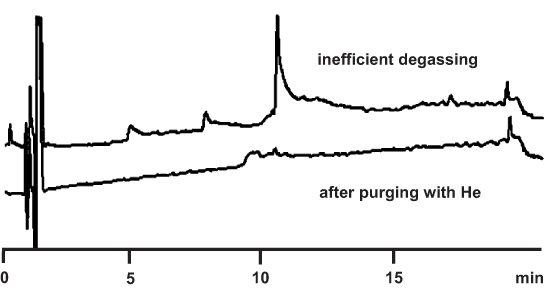
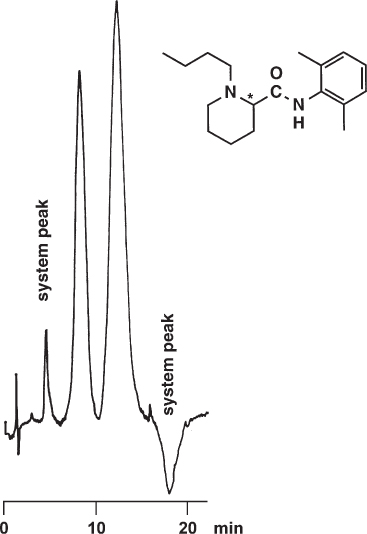
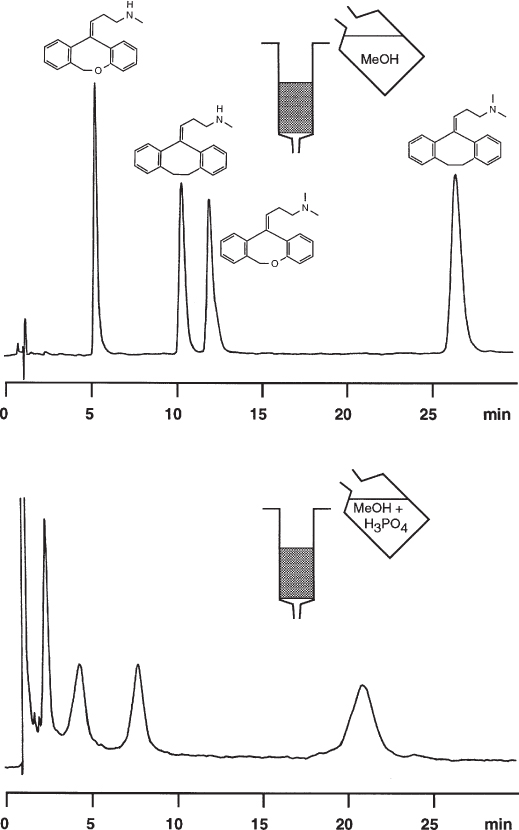
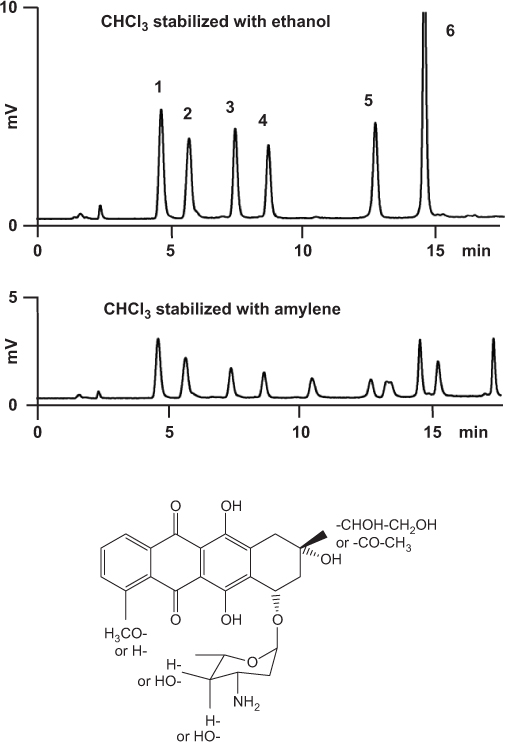
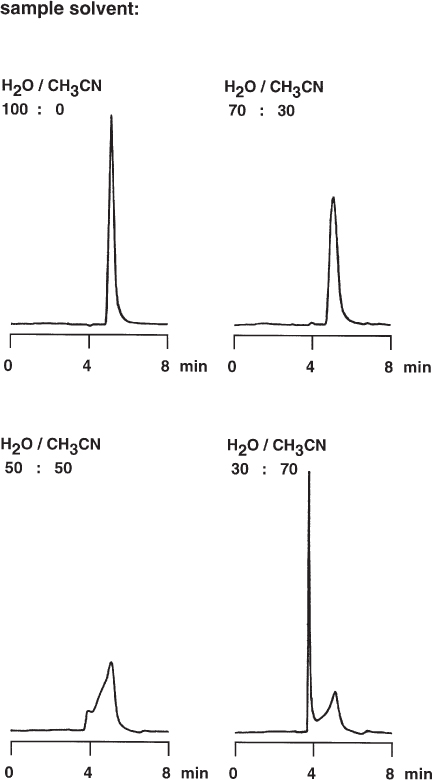

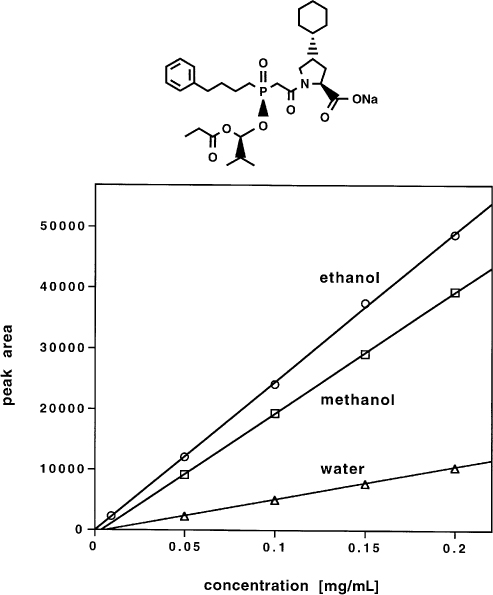
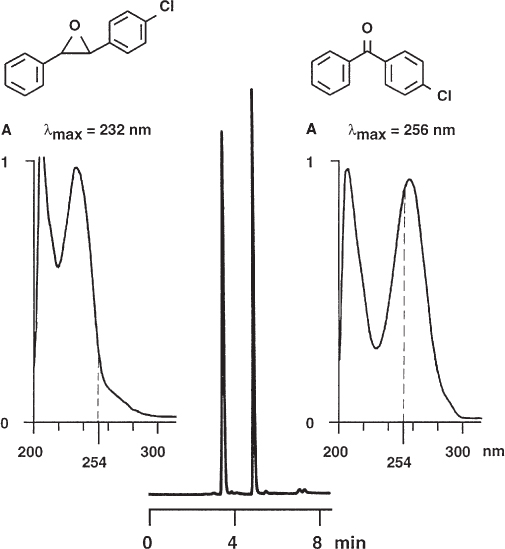
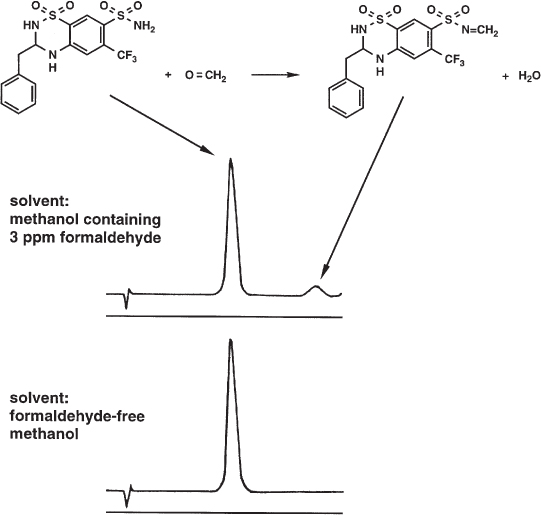
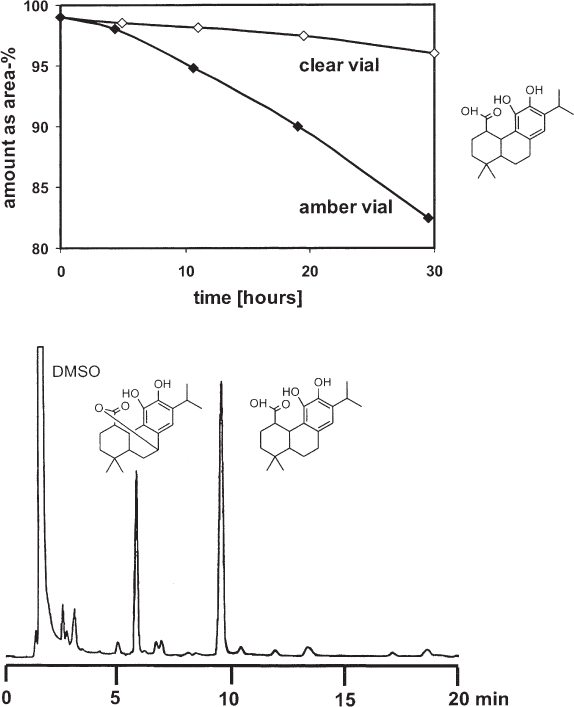
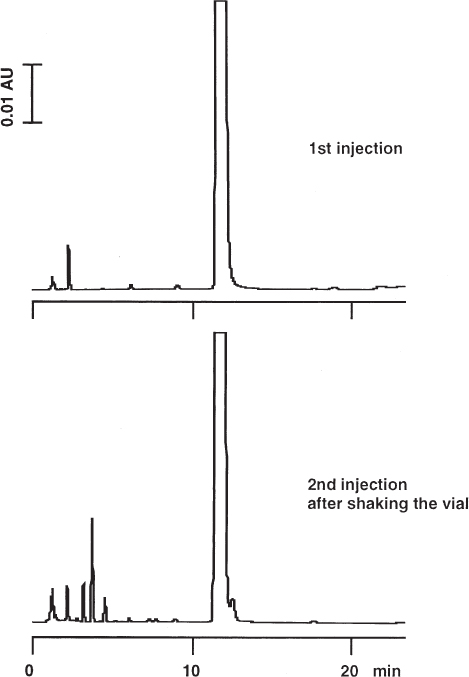
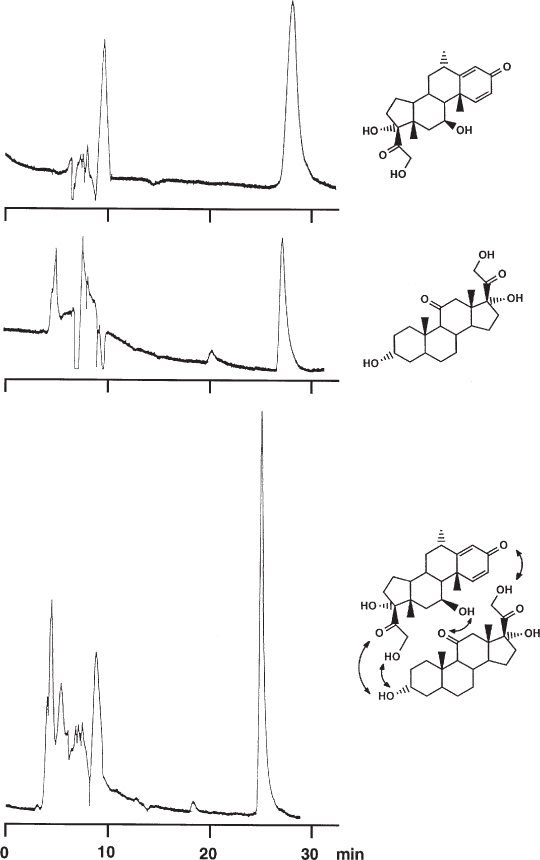
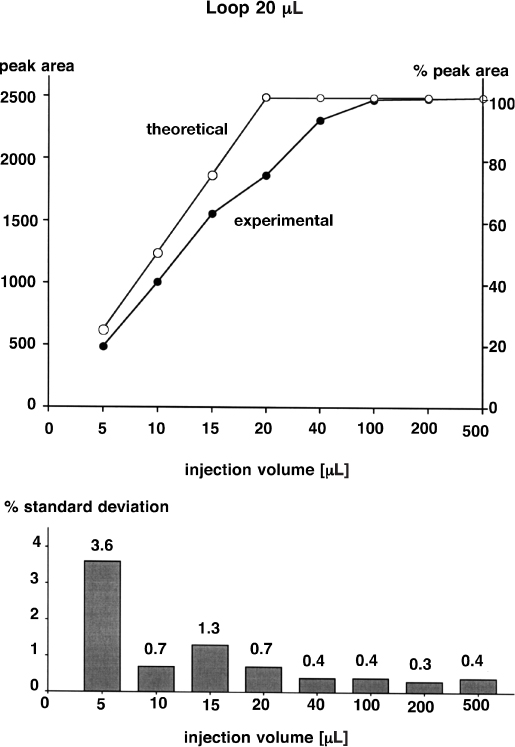
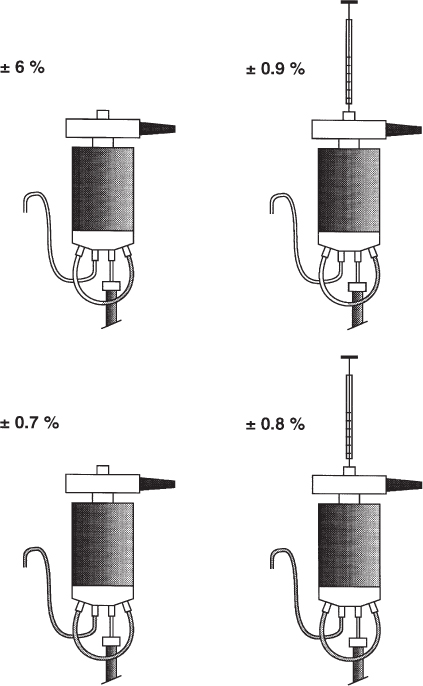
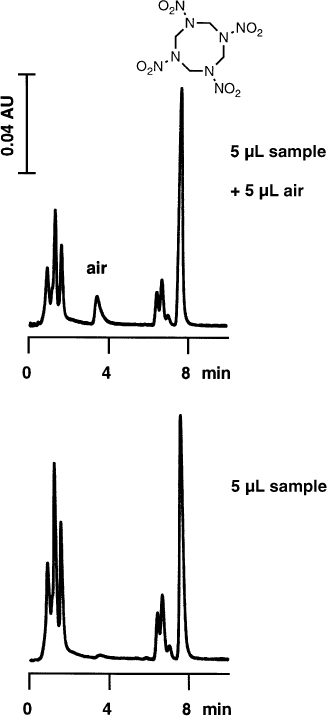
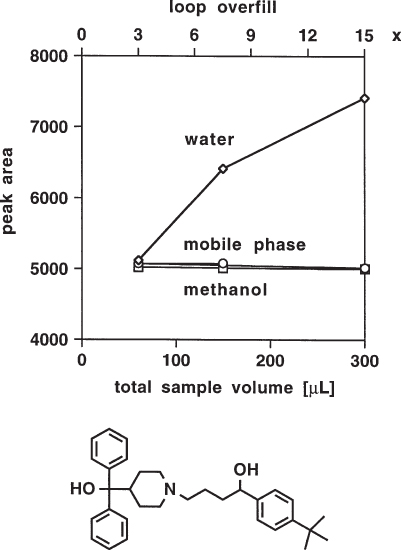
 . It is not really detrimental to use a capillary of double length if this is necessary because of the use of a short column. On the other hand, replacement of 0.25 mm capillary by one of 0.5 mm inner diameter can affect the chromatogram as the example shows, even when a column of moderate performance is used. Peaks with small retention factors thereby undergo more broadening than later eluted ones.