CHAPTER 1
Example of How to Trade a Reversal
When traders enter a reversal trade, they are expecting the pullback from the trend to be large enough for a swing trade, or even a trend in the opposite direction. The entry, protective stops, and profit taking are then the same as for any other swing or trend trade, and were discussed in the first two books. Since traders are expecting a large move, the probability of success is often 50 percent or less. In general, when risk is held constant, a larger potential reward usually means a smaller probability of success. This is because the edge in trading is always small, and if there was a high probability of success, traders would neutralize it quickly and it would disappear within a few bars, resulting in only a small profit. However, since a trend reversal trade may have a reward that is several times larger than the risk, it can have a profitable trader’s equation.
Trading a reversal is much more difficult than it appears when a trader looks at a chart at the end of the day. Once there has been a strong break of the trend line and then a reversal on the test of the trend’s extreme, a trader needs a strong signal bar. However, it usually comes in a very emotional market at a time when beginning traders are still thinking that the old trend is in effect. They also probably lost on several earlier countertrend trades in the day and don’t want to lose any more money. Their denial causes them to miss the early entry. They then wait to evaluate the strength of the follow-through. It is usually in the form of a large, fast spike made of several strong trend bars, forcing the traders to quickly decide whether to risk much more than they usually do. They often end up choosing to wait for a pullback. Even if they reduce their position size so that the dollar risk is the same as with any other trade, the thought of risking two or three times as many ticks frightens them. Entering on a pullback is difficult because every pullback begins with a minor reversal, and they are afraid that the pullback might be the resumption of the prior trend. They end up waiting until the day is almost over, and then finally decide that the new trend is clear; but now there is no more time left to place a trade. Trends do everything that they can to keep traders out, which is the only way they can keep traders chasing the market all day. When a setup is easy and clear, the move is usually a small, fast scalp. If the move is going to go a long way, it has to be unclear and difficult to take, to keep traders on the sidelines and force them to chase the trend.
FIGURE 1.1 Trading a Major Reversal
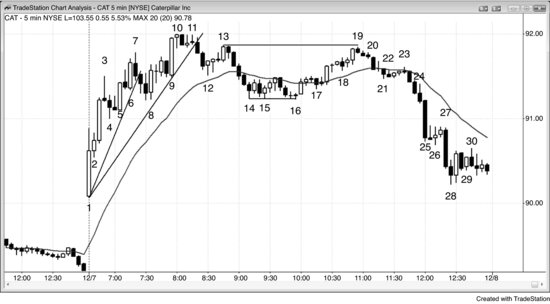
As shown in Figure 1.1, traders had several ways to trade the reversal in Caterpillar Inc. (CAT) today, and one that I think is worthwhile is an approach used by a friend. I had a lengthy discussion with this trader several years ago. He specializes in trading major reversals. He would usually take just one or two trades a day, and he always wanted to see a strong break beyond the trend line before looking for a reversal entry. For example, in a bull trend like this one, he would not have shorted below bar 3 because there was no prior break of a bull trend line. He would also not have shorted below the bar 7 reversal bar, because there was no prior significant break below a bull trend line. The sell-off below bar 3 lasted only one bar and did not even reach the moving average.
The three bear bars starting at bar 7 broke below the bull trend line, which was a sign of selling pressure, but the sell-off was not strong enough to reach the moving average. He would then have studied the rally that would test the bar 7 trend high. It was two-legged, which meant that there was some two-sided trading and therefore the bears showed some strength, and it was the third push up on the day. Since major reversals often occur in the first hour or so, he probably would have shorted below bar 11, which was a second entry short, but he probably would not have been expecting a major reversal. Since the day was a spike and channel bull at that point, the sell-off might have just tested the bar 4 start of the bull channel, where the market might have formed a double bottom and then rallied. Because the bull channel was a wedge (it had three pushes), it was likely to have two legs sideways to down. Since my friend is a swing trader, he would have allowed a pullback as long as he believed that his original premise was still valid. He would therefore have kept his stop above the signal bar, or maybe above the strong bear bar that followed bar 11, and allowed the pullback to bar 13, expecting a second leg down. If he had not yet shorted, he would have shorted below the bar 13 two-bar reversal and lower high major trend reversal, which was a breakout test of the short below bar 11.
The two bear bars after bar 11 would have made most traders wonder if the always-in position had flipped to down, and most would have decided that it was indeed down by the end of the five-bar bear spike that ended at bar 14. At this point, if he decided to hold short, he would have tightened his protective stop to just above the start of that bear spike that began after bar 13. More likely, he would have bought back most or all of his short position on the move above bar 16, since two legs down had taken place (the move to bar 12 was the first), bar 16 formed a double bottom with bars 14 or 15, and it was a third entry for a moving average gap bar long (its high was below the moving average and it was the first pullback after the strong rally to bar 10). If he bought back his shorts, he would have watched the rally from bar 16 to assess its strength relative to the sell-off to bar 16. If it was relatively weak, he would have looked to short again on a test of the bar 10 bull trend high. The test could have been in the form of a lower high, a double top, or a higher high.
The rally from bar 16 to bar 19 had three legs, and was therefore a wedge bear flag. Since it was a rally after a strong break below the bull trend line, it was likely to become part of a larger correction with at least one more leg down. The probability was that the market would form either a trading range or a trend reversal. The rally did not contain two consecutive strong bull trend bars, so the bulls were unable to regain control of the market. Bar 19 formed a double top with bar 13, and since this was now a possible bear trend, that was a double top bear flag, as well as a double top or lower high major trend reversal, when compared to the bar 10 top of the bull trend. Bar 19 was also a bear reversal bar, which is important when looking for a market top. This was the strongest trend reversal setup of the day, because the bear spike down to bar 14 convinced most traders that the always-in position was short and that the bears owned the market as long as the rally could not get above the top of the bear spike that began after bar 13. Many traders believed that as long as the market could not get above bar 13, the bears were still in control and the market might be forming a lower high in a possible new bear trend. Bears had their protective stops just above bar 13, because they wanted either a double top or a lower high, and if they got neither, they would exit and wait for another sell signal. Many bulls who bought between bars 10 and 13 held their longs through the sell-off to bar 16, to see how strong the bears were. They decided that the selling was strong (it broke the trend line and the moving average, and it lasted for many bars) and that the rally to bar 19 was not strong enough for them to expect the bull trend to make a new high without at least more of a correction.
These were the most determined bulls (since they were willing to hold through the protracted sell-off to bar 16), and once they gave up, there was no one left to buy at these prices. The market had to probe lower to find a level where the bulls would return and where the bears would buy back their shorts. There were no consecutive strong bull trend bars or other signs of strong buying in the move up from bar 16, and this made the bears more aggressive and the bulls less willing to buy. Since the bulls were confident that the market would soon be lower, they used the rally to bar 19 to exit their longs around breakeven or with a small loss. The selling by these disappointed bulls, combined with the selling of the aggressive bears who were shorting heavily in an attempt to keep the market from going above bar 13, resulted in the market turning down at bar 19. The bulls were willing to buy again lower, but needed a sign that the market was about to reverse up. The sideways move to bar 23 after seven bars down was not a strong bottom, so most bulls were unwilling to buy unless the price got marked down further. The bears were willing to take profits at any time, but they would buy back their shorts only if there was a sign of a reasonable bottom. With no sign of a bottom, neither the bulls nor the bears were willing to buy. Also, the remaining longs continued to sell out of their positions, adding to the selling pressure. Bears continued to sell when they saw the increasing selling pressure in the move down from bar 23. The result was a strong trend reversal in the form of the bar 19 lower high after the bar 16 break below the bull trend line. As is the case in all strong trends, traders pressed their shorts, adding to their positions as the market quickly fell in the spike down to the bar 25 low and down to the bar 28 low, where they began to take profits. All trend bars are spikes, climaxes, breakouts, and gaps. Bar 25 was a large bear breakout bar and was likely going to be followed by a measured move down, based on the height of the trading range. It was possible that bar 25 itself became a measuring gap, with the middle of the gap being the midpoint between the bar 16 low (the top of the gap) and the 27 high (the bottom of the gap). This could lead to a measured move down today or tomorrow.
The rally to bar 19 was a double top bear flag, a wedge bull flag, and two legs up in a bear trend (the two-legged swing high between bars 15 and 16 was the first), and it had an excellent trader’s equation. The risk was to above the bar 19 high, or about 10 cents, and the reward at a minimum was 50 cents lower on a test of the bar 16 low, where the market might have formed a double bottom and possibly a large triangle or bull flag. Since the market was in a bear trend or at least at the top of a trading range, the chance of success was at least 60 percent. A 60 percent chance of success combined with a 10 cent risk and a 50 cent reward makes for a great trade. A trader who took it 10 times would make $3.00 and lose 40 cents, an average of 26 cents per trade.
Traders believed that if the market fell below bar 16, it would probably fall for a measured move down from the double top, which it did. The bar 16 area was the breakout test of the breakout gap, which was the bull spike from bar 1 to bar 3. After the market rallied from this test, bulls did not want it to fall below the test, because they would have seen that as a sign of weakness. Just like the bears did not want the rally to bar 19 to go above the bar 13 lower high, which could have been followed by a measured move up, the bulls did not want the sell-off from bar 19 to fall below the bar 16 higher low, which could have been followed by a measured move down. Since my friend would have seen this move down from bar 19 as a trend trade, he would have traded it like a trend (book 1 discusses how to trade a trend). The initial risk was only 10 cents and the odds were good that the market would have tested the bar 16 low at a minimum, so he would have taken about half off on the test if there was a pause bar. Since there was no pause, there was no significant profit taking, and he probably would not have taken any profits until around bar 28. This was a pause after a sell climax bar that followed a potential final flag (the three bars ending at bar 27). He would have taken maybe half off there with a $1.20 profit and held the remainder until a minute or two before the close, for another $1.30 profit.
Incidentally, remember that both strong bulls and strong bears like to see a large bull trend bar in an overdone bull trend, because it often leads to a two-legged pullback to below the moving average, as it did here at bar 9. The expected correction provided both of them with a temporary trading opportunity, although not a trend reversal trade. Bar 9 was the third consecutive buy climax without much of a pullback (bars 1 to 3 was the first, and bars 5 to 6 was the second). It was more likely to become an exhaustion gap than a measuring gap (it was more likely to be the start of a correction instead of a new leg up). In this scenario, both the strong bulls and the strong bears sold at the close of the bar, above its high, at the close of the next bar or two (especially since the bar after bar 10 had a bear body), and below the low of the prior bar. The bulls were selling out of their longs as they took profits, and the bears were selling to put on shorts. Most bears would have picked a protective stop that was less than the number of ticks in the bar 9 buy climax bull trend bar. The bulls wouldn’t look to buy again and the bears would not have taken profits on their shorts until after the two-legged correction was complete, which was in the bar 14 to bar 16 area (the move to bar 12 was the first leg down). The sell-off was strong enough for both to think that the market could have a trend reversal into a bear trend after a lower high or higher high test of the bar 10 bull high.