CHAPTER 3
Major Trend Reversal
There are many institutions that invest for the long term and view every strong break below the bull trend line as a buying opportunity, because they know that the bears will constantly try to reverse the trend but will fail 80 percent of the time. They will buy even if the bear spike is huge and strong, and goes far below the trend line and the moving average. They hope that their buying will provide the leadership that other traders need to see before they will also buy. At a minimum, they expect the rally to test the breakout point below the market top. Once there, they will decide if the trend has reversed. If so, they will stop buying and instead will exit their new longs as well as all of the other longs that they bought all the way up. Most of their position was profitable because they bought it long ago, far below their last entry. However, since they are buying as the trend continues up, they bought some of their position at the top of the bull and will take a loss when they exit. Once these long-term investing institutions believe that the market is going lower, the trend will reverse, because they were the traders who previously bought every sharp sell-off, and now there is no one left to buy strong bear spikes. They will wait until they believe that the bear trend has reached a long-term value area, which will always be at a long-term support area, like a monthly trend line. Once there, they will buy aggressively again, and they will buy every further attempt by the bears to extend the bear trend. At some point, other institutions will see the support forming and they will also buy. There will soon be a strong bull spike, a pullback that tests the bear low, and then a reversal into a new bull trend.
Every reversal pattern is some kind of trading range, and therefore has two-sided trading until it is clear that the countertrend traders have gained control. The term major trend reversal means different things to different traders, and no one can say with certainty that the trend has reversed until the move has gone on for at least enough bars for the always-in position to change direction in the eyes of most traders. However, that alone is not enough for a reversal to be labeled “major.” The always-in position changes with every tradable swing on the 5 minute chart for many traders, which means that it changes many times a day on most days, even though the dominant trend usually remains the same. A major trend reversal means that there are two trends on the chart in front of you, with a reversal in between them where either a bull trend has reversed into a bear trend or a bear trend has reversed into a bull trend. This type of reversal is different from the many up and down reversals on the chart that usually move far enough for a trade, but not far enough to change the direction of the major trend. Also, those minor reversals happen whether or not there is an obvious trend on the screen.
The earliest signals for most major trend reversals have a low probability of success, but offer the largest reward, often many times greater than the risk. The market is often mostly sideways at the outset, with many pullbacks, but if the trend is actually reversing, the new trend will soon be obvious. Many traders prefer to wait to enter until the trend is clear. These traders prefer to only take trades with at least a 60 percent chance of success and are willing to make less (they are entering after the move has already begun) on the trade for the increased chance of success. Since both approaches have positive trader’s equations when done properly, both are reasonable.
Four things are needed for a major trend reversal:
1. A trend on the chart in front of you.
2. A countertrend move (a reversal) that is strong enough to break the trend line and usually the moving average.
3. A test of the trend’s extreme, and then a second reversal (a higher high, a double top, or a lower high at the top of a bull trend, or a lower low, a double bottom, or a higher low at the bottom of a bear trend).
4. The second reversal going far enough for there to be a consensus that the trend has reversed.
First, there has to be a trend on the screen in front of you, and then a countertrend move that is strong enough to break the major trend’s trend line, and preferably convincingly beyond the moving average. Next, the trend has to resume and test the old trend’s extreme, and then the market has to reverse again. For example, after there is a strong move down below the bull trend line in a bull trend, traders will watch the next rally. If the market turns down again in the area of the old high (from a lower high, double top, or higher high), the test was successful and traders will begin to suspect that the trend is reversing. Finally, the move down has to be strong enough for traders to believe that the market is in a bear trend. If the move down is in the form of a strong bear spike composed of many consecutive large bear trend bars, everyone will see the market as now being in a bear trend. However, the market will instead often be in a broad bear channel for 50 or more bars, without enough clarity to convince traders that the trend has truly reversed to down. They may wonder if it instead has evolved into a large trading range, which will often be the case. In the absence of a very strong bear spike, there will not be strong agreement that the trend has reversed until after dozens of bars and a series of lower highs and lows. At this point, the market can be far below the old bull high and there might not be much more left to the bear trend.
It does not matter that agreement about the reversal often does not come until long after the market has actually reversed, because there will be trades all the way down. If the move down is unclear and two-sided, traders will trade it like any other two-sided market and take trades in both directions. If it is a very strong bear trend, traders will almost exclusively take shorts. If there are trades all the way down, then why should a trader ever think about a major trend reversal? Because the trader’s equation is excellent if a trader enters early, just as the market is turning down from its test of the old high. The reward is often many times larger than the risk, and even if the probability is only 40 to 50 percent, the result is a very favorable trader’s equation. Most lead to trading ranges, but still profitable trades.
Virtually all major trend reversals begin with either a trend line break or a trend channel line overshoot and reversal, and all of those eventually break the trend line when there is a reversal. For example, if a bull market is ending in a head and shoulders top, the move down from the head usually breaks below the bull trend line for the entire bull trend, and always below the smaller bull trend line along the bottom of the bars that rally up to form the head. The bulls buy when the sell-off from the head reaches the area of the pullback from the left shoulder, trying to create a double bottom bull flag. Many bears, who shorted as the rally to the head moved above the left shoulder, take profits in the same area, in case the market enters a trading range or forms a double bottom bull flag. The bears see the rally that creates the right shoulder as a lower high breakout pullback short setup, and short. The trend line break is what a bear needs to see before feeling confident about taking a countertrend position (a short in a bull trend), because it signifies a break of the trend and the start of a possible major trend reversal. Also, bulls who bought at the prior high (the head), expecting another leg up, and held on to their positions watch the strength of the sell-off from the head. Once they see that it was strong enough to fall below the trend line, they will use the rally to exit their longs with a small loss. The selling by both the bulls and the bears causes the market to drop and form the lower high (the right shoulder). Once the market sells off to the neckline (a roughly horizontal line drawn across the bottom of the pattern, along the lowest points of the sell-offs from the left shoulder, head, and finally right shoulder), both the bulls and the bears will assess the strength of the sell-off. If it is strong, the bears will no longer simply scalp out of their shorts, thinking that the market is still in a trading range. Instead, they will hold on to their shorts and even sell more, expecting a major trend reversal, especially on and after the breakout below the neckline. The bulls will see the strength of the selling and will not be willing to buy until the market stabilizes, which they expect will be at least several bars later, and possibly after a measured move down.
If, in contrast, the sell-off from the head to the neckline is weak, both the bulls and the bears will buy on the test of the neckline. The bulls will buy because they see the entire pattern as a trading range in a bull trend and therefore just a large bull flag. They are buying what they expect is the bottom of the bull flag, where there is an approximate triple bottom (the three reversals up from the neckline). Some bulls will scalp out as the market tests toward the middle or top of the trading range, and others will hold, looking for a bull breakout and a swing up. The bears will buy back their shorts and not look to sell again until they can get a better price. They hope that the bounce stays below the right shoulder, and if it does or if it forms a double top with the right shoulder, they will short again, hoping that the pattern becomes a head and shoulders top with two right shoulders, which is common. If the market breaks above the right shoulder, they will buy back their shorts and not look to sell again for many bars, concluding that the entire pattern evolved into a large bull flag and that the breakout will likely rally for at least a measured move up. The bulls will also buy the breakout above the right shoulder, knowing that the bears will cover their shorts and not look to sell again for many bars. They, like the bears, will expect an approximate measured move up, and will buy more as the new bull leg progresses.
The same is true of a double top or a higher high. Whenever the market returns to the area of a prior high after having a sharp sell-off, the bulls who bought at the old high become disappointed by that sell-off and use the rally to exit their longs. This means that they become sellers (they sell out of their longs), and they won’t buy again until prices get marked down considerably. With no one left to buy at the current prices and both the bulls and bears selling, the market falls.
The same happens at a market bottom. Once there is a rally that is strong enough to break above the bear trend line (either the trend line for the entire bear trend or simply the one above the sell-off to the head), the bears who shorted at the bottom as the market broke below the left shoulder, expecting another leg down, will be disappointed by the rally and will expect at least another leg up after a test down. Traders will see the next leg down as a test of the strength of the bear trend. If the bear trend is strong, the market will eventually break below the old low (the head) by many bars and have another leg down. If the trend is reversing, aggressive bulls will buy around the old low, and the bears who shorted at the old low will be disappointed by the strong rally from the head and the weaker move down to test the bear low, and will use this dip to buy back their shorts around breakeven. With both the bulls and the bears buying, and the bears unwilling to sell again around this level, the market will rally. This test can form a perfect double bottom with the old bear low, a higher low, or a lower low. It does not matter, because they are all manifestations of the same process. If it forms a higher low, some traders will see it as a right shoulder of a head and shoulders bottom, and will look for a reasonable left shoulder. If they find one, they will be more confident that this is a trend reversal because they believe that many traders will recognize the pattern and begin to buy. However, whether there is a clear left shoulder is irrelevant to most traders. The important point is that there is the strong break above the bear trend line, followed by a test of the bear low, and then by a reversal up into a bull swing or trend.
Whether a top comes from a higher high, a perfect double top, or a lower high is irrelevant, because they all represent the same behavior. The market is testing the old high to see if there will be mostly buyers and a bull breakout, or mostly sellers and a bear reversal. There are two pushes up to the top: the first is the original bull high, and the second is the test of that high after the market has fallen below the bull trend line. The market does not care how perfect the double top is; regardless of their appearance, all of the tests should be thought of as variations of double tops. The same is true of market bottoms. There is a market low and then a rally that is usually strong enough to break above the bear trend line. That low is the first bottom of the double bottom. After the market breaks above the bear trend line (and therefore out of the bear channel) and sells off again to test the first bottom, when the market reverses up, this low is the second bottom of the double bottom, whether it is above, exactly at, or below the first bottom.
The relationship between traditional double tops and bottoms and their micro versions on higher time frame charts is the same as it is for all micro patterns. For example, if a trader sees a double bottom on a 5 minute chart and then looks at a higher time frame chart, the two bottoms will be just two or three bars apart, creating a micro double bottom. Similarly, if a trader looks at a micro double bottom on the 5 minute chart where the two bottoms are just two or three bars apart, this bottom would be a perfect trend reversal on a small-enough time frame chart, where the rally after the first bottom broke above the bear trend line, and the second bottom is the test. In fact, most tradable reversals on every chart, even small scalps, begin with a micro double bottom or top, and most traders will not place the reversal trade unless one is present. A micro double top is a failed breakout in a bull trend, and therefore either a failed high 1, high 2, or triangle buy signal, and a failed double bottom is a failed low 1, low 2, or triangle sell signal. This means that these reversals are small final flag reversals (discussed in Chapter 7). In fact, a final flag is a variation of a double top or bottom. For example, it there is a two-legged rally on a trading range day and the market then forms an ii pattern, traders will be alert to a possible final flag breakout and reversal down. The spike that formed just before the ii pattern is the first push up, and the small bull breakout is the second. Since that is two pushes up, even though the highs are not at the same level, it is just a variation of a double top.
Traders anticipating a reversal down will short at and above the high of the signal bar for the breakout of what they anticipate will be the final bull flag. When it is a micro pattern, their limit orders to short will be at and just above the high of the signal bar. When it is a larger pattern, it will be a micro pattern on a higher time frame chart, and some traders will have their limit orders at and above that higher time frame signal bar. Other traders, and probably many institutions, will scale into shorts as the market moves out of what they believe will be the final bull flag. They do the opposite at market bottoms with a double bottom or micro double bottom that they expect will become the final flag of the bear leg and lead to a reversal up.
Remember, all trends are in channels, and until there is a strong breakout of the channel, the best bet is against any attempt to break out beyond the trend line. Until there is a strong break beyond the trend line, most traders will view any countertrend trade as only a scalp. In the absence of a trend line break, there is still a strong trend in effect and traders should make sure that they take every with-trend entry and do not worry about missing an occasional countertrend scalp. The best odds and the most money are with the with-trend trades. True V bottoms and tops in the absence of trend channel line overshoots and reversals are so rare that they are not worth considering. Traders should focus on common patterns, and if they miss an occasional rare event, there will always be a pullback where they can start trading with the new trend.
The trend line break does not reverse the trend. It is simply the first significant sign that countertrend traders are getting strong enough that you should soon begin to trade in their direction. However, you first should continue to trade with the trend because after the break of the trend line there will be a test of the old trend extreme. The test can slightly overshoot or undershoot the old extreme. You should take a countertrend trade only if a reversal setup develops during this test. If it does, the countertrend move should form at least two legs, and it might even result in a new, opposite trend.
A move above a prior high in a bull trend will generally lead to one of three outcomes: more buying, profit taking, or shorting. When the trend is strong, strong bulls will press their longs by buying the breakout above the old high and there will be a measured move up of some kind. If the market goes up far enough above the breakout to enable a trader to make at least a profitable scalp before there is a pullback, then assume that there was mostly new buying at the high. If it goes sideways, assume that there was profit taking and that the bulls are looking to buy again a little lower. If the market reverses down hard, assume that the strong bears dominated at the new high and that the market will likely trade down for at least a couple of legs and at least 10 bars.
Some traders like to enter on the earliest sign that a trend is reversing, such as when it is breaking out of the channel. However, this is a low-probability style of trading. Yes, the large reward can offset the risk and low probability of success, but most traders end up cherry-picking and invariably talking themselves out of the best cherries. As with all breakouts, it is usually better to wait to see how strong the breakout is. If it is strong, then look to enter on the pullback. This concept applies to reversals from all trends, even small trends, like pullbacks in larger trends, micro channels, channels after spikes, and trends that are in broad channels. If the countertrend breakout is weak, look to enter in the direction of the trend as the reversal attempt fails. If the breakout is very strong and goes for many bars without a pullback, then treat it like any strong breakout and enter the new trend at the market or on a small pullback, as was discussed in Part I of the second book.
In the absence of some rare, dramatic news event, traders don’t suddenly switch from extremely bullish to extremely bearish. There is a gradual transition. A trader becomes less bullish, then neutral, and then bearish. Once enough traders make this transition, the market reverses into a deeper correction or into a bear trend. Every firm has its own measure of excess, and at some point, enough firms decide that the trend has gone too far. They believe that there is little risk of missing a great move up if they stop buying above the old high, and they will buy only on pullbacks. If the market hesitates above the old high, the market is becoming two-sided, and the strong bulls are using the new high to take profits.
Profit taking means that traders are still bullish and are looking to buy a pullback. Most new highs are followed by profit taking. Every new high is a potential top, but most reversal attempts fail and become the beginning of bull flags, only to be followed by another new high. If a rally to test the high has several small pullbacks within the leg up, with lots of overlapping bars, several bear bodies, and big tails on the tops of the bars, and most of the bull trend bars are weak, then the market is becoming increasingly two-sided. The bulls are taking profits at the tops of the bars and buying only at the bottoms of the bars, and the bears are beginning to short at the tops of the bars. Similarly, the bulls are taking profits as the market approaches the top of the bull trend and the bears are shorting more. If the market goes above the bull high, it is likely that the profit taking and shorting will be even stronger, and a trading range or reversal will form.
Most traders do not like to reverse, so if they are anticipating a reversal signal, they prefer to exit their longs and then wait for that signal. The loss of these bulls on the final leg up in the trend contributes to the weakness of the rally to the final high. If there is a strong reversal down after the market breaks above the prior high, the strong bears are taking control of the market, at least for the near term. Once that happens, then the bulls who were hoping to buy a small pullback believe instead that the market will fall further. They therefore wait to buy until there is a much larger pullback, and their absence from buying allows the bears to drive the market down into a deeper correction, lasting 10 or more bars and often having two or more legs.
There is one situation where the breakout in a bull trend is routinely met by aggressive shorts who will usually take over the market. A pullback is a minor trend in the opposite direction, and traders expect it to end soon and for the larger trend to resume. When there is a pullback in a strong bear trend, the market will often have two legs up in the minor bull trend. As the market goes above the high of the first leg up, it is breaking out above a prior swing high in a minor bull trend. However, since most traders will see the move up as a pullback that will end very soon, the dominant traders on the breakout will usually be aggressive sellers, instead of aggressive new buyers, or profit-taking longs, and the minor bull trend will usually reverse back down into the direction of the major bear trend after breaking out above the first or second swing high in the pullback.
The same is true of new lows in a bear trend. When the bear trend is strong, strong bears will press their positions on the breakout to a new low by shorting more, and the market will continue to fall until it reaches some measured move target. As the trend weakens, the price action at a new low will be less clear, which means that the strong bears are using the new low as an area to take profits on their shorts rather than as an area to add to their shorts. As the bear trend further loses strength, eventually the strong bulls will see a new low as a great price to initiate longs and they will be able to create a reversal pattern and then a significant rally.
As a trend matures, it usually transitions into a trading range, but the first trading ranges that form are usually followed by a continuation of the trend. How do the strong bulls and bears act as a trend matures? In a bull trend, when the trend is strong, the pullbacks are small because the strong bulls want to buy more on a pullback. Since they suspect that there may not be a pullback until the market is much higher, they begin to buy in pieces, but relentlessly. They look for any reason to buy and, with so many big traders in the market, there will be some buying for every imaginable reason. They place limit orders to buy a few ticks down and other limit orders to buy a few ticks above the low of the prior bar, at the low of the prior bar, and below the low of the prior bar. They place stop orders to buy above the high of the prior bar and on a breakout above any prior swing high. They also buy on the close of both any bull or bear trend bar. They see the bear trend bar as a brief opportunity to buy at a better price and the bull trend bar as a sign that the market is about to move up quickly.
The strong bears are smart, and they see what is going on. Since they believe, just like the strong bulls, that the market is going to be higher before long, it does not make sense for them to be shorting. They just step aside and wait until they can sell higher. How much higher? Each institution has its own measure of excess, but once the market gets to a price level where enough bear firms believe that it might not go any higher, they will begin to short. If enough of them short around the same price level, more and larger bear trend bars form and bars start to get tails on the tops. These are signs of selling pressure and they tell all traders that the bulls are becoming weaker and the bears are becoming stronger. The strong bulls eventually stop buying above the last swing high and instead begin to take profits as the market goes to a new high. They are still bullish, but are becoming selective and will buy only on pullbacks. As the two-sided trading increases and the sell-offs have more bear trend bars and last for more bars, the strong bulls will want to buy only at the bottom of the developing trading range and will look to take profits at the top. The strong bears begin to short at new highs and are now willing to scale in higher. They might take partial profits near the bottom of the developing trading range if they think that the market might reverse back up and break out to a new high, but they will keep looking to short new highs. At some point, the market becomes a 50–50 market and neither the bulls nor the bears are in control; eventually the bears become dominant, a bear trend begins, and the opposite process unfolds.
A protracted trend will often have an unusually strong breakout, but it can be an exhaustive climax. For example, in a protracted bull trend, all strong bulls and bears love to see a large bull trend bar or two, especially if it is exceptionally big, because they expect it to be a brief, unusually great opportunity. Once the market is close to where the strong bulls and bears want to sell, like near a measured move target or a trend channel line, especially if the move is the second or third consecutive buy climax, they step aside. The absence of selling by the strongest traders results in a vacuum above the market, which creates one or two relatively large bull trend bars. This bull spike is just the sign that the strong traders have been waiting for, and once it is there, they appear as if out of nowhere and begin their selling. The bulls take profits on their longs and the bears initiate new shorts, both betting against the breakout. Both sell aggressively at the close of the bar, above its high, at the close of the next bar (especially if it is a weaker bar), and at the close of the following bar, especially if the bars are starting to have bear bodies. They also short below the low of the prior bar. When they see a strong bear trend bar, they short at its close and below its low. Both the bulls and the bears expect a larger correction, and the bulls will not consider buying again until at least a 10-bar, two-legged correction, and even then only if the sell-off looks weak. The bears expect the same sell-off and will not be eager to take profits too early.
Weak traders see that large bull trend bar in the opposite way. The weak bulls, who had been sitting on the sidelines, hoping for an easy pullback to buy, see the market running away from them and want to make sure they catch this next leg up, especially since the bar is so strong and the day is almost over. The weak bears, who shorted early and maybe scaled in, were terrified by the rapidity with which the bar broke to a new high. They are afraid of relentless follow-through buying, so they buy back their shorts. These weak traders are trading on emotion and are competing against computers, which do not have emotion as one of the variables in their algorithms. Since the computers control the market, the emotions of the weak traders doom them to big losses on big bull trend bars at the end of an overdone bull trend. The market is reversing, not successfully breaking out.
Once a strong bull trend begins to have pullbacks that are relatively large, the pullbacks, which are always small trading ranges, behave more like trading ranges than bull flags. The direction of the breakout becomes less certain, and traders begin to think that a downside breakout is about as likely as an upside breakout. A new high is now a breakout attempt above a trading range, and the odds are that it will fail. Likewise, once a strong bear trend begins to have relatively large pullbacks, those pullbacks behave more like trading ranges than like bear flags; therefore, a new low is an attempt to break below a trading range, and the odds are that it will fail, and that the trading range will continue.
Every trading range is within either a bull trend or a bear trend. Once the two-sided trading is strong enough to create the trading range, the trend is no longer strong, at least while the trading range is in effect. There will always eventually be a breakout from the range, and if it is to the upside and it is very strong, the market is in a strong bull trend. If it is to the downside and strong, the market is in a strong bear trend.
Once the bears are strong enough to push a pullback well below the bull trend line and the moving average, they are confident enough that the market will likely not go much higher and they will aggressively short above the old high. At this point, the bulls will have decided that they should buy only a deep pullback. A new mind-set is now dominant at the new high. It is no longer a place to buy because it no longer represents much strength. Yes, there is profit taking by the bulls, but most big traders now look at the new high as a great opportunity to initiate shorts. The market has reached the tipping point, and most traders have stopped looking to buy small pullbacks and instead are looking to sell rallies. The bears are dominant, and the strong selling will likely lead to a large correction or even a trend reversal. After the next strong push down, the bears will look for a lower high to sell again or to add to their short positions, and the bulls who bought the pullback will become concerned that the trend might have reversed or at least that there will be a much larger pullback. Instead of hoping for a new bull high to take profits on their longs, they will now take profits at a lower high and not look to buy again until after a larger correction. Bulls know that most reversal attempts fail, and many who rode the trend up will not exit their longs until after the bears have demonstrated the ability to push the market down hard. Once these bulls see this impressive selling pressure, they will then look for a rally to finally exit their longs. Their supply will limit the rally, and their selling, added to the shorting by aggressive bears and the profit taking by bulls who saw the sell-off as a buying opportunity, will create a second leg down.
If the market enters a bear trend, the process will reverse. When the bear trend is strong, traders will short below prior lows. As the trend weakens, the bears will take profits at new lows and the market will likely enter a trading range. After a strong rally above the bull trend line and the moving average, the bears will take profits at a new low and strong bulls will aggressively buy and try to take control of the market. The result will be a larger bear rally or possibly a reversal into a bull trend.
A similar situation occurs when there is a pullback that is large enough to make traders wonder if the trend has reversed. For example, if there is a deep, sharp pullback in a bull trend, traders will begin to think the market may have reversed. They are looking at moves below prior swing lows, but this is in the context of a pullback in a bull trend instead of as part of a bear trend. They will watch what happens as the market falls below a prior swing low. Will the market fall far enough for bears, who entered on a sell stop below that swing low, to make a profit? Did the new low find more sellers than buyers? If it did, that is a sign that the bears are strong and that the pullback will probably fall further. The trend might even have reversed to down.
Another possibility on the breakout to a new low is that the market enters a trading range, which is evidence that the shorts took profits and that there was unimpressive buying by the bulls. The final alternative is that the market reverses up after the breakout to a new low. This means that there were strong bulls below that swing low just waiting for the market to test there. This is a sign that the sell-off is more likely just a big pullback in an ongoing bull trend. The shorts from higher up took profits on the breakout to the new low because they believed that the trend was still up. The strong bulls bought aggressively because they believed that the market would not fall further and that it would rally to test the bull high.
Whenever there is any breakout below a swing low, traders will watch carefully for evidence that the bulls have returned or that the bears have taken control. They need to decide what influence is greatest at the new low, and they use the market’s behavior to make that decision. If there is a strong breakout, then new selling is dominant. If the market’s movement is uncertain, then profit taking by the shorts and weak buying by the bulls is taking place, and the market will likely enter a trading range. If there is a strong reversal up, then aggressive buying by the longs is the most important factor.
Strong trend channel line reversals are from greatly overextended trends and often run far after they reverse through the channel to the opposite side and then break the trend line. The first pullback after the reversal is often shallow because the market is emotional and everyone quickly agrees that the trend has reversed. Because of the confidence, traders will be much more aggressive and will add on during the smallest pause and not take profits, keeping the pullbacks small.
When there is a strong break of a trend line, there will usually be a second leg after a pullback. The pullback often retraces and tests the old trend line, but there are almost always more reliable price action reasons for entering there in your attempt to catch the second leg of the pullback or new trend. The stronger the move through the trend line, the more likely it is that there will be a second leg after a pullback. If the break of the trend line is not even strong enough to reach the moving average, it is usually not strong enough to reverse the trend, so do not begin looking for a trend reversal just yet. The trend is still strong and you should take only with-trend setups, despite the break of the trend line.
Trends end with a reversal, which is a countertrend move that breaks the trend line, and then a test of the final trend extreme. The test may overshoot the old extreme as in the case of a lower low in a new bull trend or a higher high in a new bear trend, or it may undershoot it with a higher low in a new bull trend or a lower high in a new bear trend. Rarely, the test will form a perfect double top or double bottom to the exact tick. Overshoots are, strictly speaking, the final leg of the old trend, because they form the most extreme price in the trend. An undershoot is the pullback from the first leg in the new trend. Tests themselves are frequently made of two legs (for example, like a two-legged rally after a bear breakout).
If the overshoot goes too far and is in too tight a channel, you should not be looking for a reversal. The trend has likely resumed and is not in the process of reversing. Instead, begin the process over and wait for another trend line break and then another test of the trend’s extreme before looking for a reversal trade.
The test of the trend extreme is usually in the form of some type of channel, and the strength of the channel is especially important when the market might be in the process of reversing. For example, if there is a strong bull trend and then there is a strong sell-off that breaks well below the bull trend line, traders will study the next rally carefully. They want to see whether that rally will simply be a test of the bull high or instead it will break out strongly above the high and be followed by another strong leg up in the bull trend. One of the most important considerations is the momentum of that test of the bull high. If the rally is in a very tight, steep channel with no pullbacks and very little overlap between consecutive bars, and the rally goes far above the bull high before having any pause or pullback, the momentum is strong and the odds are increased that the bull trend will resume, despite that earlier strong sell-off and breakout below the bull trend line. In contrast, if the rally has many overlapping bars, several large bear trend bars, two or three clear pullbacks, maybe a wedge shape, and a slope that is noticeably less than the slope of the original bull trend and of the sell-off, then the odds are that the test of the bull high will result in either a lower high or a slightly higher high and then another attempt to sell off. The market might be reversing into a bear trend, but at a minimum, a trading range is likely.
Markets have inertia and tend to continue to do what they have been doing. This causes most trend reversals to fail. Also, when one succeeds in reversing the market, a trading range is more likely to form than a trend in the opposite direction, since a trading range represents less change. In a trading range, traders from the old trend are still strong, but are balanced by traders from the opposite trend. This is more likely than the market quickly changing control from one set of trend traders to trend traders in the opposite direction. However, even if a trading range forms, it usually will have large, tradable countertrend swings and it might take dozens of bars before traders know whether the market has reversed into an opposite trend or instead has been forming a large flag in an ongoing trend.
Since the countertrend move after a trend line break usually has at least two legs, if a bull reversal has a higher low for the test of the bear low, it will also be the start of the second leg. However, if it forms a lower low for the test, that low will be the start of the first leg; after that first leg, it is likely that there will be a pullback and then a second leg. Likewise, in a bear reversal, a lower high is the start of the second leg, but a higher high test is the start of the first leg.
Everything is relative to the chart in front of you and looks different on higher and smaller time frame charts. If the legs that break off the trend line and test the trend’s extreme have only two bars on a 5 minute chart, traders will not see this as a major trend reversal, although those legs might have about 10 bars on a 1 minute chart and create an excellent major trend reversal setup. Similarly, if a bull trend that has lasted 60 bars has a pullback and a test where the legs have 20 or more bars, they might create a major trend reversal setup on the 15 minute chart, but when the legs have that many bars on the 5 minute chart, traders will not use the term ``major trend reversal.’’ They will instead look for other patterns. For example, if the pullback that breaks a bull trend line has 30 bars, traders will see it as a bear trend (all pullbacks in bull trends are smaller bear trends), and will look for a break above the bear trend line and then a major trend line up. If the rally also has about 30 bars, they will see it as a new bull trend, and look for a break below its trend line and a major trend reversal down. They realize that these legs have only 10 bars on the 15 minute chart and form a major trend reversal on that chart, but that is not the chart that they are trading, and they will use terms that are appropriate for the chart in front of them.
An average setup has about a 40 percent chance of leading to a profitable swing, a 30 percent chance of a small loss, and a 30 percent chance of a small profit. Most result in trading ranges instead of opposite trends, but there is still a 70 percent chance of at least a small profit. The best setups have a 60 percent chance of profitable swing trades.
FIGURE 3.1 A Higher High Followed by a Lower High
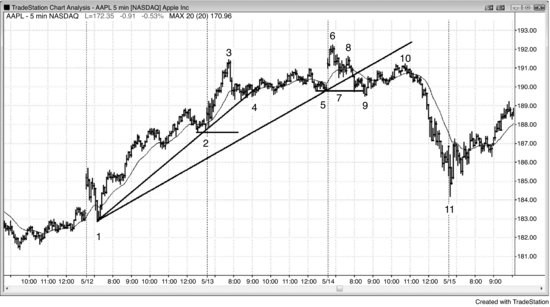
A major trend reversal is shown in Figure 3.1, and many other examples are mentioned on charts throughout the book.
If a trend reverses down at a higher high after the bull trend line break (a major trend reversal down), there is usually a lower high major trend reversal that will give traders a second chance to get short. AAPL had both a higher high and a lower high trend reversal. A major reversal usually follows a strong break of the trend line, which is evidence that the traders in the opposite direction are getting strong. The weak bear leg to bar 4 barely broke the trend line, and it did not come close to falling below the last higher low in the bull trend (bar 2). It could not even hold below the moving average. However, it continued sideways for many bars, indicating that the bears were strong enough to halt the bull trend for a long time.
Bar 6 was a higher high short setup after this trend line break, but because the move down to bar 4 was not particularly strong, the sell-off down to bar 9 stalled.
Bar 9 became the bottom of a wedge bull flag or a bull channel and a high 4 buy setup, and it formed a double bottom bull flag with bar 5. This led to a rally to bar 10. The move up to bar 10 was a low-momentum, low 4 short setup and a wedge bear flag, with the first push up being the lower high just before the bar 9 low. It was also the right shoulder of a head and shoulders top, but most head and shoulders tops fail and become triangles or wedge bull flags. In this case, however, it became the first lower high after a trend line break and a lower high test of the bull high.
The bear leg to bar 9 broke well below a longer trend line, the moving average, and the last higher low of the bull trend (bar 5), and it followed a previous sharp attempt at a trend reversal (the sell-off to bar 4). Also, it did not come close to testing the underside of the bull trend line or the bar 8 first pullback in the first leg down. All of these were signs of strength of the trend line break and increased the chances for at least a second leg down or an actual trend reversal. The bulls who bought around the bar 6 top of the bull trend saw the strength of the bears in the sell-off to bar 9 and the weakness of the bulls in the rally to bar 10, and were disappointed by the price action. They used the weak rally to bar 10 as an opportunity to exit their longs with a small loss, and they were not willing to buy again until the market traded lower. The bulls wanted to see signs of strength before buying, but none came, so they sat on the sidelines as the market sold off to bar 11.
Some traders like to see a Fibonacci 61.8 percent retracement on the rally to the lower high. However, a 61.8 percent retracement is never as precise as the number leads one to believe, and probably no more likely than a 60, 63, or 67 percent pullback, and it has probably lost value now that trading has become so computerized. For example, if a trader is selling a 50 percent pullback in what he believes is a bear swing, he might risk to a new high (above bar 6) to get a test of the bar 9 bottom of the bear spike. His reward equals his risk, and since he sees the rally as a pullback, his short has at least a 60 percent probability of success. If the market retraced higher, there is an argument that a 67 percent retracement is more important than a 61.8 percent retracement. Once a pullback rallies to above 50 percent, the chance of the bear resuming becomes less, let’s say 50 percent. Once the probability is 50 percent or less, traders will need more of a reward if they are going to short. Since their stop is above the bar 6 high, they might want a reward that is twice the size of their risk. This means that they might short a 67 percent retracement, because then a test of the bar 9 low would create a reward that is twice as large as their risk.
FIGURE 3.2 A Lower Low Followed by a Higher Low
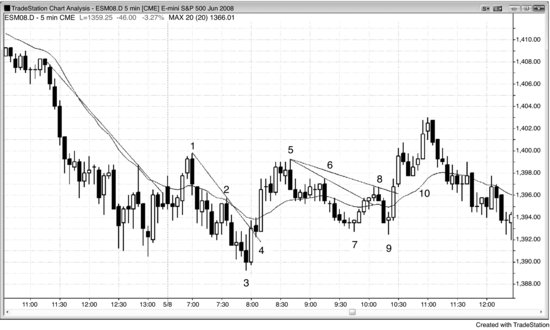
The Emini had a lower low and then a higher low major trend reversal (see Figure 3.2). The rally to bar 1 broke a bear trend line, and the bar 3 test of the bear low was a lower low. A lower low test usually results in at least two countertrend legs, and that is what happened here (the up moves from bars 3 and 9). Bar 9 was a higher low after the break of yesterday’s major bear trend line (broken by the rally to bar 1), and as a higher low, it was the start of the second leg, and the completed second leg can be the end of the move up. A trading range is a more common outcome than a reversal into an opposite trend.
The channel down to bar 7 (from both bar 5 and bar 6) was strong. Many traders preferred to wait to see how strong the breakout was before buying. The two bull bars after bar 7 had relatively big bodies and small tails, and represented a strong breakout in the eyes of many traders. At that point, many traders thought that the market had become always-in long and waited to buy a pullback. The bear bar after bar 8 was an attempt to make the breakout of the high 2 bull flag down to bar 7 fail (the first leg down ended three bars after bar 5). The bears wanted the bar 6 and bar 8 double top to lead to a swing down. The bulls expected the bears to fail and for traders to come in and buy the test of the bar 7 low, creating a higher low after the strong bull spike up to bar 5 (bar 4 and the bar after bar 3 were strong enough to make traders think that at least a second leg up was likely). Bar 9 was a lower low breakout pullback buy setup (and a double bottom bull flag with bar 7), and the bulls bought it aggressively.
The bull trend bar after bar 9 reversed the highs and closes of many prior bars, which is a sign of a strong bull reversal. It closed above the close of every bar since bar 6 and its high was above the high of every bar since the bar after bar 6. The more highs and closes that a strong bull bar reverses, the stronger the bull reversal and the more likely that there will be follow-through buying (higher prices).
The earliest entries in major trend reversals often do not look strong, like at bars 3 and 9. This means that the probability of success is often less than 50 percent. However, the potential reward is at its greatest and the result usually is a positive trader’s equation. Traders can wait for a clear always-in long reversal before buying, and this usually increases the probability to 60 percent or higher. At that point, there is less profit remaining and the risk is usually larger (the protective stop is further away), but the trader’s equation is usually still positive. For example, the bulls could have waited to buy above the bull trend bar that followed bar 3 for a swing, or on the close of bar 4 for a scalp. They also could have bought on the close of the bull trend bar after bar 9 or on the close of the bull trend bar that followed it.
This is a good example of an average major trend reversal attempt, where the setups and context are acceptable but not strong, and the reversals up led to a trading range and not a bull trend, as is the case about 70 percent of the time. The bar 3 lower low led to a test of the bar 1 high, which was a likely top of an evolving trading range. Some traders took full or partial profits there, while others held, expecting a second leg up, and exited on the failed breakout of the trading range at bar 10 (as the bear bar turned down, or below its low). The bar 3 lower low resulted in a scalper’s profit for traders who exited as bar 5 turned down, and a swing profit (a reward that was at least twice as large as the risk) for traders who exited in the reversal down after bar 10. The traders who bought the bar 7 two-legged higher low either had a small loss if they held until their protective stop was hit, or they got out around breakeven if they moved their stop to breakeven after a four-bar rally above the moving average. The traders who bought the bar 9 double bottom higher low (higher than bar 3), which was also a lower low for the reversal up from the small bear trend (bull flag) from bar 5 to bar 7, were able to exit some or all with a reward that was at least twice as large as their risk (a swing profit).
In an average setup like this, the chance of a profitable swing is about 40 percent, and there is about a 30 percent chance of a small profit, and a 30 percent chance of the protective stop being hit (a small loss). The result is still a profitable strategy. In the strongest setups, the chance of a profitable swing is 60 percent or greater, and maybe only a 30 to 40 percent chance of the protective stop being hit and leading to a small loss. Because the trader’s equation is so strong, this is an excellent setup for all traders, including beginners.
FIGURE 3.3 A Trend Line Break Alone Does Not Make a Reversal
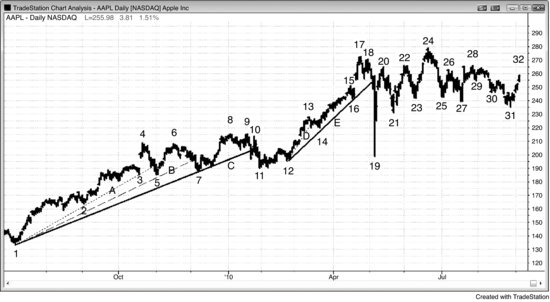
Just because there is a break of a bull trend line and then the market moves to a higher high, it is not always prudent to look for shorts. If there is a trend line break, but the move to a higher high goes five or more bars above the old bull high, traders usually should begin the process from the beginning and wait for another break below a bull trend line and another test of the bull trend high before going short. The daily chart of AAPL shown in Figure 3.3 had a break of the bull trend line (the solid line C) on the move down to bar 11. The market then rallied to a new high at bar 13. However, the move to bar 13 was in a very steep bull channel (the dotted D bull trend line is the bottom of the channel) and therefore traders should have waited before shorting. It is always better not to short the first breakout of a steep bull channel. Wait to see if there is a pullback to a higher high or lower high. The market corrected sideways and formed a double bottom bull flag (a high 2) at bar 14, and there never was a breakout pullback to set up the short. The move to bar 13 was a successful breakout that led to a resumption of the bull trend, and not a failed breakout that led to a reversal process.
The market had been in a bull trading range from bar 3 to bar 11, and the move from bar 12 to bar 13 was a strong spike up that broke above the large bull flag. When the move to the higher high is so steep with so little overlap, the odds favor a successful breakout and about a measured move up instead of a reversal. Once this happens, the process of looking for a reversal begins again. Wait for a trend line break, like the move down to bar 19, and then for a higher high, double top, or lower high test of the bull high. Although there were several tradable swings after bar 19, bar 19 was a climax reversal up (a spike down and then a spike up), and this is usually followed by a trading range. During the trading range, the bears who created the spike down to the bar 19 low were continuing to short and trying to generate a bear channel, and the bulls who bought the bar 19 low were continuing to buy in an attempt to create follow-through to the upside in the form of a bull channel. Incidentally, the bulls saw bar 19 as simply a large breakout test of the breakout above bars 8 and 9. Since bar 19 fell below the bar 9 breakout point, the breakout gap was negative, but because the market rallied quickly up, it nonetheless was a type of breakout gap.
The move down to bar 5 broke the dotted trend line A, and bar 6 was a reasonable double top short setup.
The move down to bar 7 broke the dashed trend line B. The move up to bar 8 was in a steep channel, so it was better to wait for a breakout below the channel and then wait to see if there was a breakout pullback to short.
Bar 9 was a two-legged move up to a double top and an acceptable short.
Bar 10 was a double top bear flag and another short setup.
Bar 19 was obviously caused by some news event (it was the 2010 Flash Crash), but that is not important. What is always more important is who controls the market during and after the bar. It was in part a breakout test of the middle of the trading range between bars 4 and 12 (a test of the bottom of the channel from bar 11 to 17). Many traders expect a breakout to be tested, and once the market begins to move quickly in that direction, as it did as bar 19 was forming, the strongest bulls began to believe that the market might fall all of the way back to the bottom of that trading range. So, what should they do once they believe that the market is going lower? It does not make sense for them to keep buying when they can soon buy lower. This absence of buying results in the market getting sucked down quickly in a sell vacuum to the level where the bulls believe that it will find support. Even though they thought that there was value as the market was falling (you know this because the market quickly reversed up above most of the entire bar), they believed that it had further to go and waited until it reached support. Since they saw the market as offering tremendous value that they thought would be very brief, they appeared out of nowhere and bought aggressively. The bears saw the same thing and quickly took profits, buying back their shorts. There was no one left to sell and the market rallied strongly. Momentum programs accelerated the fall and the rally back up, because they detect strong momentum and trade relentlessly in its direction until the momentum slows, and then they exit with their profits. Spikes like this are common in trends. However, the test of the bottom of a channel usually leads to a trading range as it did here. Big up + big down = big confusion = trading range.
FIGURE 3.4 If a Test Is Too Strong, Wait
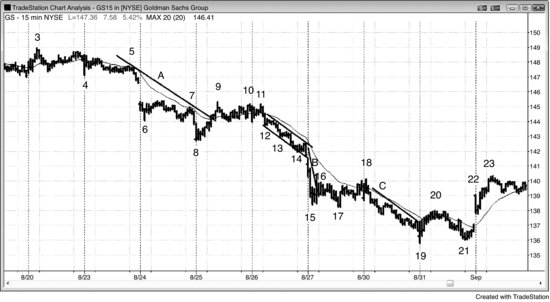
If the test of the low has too much momentum, another leg down is more likely than a reversal up. In Figure 3.4, GS broke above the bear trend line A, but the sell-off from bar 11 to test the bar 8 bear low was in a steep bull channel. Rather than buying above bar 13 or bar 14 and looking for a failed breakout and a trend reversal, traders had to consider that GS might be successfully breaking out to the downside. The move down to bar 13 and then to bar 14 was in a steep bear channel, instead of a low-momentum sell-off with pullbacks along the way. When that happens, it is better to wait for a breakout above that bear channel and then see if a breakout pullback forms. If one does, it is a buy setup for a higher low or lower low trend reversal up.
Once the market fell below the bar 14 wedge (bars 12 and 13 were the first two pushes down in this bear channel that followed the spike down to bar 12), it spiked down to bar 15 in about a measured move (using the height of the bars 12 to 14 wedge).
The trading range to bar 18 broke the steep trend line B, but again the market broke to the downside in a steep bear channel instead of a low-momentum test of the bar 17 bear low.
The rally to bar 20 broke bear trend line C and there was a higher low buy setup at bar 21. The move down to 21 had three small legs and many overlapping bars, indicating two-sided trading. This was a lower-momentum move and more likely an attempt at a higher low major trend reversal than a breakout to another bear leg.
FIGURE 3.5 Don’t Look for Reversals on Smaller Time Frame Charts
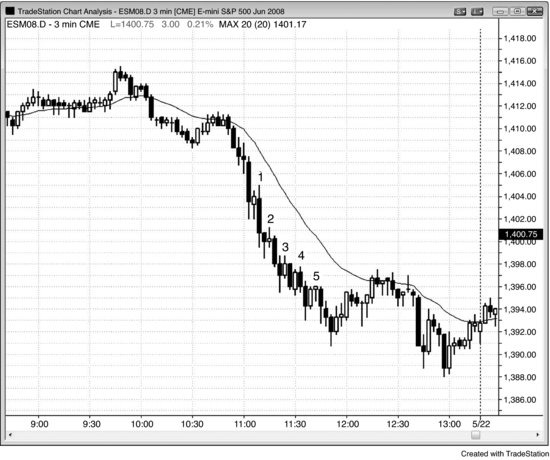
When there is a strong trend, there will be many reversal attempts on the 3 minute chart (see Figure 3.5) and far more on the 1 minute chart. Until there is a clear reversal on the 5 minute chart, if you choose to look at the 1 or 3 minute charts, you should treat each reversal attempt as a with-trend setup, here, a bear flag. Each of the five attempts on this 3 minute chart to reverse attracted eager bulls who thought they were risking little and might be gaining a lot if they were catching the bottom of a climactic V bottom reversal, a very rare event. Rather than joining them, think about where they will have to sell out of their longs, and place an entry sell stop at that very location. You will consistently succeed in transferring money from their accounts into yours, which is the primary objective of trading. For example, as soon as the bulls went long at the bull reversal bar before bar 1 (there was not a prior trend line break in this steep sell-off, so no longs should have been considered), smart traders would have placed orders to go short on a stop at one tick below the signal bar. As with all bear channels, you can also short on a limit order at the high of the prior bar. If you don’t get filled on the limit order, make sure to short on a stop below the low of every pullback bar.
The short at bar 4 was below the long entry bar, since the bulls would have tightened their stops once the entry bar closed. The bull entry bar was the bear signal bar. Since this is a trend, they would swing a large part of their positions.
Bar 5 was an ii pattern, which is often a reversal pattern (but it needs an earlier trend line break), and it is commonly the final flag before a two-legged countertrend move, as was the case here. It represents balance between the bulls and the bears, and a breakout is a move outside of the balance. There is often a strong force pulling it back to the pattern, and usually through the other side. Since there was no prior trend line break, the only breakout that was a valid entry was a bear breakout. However, an ii pattern is just wide enough to break a small trend line, so any reversal up within a few bars afterward is a valid long.
Some aggressive traders turn to smaller time frame charts for setups that will allow them to enter in the direction of the trend. For example, if a trader was trading the Emini and saw the sharp sell-off on his 5 minute chart and was looking for a reason to short, he could have looked at the 3 minute chart above. Once he saw five or more consecutive bear bars, he could then place a limit order to short at the high of the prior bar, expecting the first reversal attempt after a strong bear spike to fail. He would have gone short on bar 1 as it moved above the high of the prior bar.
FIGURE 3.6 Smaller Time Frames Are for With-Trend Trading Only
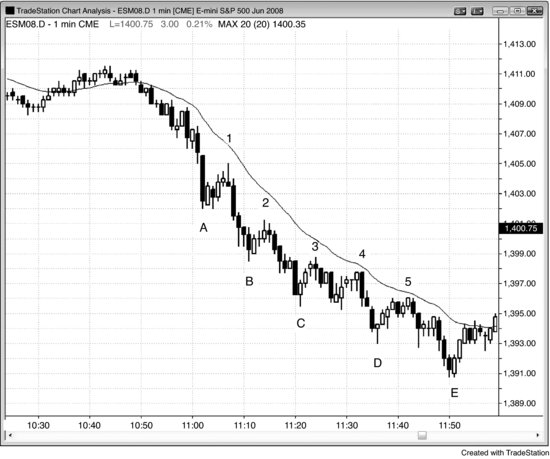
Figure 3.6 is the 1 minute chart of the same bear move shown in Figure 3.5, and the numbered bars are the same as on the prior chart. Bars C, D, and E were valid countertrend setups that followed two legs down and small trend line breaks; each was a tradable long scalp. Although these were possible to trade, it is usually too difficult to read a second chart and place orders this quickly, and you would likely make more money if you just traded the 5 minute trend. It looks very easy on a chart printed at the end of the day, but is much more difficult in real time. If you were to sell based on the 1 minute chart, all five of the numbered bars provided with-trend (on both the 1 and 5 minute trend) short entries that would have allowed for swinging part of the position.
Bar 1 was a small spike top, but since it formed in a bear trend, there was no need for it to be tested. This is unlike the spike bottoms at C and D. Spike bottoms in a bear trend usually get tested, as they did here.
The two-legged sideways move to bar 4 broke the bear trend line that could be drawn across the highs of bars 1 and 2. Why should traders not yet be looking to buy a test of the bar C low? Because the trend line break has to be during a strong move up. The move to bar 4 was so weak that it never even reached the moving average. If it had, it would have set up a 20 gap bar short. The bear trend was too strong for traders to be looking for longs. They should only have been shorting.
FIGURE 3.7 Smaller Time Frame Reversals Are Losers
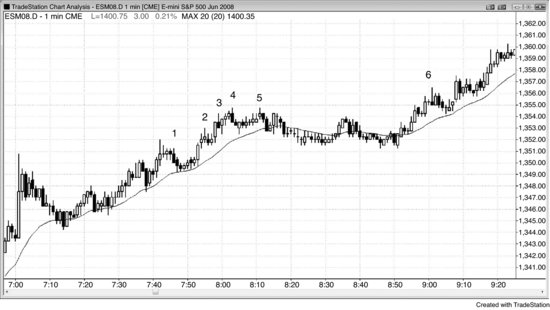
A 1 minute chart allows for smaller stops, but the reduced risk alone does not make a trade worth taking. Remember the trader’s equation. The chance of success also drops, and in fact this more than offsets the reduced risk; the result is a losing strategy.
Figure 3.7 is a 1 minute chart of a strong bull trend on a 5 minute chart (not shown). Trading shorts profitably is difficult (none of the six shorts yielded a four-tick profit). It is far more profitable and less stressful to simply look for with-trend entries on the 5 minute chart and never look at the 1 minute chart. The only valid reason to look at 1 minute short signals is to find long (with-trend) entries. Once a short triggers, look for where the protective stops are and place buy orders there, since the trapped shorts will push the market to your long profit target as they buy back their losers.
FIGURE 3.8 Micro Double Bottoms and Tops
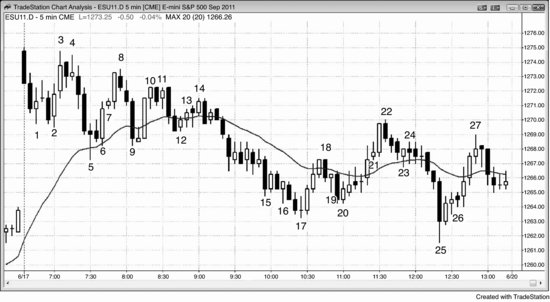
Most tradable reversals begin with at least a micro double bottom or top, a traditional double bottom or top, or a final flag reversal, which can be considered a type of double bottom or top. As shown in Figure 3.8, traders who anticipated a reversal down placed limit orders at and above the signal bar of what they thought would become the final bull flag of the leg, whether the setup was a high 1, high 2, or triangle. When they expected a reversal up from a down leg, they placed limit orders at and below the signal bar of what they believed was likely to be the final flag (a low 1, low 2, or triangle) of the bear leg. Examples of micro double bottoms were bars 1 and 2, 5 and 6, 16 and 17 (15 and 16, but the entry never triggered), and 19 and 20. Micro double tops were at 3 and 4, 10 and 11, and 13 and 14. Bar 8 was a reversal from the bar 7 one-bar final flag, a double top with bar 4, a lower high in a bear channel, and a low 2 in a trading range (bar 6 was the low 1).
The bar 17 low formed a small wedge around a measured move down from the upper trading range on what, at that point, was likely to be a trending trading range day. It was also a two-legged lower low from the breakout below the ii final flag that followed bar 15, and a double top with bar 23.
Intraday reversals often come from larger patterns, and not just micro double bottoms and tops. Bar 22 was a two-legged rally that tested the apex of the triangle (the upper trading range on this trending trading range day was the triangle that broke out four bars after bar 14). Bar 25 was a sell climax and lower low breakout pullback from the two-legged breakout to bar 22 above the bull flag that ended at bar 17 (the entire move from the open down to bar 17 was a pullback after a big gap up and a huge rally yesterday and was therefore just a large bull flag).
The sell-off to bar 9 was a double bottom bull flag with bar 6. Bar 27 was a double top with bar 24 and the second leg up from the bar 25 low. Bar 27 was the first bar of a micro double top, because the bar after it had a big tail on its bottom, indicating that the market went down, and then up. The top of that doji inside bar formed a micro double top with the high of bar 27, and aggressive bears shorted below its low, which was the entry for the breakout below the micro double top.
As dramatic as the bar 25 sell climax was, it was just a micro double bottom on a higher time frame chart (it was a three-bar-long micro double bottom on the 60 minute chart). Institutions anticipated the bottom and scaled into longs as bar 25 was forming, especially as it broke out below the bar 17 low. They expected the breakout to fail and therefore offer a brief opportunity to buy at a very good price. Since they control the direction of the market, if enough of them expect the bottom, their buying will make it happen. The two-legged rally to bar 22 broke above the bear trend line, and the sell climax to bar 25 was a lower low that became the bottom of a major trend reversal up. The rally lasted two more days.
Just because a market forms a double bottom or top does not mean that a reversal trade should be taken. The decision has to be based on context. For example, the double top at bar 27 followed six bars up and a strong sell climax, so the market could easily have gone sideways.
There were several examples of small final flag reversals that followed low and high 1 setups, resulting in micro double tops and bottoms. The bulls saw the doji bar after bar 1 as a weak low 1 breakout pullback sell signal. They bought at and below its low, expecting a bull opening reversal and low of the day. The doji became the final bear flag in the leg down, and bar 2 formed a double bottom with the bar 1 low.
The bear inside bar after bar 3 was a high 1 buy signal, but many traders thought that if the market could hold below the top of the strong two-bar bear spike at the open, it could form a double top and then have a downside breakout. Bears shorted at the high of the bear inside bar, expecting it to become a failed high 1, which would also be a one-bar final flag and a double top.
The bear inside bar after bar 5 was a breakout pullback sell signal bar. Bulls thought that the test of the moving average would hold and that the inside bar would become a one-bar final bear flag and lead to a double bottom reversal up from the moving average. They bought at the low of the bear signal bar.