CHAPTER 4
Climactic Reversals: A Spike Followed by a Spike in the Opposite Direction
The market is always trying to break out, and then the market tries to make every breakout fail. This is the most fundamental aspect of all trading and is at the heart of everything that we do. Every trend bar is a breakout, which might have follow-through and succeed, or fail and lead to a reversal. Even a climactic reversal like a V bottom is simply a breakout and then a failed breakout. The better traders become at assessing whether a breakout will succeed or fail, the better positioned they are to make a living as a trader. Will the breakout succeed? If yes, then look to trade in that direction. If no (and it becomes a failed breakout, which is a reversal), then look to trade in the opposite direction. All trading comes down to this decision.
Many people restrict the definition of a climax to a sharp move at the end of a trend that is followed by a sharp move in the opposite direction, resulting in a trend reversal. A broader definition is more useful to traders: any type of unsustainable behavior should be considered to be a type of climax, whether or not a reversal follows. Just how small can a climax be? As mentioned in Chapter 2 of book 1, every trend bar is a climax, although most do not result in climactic reversals. Any trend bar or series of trend bars where the bar or bars have relatively large ranges are climaxes, even though most traders would not think of them this way. A climax ends as soon as there is any interruption of the strong trending behavior, such as the formation of a pause bar or a reversal bar. Even a single large trend bar can be a climax. Most climaxes are usually followed by a trading range that lasts one or more bars, instead of by a spike in the opposite direction, and the trend often resumes instead of reverses. A climactic reversal is a climax that is soon followed by a sharp move in the opposite direction, and all are failed breakouts of something. For example, if there is a trading range in a bull market and it has a bear leg down from the top, this leg down is a bear channel and therefore a bull flag. If the market has one or more bull trend bars breaking above the channel, it is a breakout of the bull flag. If the market then reverses down, even if the reversal is from a lower high (the buy climax did not break above the trading range), this is still a climactic reversal. When a market is moving climactically, fundamental traders often refer to the market as being a crowded trade, meaning that they believe that too many people already have a position, so there might not be many traders left to keep pushing the market further in the trend. For example, if the market is moving up parabolically, the fundamental analysts will often say that it is a crowded trade and that they would only look to buy a pullback. Most would not advocate going short, even though they believe that a significant pullback is imminent. Other examples of buy climaxes include the 2006 housing bubble, the tech wreck of 2000, and the tulip mania of 1637. They were all examples of the greater fool theory of investing—buy high with the expectation that someone dumber than you will buy from you even higher, allowing you to exit with a profit. Once there are no fools left, the market can go in only one direction, and it often goes there quickly. China and Brazil might be developing bubbles, because they appear to be growing at an unsustainable pace. Momentum traders might be responsible for much of the growth at this point, meaning that its pace is not sufficiently based on fundamentals. Once profit takers come in, the reversal could be fast and deep. Investors could panic as they attempt to exit with at least minimal profits, and the hope of averting a big loss, as is the case with any climax.
Sometimes when the market is in a strong trend, a bar forms that has an exceptionally large range and body, and it may open near one extreme and close near the other. This can be either a climax or a breakout. For example, suppose the market is selling off and then a bear trend bar forms that opens near its high and closes near its low, and the body and range are the largest of the down move, maybe twice the size of many of the bear trend bars. This bar might represent the last desperate longs who are so eager to get out that they are selling at the market instead of waiting for a pullback. They are finally giving up and want out at any price. Once the last long has exited, there is no one left to short. The institutions are not shorting here because they already shorted much higher. In fact, they are taking profits on their shorts at the bottom of the bar and many are likely going long there. The market can then reverse up sharply within the next couple of bars once traders sense that there is no significant follow-through selling. However, if that large bear trend bar is a breakout of one or more areas of support, it might generate a measured move down before attempting to reverse again.
An important component of a climax is a vacuum effect created by the absence of traders in the opposite direction. For example, if the market is accelerating to the upside toward the top of a bull channel, there will be institutional bears who believe that the market will soon reverse, but that the market will likely first break out above the trend channel line. Why would they choose to short as the market is racing toward the line when they believe that it will soon be above the line? It makes no sense for them to go short when they think that the market will soon be higher and they could short at an even better price. So what do they do? They wait. The same is true for the strong bulls. They are looking to take partial or full profits, but if they believe that the market will soon be a little higher, they will not sell until the market reaches a resistance area that they think the market will likely not exceed, at least for the time being. This means that there are some very strong bears who are not shorting, and some very strong bulls who are not selling out of their longs, and the absence of selling creates a vacuum that sucks the market up higher to a level where the bears feel there is value in shorting and the bulls feel there is value in taking profits. The programs that detect the momentum early on in a bar see this and quickly buy repeatedly until the momentum slows. Because these buy programs will buy up to the final tick and are relatively unopposed, the market races up in a strong bull spike that can last several bars. But what happens once the market reaches a level where the bears feel that there is value and the bulls feel that the market is unlikely to go much higher before a pullback, like several ticks above that trend channel line? These huge institutional bears will begin to short heavily and relentlessly, and the strong bulls will sell out of their longs, because they feel that this price level is a great value. The buy programs will see the loss of momentum and sell out of their longs. Since it is such a great value for shorting and profit taking, it cannot last long, so bulls and bears sell very aggressively on this brief opportunity. Since both the strong bulls and the bears expect lower prices, that’s what will follow. With all of the major traders selling and no longer buying the market reverses down, at least for about 10 bars and a couple of legs. At that point, they will decide whether the pullback has ended and the bulls should buy back their longs and the bears should scalp out of their shorts, or they believe that the sell-off has further to go.
The weak traders do the opposite as the market is racing up: the weak bulls who were sitting on the sidelines finally buy, and the weak bears cover their shorts, both unrealistically afraid of another big leg up. Experienced traders can do exactly what the institutions are doing. For example, they can short the close of that strong bull trend bar, above its high, or at the close of the next bar or two. If they do, they should use a stop that is about as many ticks as the bull trend bar is tall. If they wait for a bear reversal bar and short on a stop below its low, they can risk to above the signal bar’s high. Alternatively, they could use a wider protective stop to allow for one more minor high, but if they do, they need to reduce the size of their position.
The strong bulls keep buying during the bull spike because they, too, believe that the market will go higher. However, at some point, they know that the market will have gone too far, too fast, and that there will be just a brief window where they can sell out of their longs with a windfall profit. If they wait too long, the pullback might become a reversal and they will lose out on the opportunity to exit at a very high price. They then seize this brief moment to sell out of their longs. Their aggressive profit taking combined with the aggressive selling by institutional shorts makes the market fall very quickly for a bar or two or even longer, and this creates a climactic reversal. The bulls will try to buy back lower, hoping that the reversal will fail, but if they are not able to push the market back up, they will sell out of their longs once again. The bears who sold higher are continuing to sell down here, and both they and the bulls are fighting in a trading range over the direction of the channel that will follow. If the bears win, there will usually be a spike and channel bear trend with the spike being the sharp move down from the climactic top. If the bulls win, there will usually be a spike and channel bull trend with the spike being the sharp move up to the top of the buy climax.
Spikes are tests of the strength of both the trend and countertrend traders. A bull trend is made of a series of higher highs and lows, both of which can be created by spikes. If the market has a spike up in a bull trend and then a selloff in the form of a spike down, the probability is that the market will test and exceed the top of the bull spike, but not come back and test the bottom of the bear spike. The bull spike will be just another leg up in the bull trend and the spike down will usually just evolve into a bull flag and a higher low, and will likely not get tested once the bull trend resumes. The same is true for a bear trend, which is made up of lower highs and lows. The most recent new low, whether or not it is in the form of a spike, will likely get tested and exceeded after any pullback. Any rally, whether it is in the form of a strong bull spike or a quiet move up, will likely evolve into a bear flag and just another lower high, and will usually not get tested. There is a widely held, but incorrect, belief that the strongest rallies occur during bear trends and the strongest selloffs occur during bull trends. While this is not true, it is important to realize that countertrend spikes can be exceptionally strong and make many traders believe that the trend has reversed. All spikes, up and down, in bull or bear trends or in trading ranges, are simply tests of the determination of the countertrend traders and the resolve of the with trend traders. The pullbacks often come close to flipping the always-in position to the opposite direction, but there is inadequate follow-through. Strong traders love these reversal attempts, because they know that most will fail. Whenever the countertrend traders are able to create one, the with trend traders come in and heavily fight the reversal attempt, and usually win. They see these sharp countertrend moves as great opportunities to enter in the direction of the trend at a great price that is likely to exist only briefly, and quickly become simply a spike pullback in the trend.
Every pullback is a small trend, and every trend is just a pullback on a higher time frame chart. This includes the 1987 and 2008–2009 stock market crashes, which were just pullbacks to the monthly bull trend line. Every countertrend spike should be considered to be a vacuum effect pullback, and many pullbacks end with or soon after very strong trend bars that are attempts to reverse the trend. For example, if there is a sharp bear spike in a bull trend on the 5 minute chart and then the market suddenly reverses into a bull leg, there was an area of support at the low, whether or not you saw it in advance. The bulls stepped aside until the market reached a level where they believed that value was great and the opportunity to buy at this great price would be brief. They know that most attempts to reverse fail, and that many reversal attempts have strong bear trend bars. They bet against the follow-through selling that traders would need to see to be confident of an always-in reversal, and they came in and bought aggressively at the close of the bar and as the next bar was forming. Since there was no one left to short, the market raced up for many bars, ending the pullback and resuming the trend. The smart bears were aware of that magnet, and they used it as an opportunity to take profits on their shorts.
The market is always trying to reverse (although most attempts fail), and a successful reversal needs follow-through to convince traders that the always-in direction has flipped. These spikes come close to forming convincing flips, but fail to have enough follow-through. The result is that they make traders wonder if the always-in position will flip, but when the follow-through is inadequate, they decide that the reversal attempt will fail. The bulls then see the spike down as a brief opportunity to buy at a great price. The bears who shorted near the bottom of the bear trend bar and higher also realize that the reversal attempt is failing, and they quickly buy back their shorts and step aside until they see another opportunity to try to take control of the market again. The result is a market bottom on the 5 minute chart. That bottom, like all bottoms, occurs at some higher time frame support level, like a bull trend line, a moving average, or a bear trend channel line along the bottom of a large bull flag. It is important to remember that if the 5 minute reversal was strong, traders would buy based on that reversal, whether or not they saw support on the daily or 60 minute chart. Also, traders would not buy at that low, even if they saw the higher time frame support, unless there was evidence on the 5 minute chart that it was forming a bottom. This means that they do not need to be looking at lots of different charts in search of that support level, because the reversal on the 5 minute chart tells them that it is there. If they are able to follow multiple time frames, they will see support and resistance levels before the market reaches them, and this can alert them to look for a setup on the 5 minute chart when the market reaches the magnet; but if they simply carefully follow the 5 minute chart, it will tell them all that they need to know.
Stock traders routinely buy strong bear spikes in bull trends because they see the spike as a value play. Although they usually look for strong price action before buying, they will often buy a stock that they like at the bottom of a sharp sell-off, especially to the area of the bull trend line or other support area, like a trading range low, even if it has not yet reversed up. They believe that the market is temporarily, incorrectly underpricing the stock because of some news event, and they buy it because they doubt it will remain discounted for long. They don’t mind if it falls a little further, because they doubt that they can pick the exact bottom of the pullback; but they want to get in during the sell-off because they believe that the market will quickly correct its mistake and the stock will soon rally.
A climax is simply any market that has gone too far, too fast in the eyes of traders. It is a trend bar or a series of trend bars with little overlap, and it can occur at any time, including as a breakout, at the start of a trend, or after a trend has gone on for many bars. The market pauses after the spike, and then the trend can resume or reverse. When there is a large spike and it is followed either immediately or soon thereafter by a spike in the opposite direction, the market is trying to reverse. When this happens, it creates a climactic reversal, which is a two-bar reversal that may be visible only on a higher or lower time frame chart. For example, if there is a bull trend that has gone on for 20 bars and now has the largest bull trend bar of the entire trend, traders will wonder if it is a climactic end to the trend (a blow off top). If there is then a strong bear trend bar or two on the reversal down, the bear spike forms a two-bar reversal with the final bull trend bar or bars of the climax, whether or not there were several bars separating the final bull trend bar and the first bear trend bar. On a higher time frame chart, traders can see a simple two-bar reversal. This will be a simple reversal bar on an even higher time frame chart. As long as you understand what the market is doing, there is no need to look through several time frames in search of a perfect two-bar reversal setup. You know it exists by what you are seeing on the chart in front of you, and that is all you need to place a trade.
Both bulls and bears will sell when there is a second or third consecutive buy climax without much of a correction between the climaxes, and this selling can lead to a climactic reversal. The bears are selling to initiate shorts for what they believe will be at least a scalp down. The bulls see the final large bull trend bar or two as a great price to take profits, since they believe it is likely at least a temporary end of the trend, and beginning of a deeper pullback, a trading range, or an opposite trend. They expect the market to trend down for about 10 bars and two legs, and are afraid that the bull trend might have ended and the old high might not be exceeded. When there is a second buy climax and then a reversal setup, both bulls and bears wonder if the market is setting up a final flag reversal (with the pullback after the first buy climax being the final flag). When the reversal signal bar forms after a third push up, traders wonder if the market is creating a wedge top. The opposite is true after consecutive sell climaxes where traders look for possible final flag and wedge bottoms.
When the climax is very impressive and the context is right, they will sell out of their entire long positions. If they thought that the market would only fall a few ticks, they would not exit their longs and then try to buy a couple of ticks lower. They are exiting because they expect that they will be able to buy low enough below their exit price that the additional profit will more than make up for transaction costs. They are also concerned that the market might reverse into a bear trend, or at least into a deep enough pullback so that the market might not make another high for more bars than they would be willing to wait. Because they are not looking to buy until the market trades down significantly, there is an absence of buyers. Also, strong bears will short as the market falls. Because there are more sellers than buyers, the pullback can be sharp and even become a trend reversal. If the market instead continues up after their exit, they will look to buy again higher or on a pullback. If the market begins to turn down, they will look to buy lower if there is a setup, but usually not for about 10 bars. If there is no buy setup after 10 or 20 bars, then the trend has likely reversed to down, and then traders would not be looking to buy. If there is a buy setup after about 10 bars and two legs, the bulls will reinstate their longs and the bears will take profits on their shorts.
Consecutive climaxes increase the chances of a correction. For example, if there is a buy climax (one or a few large bull trend bars) and then only a brief pause or pullback and then a second buy climax, the odds of a significant correction or a reversal are higher. If there is instead just another small pullback and then a third buy climax, the market will usually begin at least a two-legged correction that will last at least 10 bars. The pause can be any bar that is not another big bull trend bar. A doji with a bear or bull body or a bear trend bar, which might be small, are the most common pauses. The pause bar sometimes has a high that is slightly above the high of the second buy climax bar, but still acts as a one-bar final flag and leads to a reversal after the third climax. The third climax is usually only one or two large bull trend bars. The consecutive climaxes indicate that the market might have gone too far, too fast, and bulls might then only be willing to buy much lower. Two consecutive buy climaxes create two pushes up and is effectively a double top, even though the second high is much higher. Three consecutive buy climaxes is a wedge top. The second top can be far above the first and the third can be far above the second, and the pattern can look more like a bull spike than a wedge. However, they have the same implications and can be traded the same. Only very experienced traders should short buy climaxes because it is easy to misread the price action and end up shorting a strong bull where there really is no significant climax or reversal pattern.
If a pullback after a buy climax lasts 10 or more bars and it breaks out of the bottom of a bull channel, it usually has sufficiently worked off the excess so that if there is another buy climax, there is less of a sense of excess and less of a need for a big correction. Some trends have a series of strong breakouts and then trading ranges. Each breakout is a spike and therefore a buy climax, but the trading ranges that follow show that the strong bulls are still buying near the high. This means that the breakout was created more by strong bulls than by weak bears who were buying back their shorts in a panic. The market is now going sideways because the strong bulls believe it will go higher and are not waiting for lower prices, and the strong bears are not shorting aggressively, because they too believe that the market will go higher. It does not make sense for them to begin to establish shorts if they believe that they will be able to do so higher.
The reversal spike can be smaller or larger than the trend spike, and if it is larger, the odds of a reversal are greater. After the initial move of the reversal spike, the market then either pauses or forms a trading range, which can be brief or last for dozens of bars. During this pause, both the bulls and the bears are adding to their positions in an attempt to get follow-through in the form of a channel in their direction. For example, if there is a strong spike up and then a strong move down, both the bulls and the bears are being aggressive. The spike down can be in the same bar as the spike up, and when that happens, there will be a large tail at the top of a large bar. On a smaller time frame, there would be one or more bull trend bars followed by one or more bear trend bars. Alternatively, the spike down can be on the next bar or even several bars later. On a higher time frame, the reversal would simply be a bull trend bar immediately followed by a bear trend bar, creating a two-bar reversal. On an even higher time frame, the reversal would be a single reversal bar. The spike down may have follow-through over the next bar or several bars. Whether or not it does, the market will soon pause or correct some back up. Very often, it will form a trading range that can be brief or last for dozens of bars. The bulls are buying more, trying to push the market up into a bull channel, and the bears are selling in the trading range, hoping for a channel down. At some point, one side will win and the other side will be forced to cover. If the bulls win, the bears will buy back their shorts, adding to the buying pressure and increasing the strength of the rally. If the bears win, the bulls will have to sell out of their longs, and this will enhance the force of the bear channel.
When a climactic reversal occurs in a trend, the reversal usually takes place after a breakout of a trend channel line. A reversal back into a channel often leads to a test of the opposite side of the channel, which offers a good trading opportunity. Because of this, it is important to be looking for channels, and if you see a breakout through the trend channel line and an immediate and strong reversal, be prepared to take the reversal entry. Sometimes the trend will resume within a bar or two and break beyond the channel line again and that second breakout will also fail. When that happens, the reversal trade is even more reliable.
Sometimes a double top bear flag forms within the trading range after a buy climax, providing an additional reason to enter short into a trend reversal trade. If instead there is a double bottom bull flag, it is a buy setup. The opposite is true after a sell climax. If there is a double bottom bull flag after the spike up off the low, it is a buy setup. If the trading range after the reversal up instead forms a double top, it is a sell setup.
The reversal leg that leads to the trading range is often relatively small compared to the prior trend, but it usually breaks the trend line and it can be the first leg of an opposite trend. Despite that, it still can be easy to overlook, so whenever there is a climactic move, it is something that you should try to find. It may have a low-momentum drift toward the old extreme, leading to a failed test (a lower high at a bull top or a higher low at a bottom), or it could continue to a new extreme and there may not be a reversal. If instead it does reverse, the new, opposite trend sometimes becomes very strong very fast and often forms a spike and channel trend pattern.
An inside bar after a breakout bar is often soon followed by a trend bar in the opposite direction, creating a climactic reversal setup. As with all climactic reversal setups, the channel that follows can go either way, and the important thing is to be aware of both possibilities. Once the trend begins, look for with-trend setups.
Sometimes there can be an impressive spike, then a pullback, and then the start of a channel, only for the channel to fail and reverse direction. In hindsight, that pullback was the spike in the opposite direction and it led to a channel in the opposite direction. However, once you recognize it, then you know there is an opposite, new trend and you should try to take every with-trend entry.
Strong climactic reversals without a significant test of the extreme occur only a few times a month on 5 minute charts. These are sometimes called V bottoms and inverted V tops, which are simply two-bar reversals. The up and down spikes can contain many bars, but there is always a higher time frame where the pattern is a simple two-bar reversal. However, as with any type of reversal pattern, most attempts to form a climactic reversal fail, or the market at least tests the spike before reversing. In a bull market, most spike tops get tested, and in a bear market, most V bottoms get tested, no matter how emotional and strong the reversal appears to be. This is because these climaxes are reversal attempts, and traders know that most reversals fail. They are not willing to trust a reversal unless it gets tested.
However, if there is a bull trend and a pullback ends in a strong, emotional spike down, the low of that spike may or may not get tested. Once everyone senses that the pullback has ended and the trend is resuming, traders are eager to buy the trend. There is no hesitancy or uncertainty and there is no need for a test. Here, it is the bottom of a bull flag and not the bottom of a bear trend that is trying to reverse into a bull trend. Similarly, when there is a spike top in a pullback in a bear trend, the top of the spike may or may not get tested. It is just the top of a bear flag and not the top of a bull trend that is in the process of reversing.
Climaxes, parabolas, and V tops and bottoms all have one thing in common, and that is their slope. Instead of it being linear (a straight line), it is curved and increasing. At some point, the market quickly reverses direction, and usually, at the very least, there will be a protracted sideways move and possibly a trend reversal. All of these patterns are simply trend channel line overshoots and reversals and therefore they should be traded as such; giving them special names adds nothing to your trading success. The trend channel line might not be obvious at the moment of the reversal, but once a parabolic move is underway, price action traders are constantly drawing and redrawing trend channel lines and then watching for an overshoot and reversal. The best reversals have large reversal bars and preferably a second entry. The first leg of the reversal will almost always break the trend line, and if it does not, then the reversal is suspect, and a trading range or continuation pattern becomes much more likely. When trading countertrend, it is better to wait for a test of the old trend before trading in the opposite direction. For example, it is a more profitable strategy to buy a higher low after a sell climax than it is to buy the initial reversal up, because too many reversal attempts fail. If a second entry fails, the old trend will likely run for at least two more legs.
Parabolic moves often have three pushes and therefore are wedge tops, which are discussed more in a following chapter. The third push is a strong breakout that runs for several bars to a support or resistance level, which may not be obvious, and then the market stalls and can reverse sharply. The breakout is beyond a two-push pattern where traders were expecting a reversal, like a higher high at the top of a trading range (or a lower low at the bottom). Remember, a higher high is just a two-legged rally, and therefore the reversal down is a low 2 short setup. Only experienced traders should ever attempt to fade a strong trend, even when it might be forming a climactic reversal. Most traders should wait to see if the always-in direction reverses before looking to trade in the opposite direction (for example, after a parabolic bull trend reverses down strongly enough to now be in a bear trend). If the market triggers the climactic reversal short after the second or third buy climax, and then rallies above the high, there is sometimes a violent breakout as traders switch from trading range mode back into bull trend mode, expecting a measured move up. If the market reverses down from a buy climax, the reversal down usually comes from some form of double top that might only be obvious on a smaller time frame chart but can be inferred from the 5 minute chart. The reversal can be sharp, or the market might pull back for several bars and form a flag, which then might break out in the wrong direction (down, instead of up), before the market then moves down as fast as it moved up. Trend lines and trend channel lines should hold and lead to reversals away from the lines, indicating that they were successful in containing the trend. Sometimes one will fail to hold the price action and the market will not stop and reverse on the test of the line. The breaking of a trend line has the opposite implication from the breaking of a trend channel line. The break of a trend line means that a possible trend reversal is underway, but breaking a trend channel line means that the trend has increased in strength and is now steeper. However, most trend channel line breakouts fail within about five bars and the market then reenters the channel and usually pokes through the opposite side of the channel (it breaks through the trend line).
A trend line break is the first step in a trend reversal, and if the break is on strength, the odds of a successful test of the trend’s extreme increase. For example, after a bear trend line break, the test of the low would likely form a higher low and then at least a second leg up, or a lower low and then at least a two-legged up move.
Steep trend lines with one- or two-bar false breakouts are reliable with trend patterns, and therefore attract a lot of traders. However, whenever a reliable pattern fails, then there will be an unusually large number of trapped traders. The reverse move will likely be a profitable trade, and it can be sharp and result in a trend reversal. These reversal attempts are common on the 1 minute chart, but it is far better to not trade countertrend off 1 minute charts since most reversals fail. You should almost always trade in the direction of the 5 minute chart.
Whenever a trend channel line fails (the market breaks through it instead of bouncing off it), you should assume that the trend is much stronger than you thought and you should look for with-trend entries. However, be aware that the trend channel line breakout might soon fail and lead to a reversal, so be prepared to exit any breakout pullback quickly if it starts to fail.
Trend channel line overshoots are parabolic moves because for the market to go beyond the trend channel line, the market is accelerating, which means that it is becoming parabolic. It the market reverses, it will usually have at least a 10-bar and two-legged correction. If it reenters the channel, it will usually poke out of the other side of the channel, beyond the trend line, and it may become a trend reversal.
Traditional technical analysis teaches that major reversals come with exceptional volume, especially at market bottoms. That is more often true with stocks, especially those that have smaller volume, but it is not a reliable sign in huge markets. Most major reversals up or down in markets like the SPY or Emini occur in the absence of clearly understandable volume patterns, although sometimes there is huge volume at a climactic market bottom, when there is a sell vacuum into a support level and the bears finally take profits and the bulls finally buy aggressively. When there is a reversal up from a bottom where one or more bars have 10 to 20 times the volume of the most of the bars of recent days, the odds of more follow-through buying are greater. Also, if there is a bull spike with 10 to 20 times the average volume and a range that is five or more times larger than most bars of recent days, the odds are good that there will be higher prices over the next many bars. The market will usually go up for at least a measured move. Much less often, the market instead falls below the bull spike and then has a measured move down.
Climactic tops are rarely as dramatic and rarely have useful volume patterns. Active traders who pay attention to volume will likely miss out on many good trades and make less money than if they simply traded on the price action alone. While it is true that most tradable tops and bottoms where the volume is unusually high will have a volume divergence on the 1 minute chart, most traders will make more money if they ignore it and carefully watch the price action on the 5 minute chart or some other higher time frame chart. The 1 minute volume divergence means that the final low will have less volume than a recent previous attempt to reverse up. There are usually tick and oscillator divergences as well, but experienced traders are aware of this when they see a tradable bottom, and will not feel a need to check for something that they already know is present.
The key to understanding climactic reversals is to realize that they are just failed breakouts. For example, when a bull trend goes on for 40 bars without much of a pullback and then has the biggest bull trend bar of the trend, and it has small tails and a close well above the high of the prior bar, giving it the look of an exceptionally strong breakout, the odds of follow-through buying are less than with all of the other breakouts earlier in the trend. This is because experienced traders will expect a transition into a trading range after a trend goes on for dozens of bars without much of a pullback. They know that the probabilities begin to favor this. If instead the market has the strongest breakout of the trend at this point, the market is trying to convert an overdone bull trend into an even steeper bull trend, and the chance of success is probably less than 30 percent. The bulls and bears look to fade the breakout, expecting it to fail and become an exhaustion gap instead of a measuring gap, and be followed by at least a two-legged, ten-bar correction to the moving average. The bulls sell out of their longs to take windfall profits and the bears short. Beginning traders do the opposite. The ones who are flat and missed the entire rally are afraid that they are now missing the strongest part of the bull trend and buy. The weak bears who have been holding, hoping for a reversal, are terrified and buy back their shorts, Both are doing the exact opposite of what the institutions are doing and are therefore doomed to lose money. The beginners are such a small part of the market that their effect is not significant, although decades ago this type of backwards behavior by beginners and experienced traders was probably an important component of climactic reversals. Today’s smart traders don’t buy in a panic, and instead fade likely climaxes. Most breakouts fail, and sometimes the strongest breakout attempts are the most likely to fail.
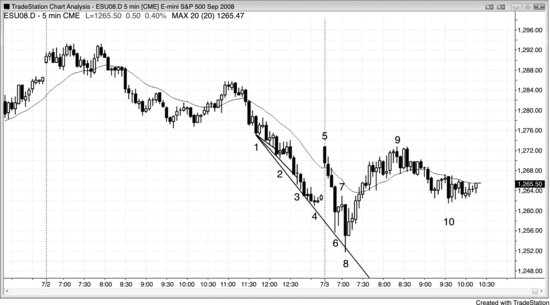
FIGURE 4.1 Late Acceleration Can Be Exhaustion
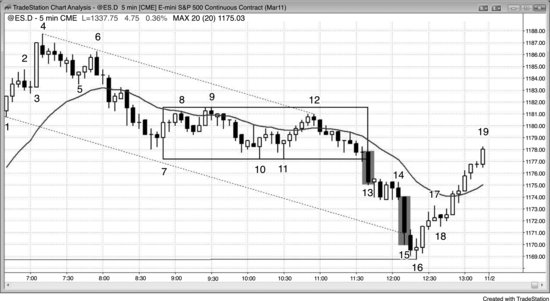
If a trend suddenly accelerates, it can be a successful breakout, leading to another leg down, or an exhaustive end of the trend. In Figure 4.1, bar 13 and bar 15 on this 5-minute Emini chart had very large ranges and bodies and followed several other bear bars, but signified opposite conditions. Bar 13 was a breakout below a trading range in a possible trend-resumption bear trend day. It became a measuring gap. Strong breakouts usually have at least two legs, as was the case here. The pullback after the second sell climax can be a single bar or several bars, and the low of one or more of those bars can be below the low of the sell climax, as it was here in the bear flag to bar 14.bar 15 was a larger bear trend bar and therefore represented even more intense selling, and the market became almost vertical. The last longs had sold out and there was no one left to sell. It became an exhaustion gap as the market reversed above its high. Consecutive sell climaxes often are followed by at least a 10-bar, two-legged reversal. (I use the phrase “10-bar, two-legged” often, and my intention is to say that the correction will last longer and be more complex than a small pullback. That type of correction usually requires at least 10 bars and two legs.) The strong bull reversal traded back into the trading range, which, like all trading ranges, was a magnet.
All strong bulls and bears love to see an exceptionally large trend bar like bar 15 after a protracted trend, because they expect it to be a brief, unusually great opportunity. A trend bar is a breakout, and since most breakout attempts fail, and this one is after a prior sell climax that did not have much of a correction and after a bull trend that has gone on for dozens of bars without a correction, the odds against a crash are very high. Smart traders see this as an unusual opportunity to buy when the probability of lower prices is very small, at least for many bars. The bears buy back their shorts and the bulls buy new longs. Both buy aggressively at the close of the bar, below its low, at the close of the next bar (especially if it is a less strong trend bar or has a body in the opposite direction), and at the close of the following bar. That bar was bar 16, which had a bull close. They also buy above the high of the prior bar. When they see a strong bull trend bar, like the bar after bar 16, they buy at its close and above its high. Both the bulls and the bears expect a larger correction, and the bears will not consider shorting again until at least a 10-bar, two-legged correction, and even then only if the rally looks weak. The bulls expect the same rally and will not be eager to take profits too early. The aggressive, experienced bulls who bought at the close of bar 15 could have used a protective stop equal to about the height of the bar, which was four points. They probably had at least a 60 percent chance of the market testing to at least the high of the bar before their stops were hit, so this was a mathematically sound trade. Once the market began to reverse up sharply, they would have swung at least part of their position into the close.
Weak traders see bar 15 in an opposite way. The weak bears who had been sitting on the sidelines, hoping for an easy pullback to short, see the market running away from them and they want to make sure they catch this next leg down, especially since bar 15 is such a strong bar. They see the large bear trend bar as a possible crash. They know that the probability is very low, but don’t want to risk missing a huge reward, which they believe will more than offset the tiny probability. The weak bulls who bought early and maybe scaled in are terrified by the rapidity with which bar 15 fell and are afraid of relentless follow-through selling, so they sell out of their longs. These weak traders are trading on emotion and are competing against computers, which do not have emotion as one of the variables in their algorithms. Since the computers control the market, the emotions of the weak traders doom them to big losses on bars like bar 15.
Bar 11 was a second-entry buy signal for a lower low major trend reversal. The two-legged rally to bar 9 broke above the bear trend line of the sell-off from bar 6 to bar 7. However, only one bar closed above the moving average, so there was not impressive buying. The five-bar bull spike up to bar 12 might have been the start of a major bull trend reversal, but it failed to have any large bull trend bars and simply tested the bar 9 top of the trading range, where it formed a double top with bar 9. At this point, the market was either undergoing a weak major trend reversal up or testing the top of a trading range in a bear market (a bear flag). The large bar 13 bear trend bar was a breakout of the bear flag and a resumption of the bear trend. The attempt at a major trend reversal failed. The trend line break and the rally off the bar 11 low both lacked consecutive, large bull trend bars, and traders never saw the market as having flipped to always-in long.
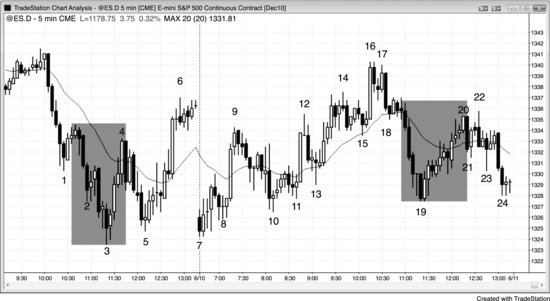
FIGURE 4.2 Spike Up but Channel Down
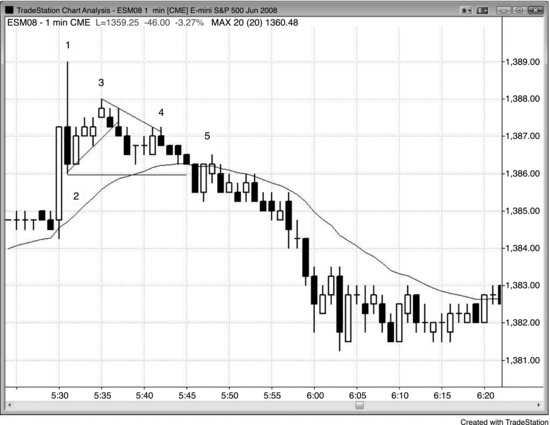
Sometimes the market will have a spike up and then a spike down. This is usually followed by a trading range as the bulls and bears fight to form a channel. The bulls are trying to create a channel up, whereas the bears want one down.
As shown in Figure 4.2, the Globex 1 minute Emini spiked up on a 5:30 a.m. PST report, but formed a strong reversal bar down at bar 1. Bar 1 was a three-point-tall bar, which is big on a 1 minute chart and therefore qualifies as a possible spike down. Bar 3 was a two-legged move up, forming a low 2 in the possible new bear trend. Also, bar 2 was an ii variation if you look only at the bodies (the body of bar 2 was inside that of bar 1, which was inside that of the prior bull breakout bar, and an ii pattern indicates indecision), and the move up to bar 3 was a false breakout of the top of the ii pattern. The market went sideways for about 10 bars, which qualifies as a trading range after the down spike. Bar 4 had a minimal break above a minor trend line and then the market resumed its downtrend. Bar 5 was a second-chance entry. It was a pullback from the breakout below bar 2 and a failed micro channel breakout.
As a general rule, big up + big down = confusion = trading range, at least for a while, as was the case after the bar 1 bear reversal bar and buy climax.
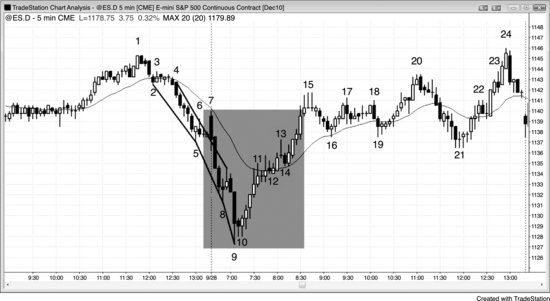
FIGURE 4.3 Spike Up and Down in One Bar
A large bar with a large tail on top is a spike up and a spike down, but in a single bar.
Sometimes the channel can be very tight as it was in Figure 4.3 after the bar 3 spike. There were more than 10 bars in a very tight channel, and this is unsustainable activity. Almost every bar had a higher high, low, and close. However, being in an unsustainable mode is not reason enough to go short, because the market can sustain this unusual behavior longer than you can sustain your account. Whenever the market does something extreme, it will soon be followed by the opposite type of behavior. An extreme trend will be followed by a trading range and sometimes a reversal, and an extreme trading range will be followed by a trend.
The tight channel is basically an upwardly sloping tight trading range, and it had to break out eventually. It broke to the upside on bar 5, and when that failed, it was likely to break to the downside as it ultimately did. The market went sideways for 5 bars and then formed a lower high at bar 7, completing a small trading range after the bar 5 spike down (it spiked up and reversed down in what had to be a spike down on a 1 minute chart). On a higher time frame chart, the sell-off to bar 2 broke below the bull trend line, and the rally to bar 5 was a higher high major trend reversal.
Bar 9 can have been viewed as an expansion of the trading range, a lower high major trend reversal after the bar 8 break below the bull trend line, or a double top bear flag (it was approximately the same level as bar 7, and at least a second attempt to rally to the bar 5 high). The name is irrelevant, but it was a good short setup. The market then trended lower for the rest of the day, and accelerated as it fell.
Bar 10 was a three-bar bear spike and the move down to bar 11 was a channel. Yesterday, bar 3 was a spike followed by a channel that began at bar 4. The start of the channel usually gets tested within a day or two (the bar 4 low was taken out with the bear trend following the climactic top that began with the bar 5 large tail, but the bar 10 high beginning of the channel down was not tested during the following two weeks).
The move to bar 12 barely broke above the bear trend line, but it was a weak move. Therefore, traders should have continued to look only for shorts and not a trend reversal. A break of a trend line alone is not enough reason to look for a reversal. The break has to be strong before traders will believe that the bulls will be able to sustain a strong move up.
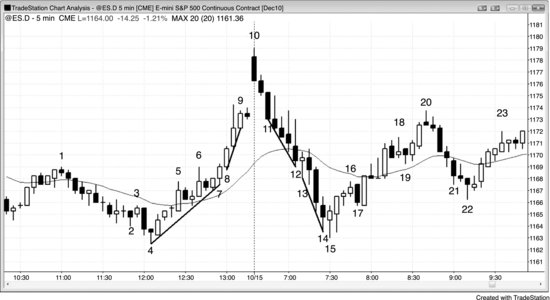
FIGURE 4.4 After a Climax, the Channel Direction Can Be Unclear for a While
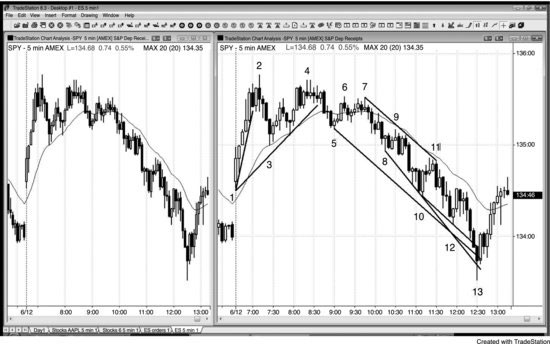
After a buy climax (a spike up and then a spike down, sometimes within a single bar), there will often be a bull channel that fails, and then the market will form a bear channel. Both charts in Figure 4.4 show the 5 minute SPY. The run-up to bar 2 was a strong bull spike. After the sharp moving average pullback to bar 3 that broke a trend line, the bull channel began. However, it failed in a two-legged lower high at bar 4. Once the market broke below the bull channel with the bar 5 pullback, which also broke the major bull trend line, it became obvious that this was not a bull spike and channel day and that the market was forming a trading range. This became a triangle top, and then a spike and channel down. Some traders saw the move down to bar 3 as the important bear spike, while others saw the move down to bar 5 as more important. Both spikes were part of the selling pressure that resulted in the bears gaining control over the market.
Bar 8 formed a double bottom bull flag with bar 3, and it was the second long entry for the moving average gap bar. Once the buy failed, it was clear that the bears were in control and that a bear channel was underway, with the push down to bar 5 being the bear spike. At this point, you should try to take all short entries and consider any longs to be scalps until there is a climactic overshoot of the bear trend channel line and reversal up. In general, it is better to ignore the long setups and just trade with the trend when there is a strong bear trend like this. Bar 13 reversed up from breaking three such lines.
Consecutive climaxes often result in a significant correction, but the odds go down if there is a significant correction after each climax. There was a sell climax down to bar 3 and another down to bar 5, but the rallies to bars 4 and 7 relieved the selling pressure and reduced the need for a sharp reversal up. However, in the bear channel from bar 7 to bar 13, there was no relief from the intense selling that occurred during the climaxes from bar 9 to bar 10 and from bar 11 to bar 12. The four-bear trend bar plunge down to bar 13 was the exhaustive sell climax that showed the capitulation of the weak traders. The third sell climax is usually the most dramatic, and it typically has a large bear spike, which overshoots trend channel lines and creates a parabolic bend to the channel. The parabolic slope indicates that the momentum down was increasing as the market was falling, and a parabolic trend usually is in its last stage. The final weak bulls gave up and sold at any price, and the final weak bears finally joined the other bears by shorting at the market during the free fall. This was the third consecutive sell climax without a significant break, and channels often end with the third push. The tight channel meant that there was urgency, and the momentum increased on the way down. The move to bar 13 collapsed through the trend channel line, which is how many channels end.
So what about the strong bulls and bears? They see the climaxes and understand the excess. The strong bears already shorted higher and were not interested in shorting down here. They would short only a significant pullback, maybe near the top of the channel where they originally shorted. With no more strong or weak bears shorting and no more weak bulls exiting, the selling pressure disappeared. The strong bulls saw the collapse and stepped aside. They knew that the market was going lower, so there was no incentive for them to buy until they believed that the market was as low as it would go. They wanted to buy at the best price and that was at the bottom. The different institutions each had their own measures of value and excess, and when enough of them agreed that the market was a good value, there was enough strong buying for a rally. Also, the strong bears understood the excess and took profits. Their buying contributed to the rally. They would have considered shorting again if the market was able to get back to around the start of the channel, which is where they had shorted earlier and made a profit.
The bottom is always at a confluence of magnets. Here, it was just beyond a measured move down from the open of the bull spike at bar 1 to the close of the final bar of the bull spike five bars later. It was also a trend channel line overshoot from a trend channel line drawn across the two swing lows of yesterday (not shown), and the bar 13 two-bar reversal up was also the signal for a large, two-day expanding triangle bottom. Bar 13 also overshot three smaller trend channel lines created by the channel down from bar 7.
FIGURE 4.5 Opposite Trend Bars Create a Climactic Reversal
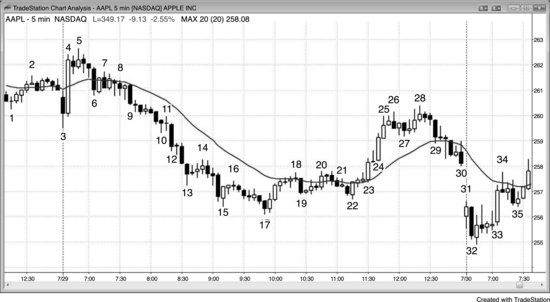
A trend bar in one direction followed by another in the opposite direction is a climactic reversal, and the channel that follows can be in either direction since there are spikes in both directions. In Figure 4.5, AAPL had several climaxes and reversals on this 5 minute chart.
Bar 3 was a large bear trend bar and therefore a spike, a breakout, and a climax. It was immediately followed by an even larger trend bar in the opposite direction, which was a buy climax. It was tempting to assume that this represented even stronger conviction, but you needed to be patient and let the market show you where it was going. Your job is to follow the institutions and not guess what they might do.
The rally to bar 5 was a higher high breakout pullback from the bar 3 bear breakout, and a pause after the bar 4 bull breakout. Bar 6 was another bear spike and therefore another sell climax. The tight trading range after bar 6 was a pullback from the bar 4 bull breakout, and a possible start of the bear channel following the bar 3 breakout and bar 6 bear spike. During the tight trading range that followed bar 6, the bulls were buying in an attempt to create a bull channel, and the bears were shorting as they tried to create a bear channel. The bears ultimately won. Even though the bar 4 buy climax was a larger and stronger trend bar than were the bar 3 and bar 6 bear spikes, the bears were able to overcome the bulls.
Bar 15 was a bull reversal bar and since it had a fairly large range and a big body, it was a buy climax. It immediately followed a large bear bar, which was a sell climax. Since the channel down had been so steep, it was more likely that the first attempt to break out would fail. Whenever there is a small entry bar in a reversal in a strong trend, the odds favor it becoming just a with-trend flag. Here, the two bars after the bar 15 reversal were small, showing the weakness of the bulls, and they formed a bear flag.
All two-bar reversals are opposite climaxes, albeit usually small. Bar 17 was a small bear climax followed immediately by a bull trend bar, setting up a two-bar reversal. The spike down was the sell climax, and the spike up was the bull breakout. The spike up lasted for three bars. Bar 19 was a bear spike, which was a sell climax and a breakout of the bear flag, which was also a pullback to the moving average. It was reversed by the bar 10 buy climax.
The bull spike from bar 23 to bar 25 or consisting of just bars 24 and 25 was reversed by the smaller bar 29 bear trend bar. That sell climax was followed by a couple of dojis and then a sell-off into the close. The bear channel ended on the next day.
Bar 31 was a buy climax followed by the bar 32 sell climax, which was reversed on the next bar. Bar 33 was another large bull trend bar, and therefore a buy climax, and it broke out above the opening range. It was followed by a four-bar pullback, which contained a bear breakout bar, and then the rally resumed in the form of a bull channel.
The rally to bar 18 broke above the bear channel from bar 5 to bar 17, but stalled at the moving average. The market turned down from the double top at bar 20, but found buyers at the bar 22 low, where the market formed a double bottom bull flag. Was that double bottom higher low a good setup for a major trend reversal? It was not ideal since, although the two-legged rally above the bear trend line to bar 20 had many bull bars, it could not hold above the moving average and was therefore not strong. The two-legged rally from the bar 22 double bottom to bar 28 was surprisingly strong, but many traders saw it as the first rally in a bear trend and therefore possibly just a bear rally instead of a new bull trend. It was strong enough, however, to make traders look to buy a test of the bear low. Traders bought above the bull bar that followed the bar 32 sell-off on the open of the next day, and again above the second bull signal bar that formed two bars later. It created a second signal (a micro double bottom with the bull bar after bar 32), and was therefore more reliable. The result was a major trend reversal from the lower low after the strong bear trend line break (the rally to bar 28). Because it unfolded over so many bars, the pattern was probably easier to see on a higher time frame chart.
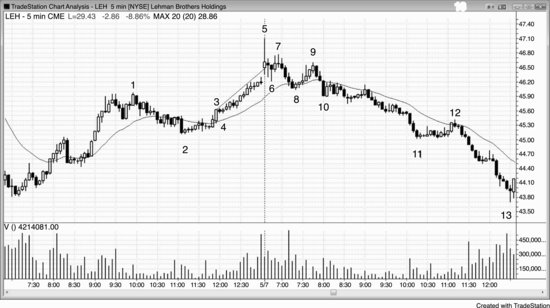
FIGURE 4.6 V Tops and Bottoms Are Rare
V bottoms and inverted V tops that reverse the market without first having a significant pullback are rare. Most spikes fail to immediately reverse the market, and instead the end of the spike usually gets tested. In Figure 4.6, the bar 3 wedge bottom led to a rally to the moving average. This was a potential V bottom, but the sell-off to the bar 5 higher low tested the bottom of the spike. Most reversals that are called inverted V tops or V bottoms are actually some other type of bottom, like a final flag reversal or a micro double top or bottom. For example, the reversal up from the bar 3 low was a wedge bottom, and a final flag reversal, based on the two-bar bear flag that followed bar 2. The bar 19 bottom was a micro double bottom, because the bar before bar 19 traded down and then up into its close. Bar 19 traded down again and the bar after it traded up, creating a micro double bottom. The double bottom could easily be seen on the 1 minute chart (not shown) and is easily inferred based on this 5 minute chart.
Bar 20 was the top of a protracted rally off of the bar 19 bear spike and an attempt at a V bottom, but the bar 19 spike low was tested at the close of the day.
The move up to bar 4 was a strong break above the bear trend line, and that made bulls look to buy either a lower low or a higher low test of the bear 3 low. The bulls wanted to see a strong break above the trend line and not just a drift that broke above the trend line by going sideways.
Traders expected that the three consecutive sell climaxes down to bar 3 would be followed by a large correction with at least two legs sideways to up and lasting at least 10 bars. The final climax often has the largest bear trend bar of the entire move, as it did here two bars before bar 3. Strong bears would look to sell only after a significant pullback, whereas strong bulls bought aggressively, and they would have bought more if the market went lower. There was no group of strong traders willing to sell at the bar 3 low after the third sell climax in the tight channel down from the high of the day. Strong bears were buying back their shorts, and strong bulls were aggressively buying new longs.
The two-legged rally to bar 6 broke well above the bull trend line, alerting traders that the next push down could test the bar 3 bear low and then reverse up. Bar 7 was a double bottom major trend reversal. Some traders saw the first bottom as the bar 3 low, whereas others saw the pattern as a double bottom bull flag with the bar 5 low.
Since most reversal attempts fail, including climactic reversals, many traders fade the reversals, expecting the trend to resume at least enough for a trade. For example, as strong as the rally to bar 4 was, many bears saw it as simply a pullback to the moving average and a double top with the pullback from bar 1. They shorted what they saw was a great opportunity to sell at a brief high price, and took profits on bar 5, as evidenced by the tail at its bottom and the small bull body.
FIGURE 4.7 V Bottoms Are Rare but Strong
A V bottom or an inverted V top without any significant test of the spike occurs only a few times a month on 5 minute charts. Figure 4.7 shows a 5 minute V bottom, which is a sell climax and a climactic reversal. The sell-off on the open down to bar 9 was a parabolic move, which is a type of sell climax. You can see how the slope of the three trend channel lines became increasingly steep (from bar 2 to bar 3, bar 5 to bar 8, and bar 8 to bar 9), which indicated panic. Traders wanted to sell at any price. The bears pressed their shorts, quickly adding to their positions as the market fell in the strong bear spike. However, when there are consecutive sell climaxes, the market soon runs out of traders who are eager or even willing to short without a significant pullback. This lack of selling creates a buy imbalance, and it is usually followed by a rally that lasts at least 10 bars and has at least two legs.
Whenever there is a sell climax or a pair of consecutive sell climaxes as there was here (the bear spikes that ended at bars 8 and 9) and the increased selling comes after the market has already fallen for 10 or more bars, there is a good chance that there will be a strong reversal. The strong bulls stepped aside because they expected the market to trade down to some confluence of magnets; once it got there, they appeared out of nowhere and bought aggressively. The strong bears understood what was going on and they quickly took profits on their shorts once they saw the exceptionally large bar 9 sell climax bar, and were unwilling to consider shorting again until the market was much higher. The strong bulls and bears were both buying at the close of bar 9 and on the two-bar micro double bottom that followed, and the market could only go up.
When there is a strong spike in a market that appears to be falling too far, too fast, there is a possibility that the sell-off is a sell vacuum down to test a support level, and many traders will watch for a sign of a climactic reversal. There was a strong bear spike down to bar 8 and then a one-bar low 1 sell signal. Experienced bulls and bears were aware that if there was a particularly large bear trend bar within a bar or two, it could have been an exhaustive end to the selling. That low 1 signal bar could have been a one-bar final flag (discussed in Chapter 7). When bar 9 closed and was an especially large bear trend bar, it was a consecutive sell climax and could have led to a final flag reversal and a rally that could reach 10 or more bars and have two or more legs. Many bears buy back their shorts in such a scenario because they are aware that the market might rally sharply. If there is a reasonable sell signal after about 10 bars, they will look to short again. In this case, the market rallied strongly and the bears saw no sign that it would sell off, so they never saw a sensible setup to short.
Aggressive bulls also thought that the market was likely to rally and they, too, bought. Some of the bulls and bears bought on the close of bar 9, risking about the height of bar 9; some chose to risk less, like maybe a couple of points. Other bulls and bears bought during and on the close of the next bar, since it was a small bar and therefore a sign that the selling was abating. Others waited until bar 10 had a strong bull close and bought on the close or above its highs. Finally, the remaining bears bought back their shorts, and the cautious bulls, who wanted to be certain that the market had flipped to always-in long, bought during the five-bar bull spike off the low and during the rally that followed. Many bulls pressed their longs, adding to their positions during the fast, strong bull spike up from the bar 10 low.
When the market is moving quickly and experienced traders’ positions have immediate profits that are growing fast, they will often buy more as they try to maximize their profits during this brief, exceptional opportunity. This is the opposite of what they would do when the market is in a tight trading range, like it was during the first 20 bars on the left of the chart. When there is little movement, most traders step aside and are comfortable not trading until a trend begins. However, institutions and high-frequency trading firms continue to trade heavily all day long, including in tight trading ranges.
A perfect V bottom, where the market goes straight down and then up, is extremely rare. Most V bottoms have subtle price action that shows hesitation in the selling, as it did here, alerting traders to a possible reversal. The bar after bar 8 was a one-bar final flag, which alerted traders to a possible reversal up after another one- or two-bar sell climax. Bar 10 formed a micro double bottom with the bar before it, and a micro triple bottom with the bar before it and the low of bar 9. This was a micro three-push down pattern, and a likely triangle on a smaller time frame chart, and it gave the bulls a low risk, high probability entry after the consecutive sell climaxes and one-bar final flag.
Volume for most bars when the market was quiet yesterday was about 5,000 to 10,000 contracts per bar. Bar 9 had 114,000 contracts. This amount of volume was almost entirely institutional. Was it more likely due to shorting by the institutions because they finally decided that the market was going down after it had already gone down for many bars, or was it due to aggressive buying by the bulls and bears because they saw this consecutive sell climax as the end of the selling for the time being? Institutions are smart money, so whenever they all suddenly agree and trade extremely heavily in a protracted bear trend, the odds are very high that the trading is due to aggressive buying by both the bears (taking profits) and the bulls. If institutions are smart, profitable, and responsible for every tick, why would they ever sell the lowest tick in a bear trend? It is because that is what their algorithms have been doing profitably all of the way down, and some are designed to continue to do it until it is clear that the bear trend is no longer in effect. They lose on that final sell, but make enough on all of their earlier trades to offset that loss. Remember, all of their systems lose between 30 and 70 percent of the time, and this is one of those times. There are also HFT firms that will scalp for even a single tick right down to the low tick of a bear trend. The low is always at a support level, and many HFT firms will sell a tick or two above support to try to capture that final tick, if their systems show that this is a profitable strategy. Other institutions are selling as part of a hedge in another market (stocks, options, bonds, currencies, etc.) because they perceive that their risk/reward ratio is better by placing the hedge. The volume is not from small individual traders, because they are responsible for less than 5 percent of the volume at major turning points.
FIGURE 4.8 Spike Pullbacks Are More Common Than Spike Reversals
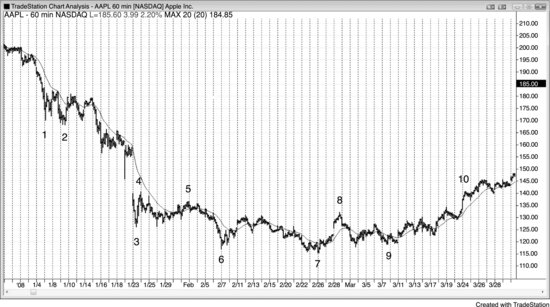
Spikes are tests of the strength of both the trend and countertrend traders. Up spikes in bull markets and down spikes in bear markets usually get tested, since spike reversals are much less common than simple temporary trend extremes, which usually get tested and exceeded. Down spikes in bull markets and up spikes in bear markets are pullbacks and may or may not get tested. They are already tests, testing the determination of the countertrend and the resolve of the with trend traders. The pullbacks often come close to flipping the always in position to the opposite direction, but there is inadequate follow-through. Strong traders love these reversal attempts, because they know that most will fail. Whenever the countertrend traders are able to create one, the with trend traders come in and heavily fight the reversal attempt, and usually win. They see these sharp countertrend moves as great opportunities to enter in the direction of the trend at a great price that is likely to exist only briefly, and quickly become simply a spike pullback in the trend. In Figure 4.8, the bar 1, bar 3, and bar 6 bear spikes in a bear market and the bar 4 and bar 8 bull spikes were all tested on this 60 minute AAPL chart.
Bar 4 was a bull spike in a bear trend and did not have to be tested, but it was tested about 10 bars later.
Bar 8 was a bull spike in a trading range and a break of a major trend line, so it was likely to be tested.
Bar 7 was a new swing low, but not a spike, so it did not have to be tested.
FIGURE 4.9 Spike Pullbacks Usually Don’t Get Tested
A spike pullback does not have to get tested since traders agree that the trend is resuming and they are eager to get on board, but a spike reversal usually gets tested because it is countertrend and traders are less willing to believe that a reversal will succeed.
Most of the bear spikes in bull trends are caused by profit-taking bulls who are looking to buy again lower, and by aggressive bears who are only looking for a short scalp. When the market makes its sharp move down, like at bar 3, bulls buy aggressively to initiate long positions or to add to their longs, and the bears buy back their profitable scalps. Once the bears are able to get follow-through selling, as they did in the move down to bar 7, they expect that the market is becoming two-sided enough to be transitioning into a trading range or even a major trend reversal. Rather than scalping shorts at the next rally, they will begin to hold some or all of their position for a swing down. The bulls will also expect a deeper selloff and will only buy much lower, and only if there is a clear buy signal. With both sides unwilling to buy until the market falls further than on past pullbacks, the chance of a deeper pullback, a trading range, or even a major trend reversal increase.
Bar 3 in Figure 4.9 was a bear spike in a strong bull trend and was unlikely to be tested. It was simply the first moving average gap bar and it trapped bears. As strong as the selling was, there was not enough follow-through selling to convince traders that the market had reversed into an always-in short direction. The bears who shorted during the spike realized this, quickly bought back their shorts, stepped aside, and waited for another possible opportunity to reverse the market. The bulls bought aggressively, since they realized that the bears had failed and that this markdown was a brief opportunity to buy at a great price. They look forward to bear spikes because they know that most reversal attempts fail and therefore become great buy setups. With no one left willing to sell, the market went up sharply for many bars.
Bar 6 was a bear spike that followed a wedge top, making it likely to be tested since at least two legs down were expected.
Bar 7 was a bear spike in a bear leg and was tested with a higher low that led to a trend resumption of the higher time frame bull trend, based on the wedge bull flag of bars 4, 6, and 7.
Bar 11 was a strong spike down and a possible first leg down of a new bear trend, since it followed the bar 10 higher high. At this point, it was unlikely to be a pullback in a bull trend and therefore was likely to get tested. The market was likely to have at least two legs down after the strong bull trend line break (in the move down to bar 7) and then the higher high.
Bar 13 was the bottom of a two-legged pullback in a large bull trend. This could have led to a new bull high, since it was above the bar 7 low and the market was therefore still making higher lows and highs and might still have been in a bull trend. With the momentum down so strong, it was better to wait for a rally from here and then a higher low before going long. The market broke to the downside with a large gap.
Bars 14 and 15 were bull spikes in a strong bear trend and did not have to be tested.
Bar 17 was a bull spike in a bear trend and therefore did not have to be tested, and it could simply have been another lower high in the bear trend, which has a series of lower highs and lows. However, it followed a small wedge bottom (bar 15 was the pullback from the first push down), which was likely to have at least two legs up, so the move to bar 17 was the first of the two possible legs. Also, the bar 16 low was in the area of the bar 1 tight trading range, which was an area of support, and therefore a possible area where a trading range could reasonably be expected to form. This meant that there was a good chance for a second rally from the bar 18 double bottom. The rally to bar 17 broke the bear trend line (for the trend from bar 12 down to bar 16), making traders wonder if it was going to be followed by a test of the bear low and then either a trading range or a major trend reversal. It turned out to be the start of a large trading range that continued to the end of the chart.
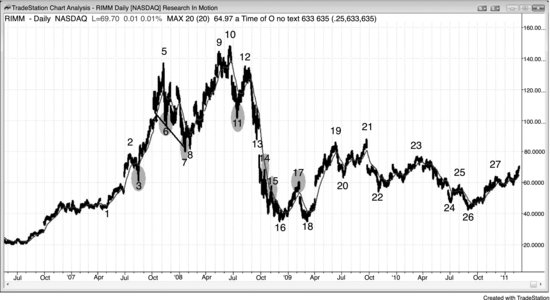
FIGURE 4.10 Test of a Bull Spike
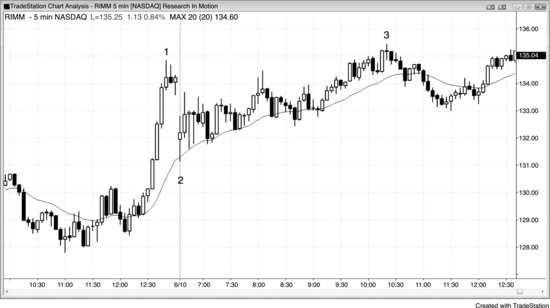
As shown in Figure 4.10, Research in Motion (RIMM) closed yesterday with a strong bull spike, so the odds were excellent that today was going to try to exceed it. Although today’s rally was sloppy and did not look particularly bullish, the bears still could not put two consecutive closes below the moving average. This chart was going up, but its strength was deceptive.
FIGURE 4.11 Inverted V Top
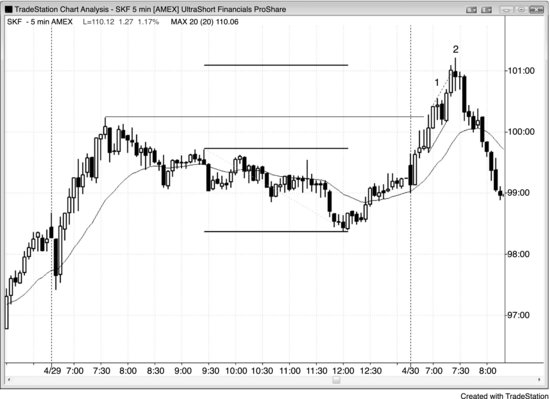
As shown in Figure 4.11, this bar 2 climactic opening reversal (inverted V top) in the ProShares UltraShort Financials ETF (SKF) was simply a reversal after breaking out of the top of a small bear trend channel line (dotted line). It was also a second entry after breaking above yesterday’s high, and the end of a leg 1 = leg 2 trend resumption that began at yesterday’s open. It was the third consecutive buy climax since the open without a significant pullback and a possible one-bar final flag reversal (the bear bar after bar 1 was the one-bar high 1 bull flag). On a higher time frame chart, yesterday’s sell-off broke below the bull trend line, and bar 2 was a reversal down from a higher high. It was a measured move up from yesterday’s trading range, but this alone is not reason enough to short a bull trend. When a strong trend reaches an area of a measured move, the bulls are taking profits, but bears will short only if there are other factors, like there were here.
Bar 2 was a micro double top with the bull trend bar before it. The market went up on the bull trend bar and then up again on the tail at the top of bar 2. It went down to the bottom of bar 2 and had a third push up to the high of the small doji bar that followed, creating a micro head and shoulders top or triangle, which was likely visible on a smaller time frame chart. The top was also a one-bar final flag reversal from the one-bar final flag that followed bar 1. The bodies of bar 2 and the doji that followed formed an ii with the body of the bull bar before bar 2.
FIGURE 4.12 Climactic Reversal with More Reasons to Reverse
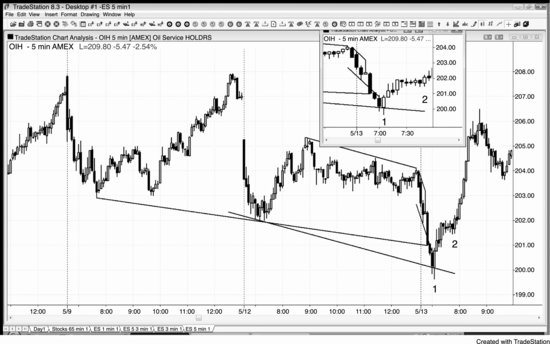
Climactic reversals are more reliable when other factors are involved. As shown in Figure 4.12, the 5 minute Oil Service HOLDRS (OIH) had a climactic opening reversal below yesterday’s low and it was also a reversal of three trend channel line overshoots. A trader should have bought above the large two-bar reversal at bar 1, and again at the high 2 first pullback at bar 2, expecting at least two legs up. Always swing part when two legs are likely, because sometimes there will be a new trend rather than just a two-legged pullback.
Bar 1 was a two-bar reversal bottom. The bar before bar 1 was a large bear trend bar, larger than the bear bar before it and with a close well below it. This means that it was a breakout below that bar, and that the smaller bear trend bar was a variant of a one-bar final flag. It was probably a small final flag on a smaller time frame chart.
FIGURE 4.13 Don’t Buy Tests of a Bear Trend Channel Line
Countertrend traders are always drawing trend channel lines, hoping for an overshoot and a reversal that will allow for at least a scalp and preferably a two-legged countertrend move. When a channel is steep, it is a losing strategy to buy every reversal from a trend channel line overshoot. Instead wait until there is a strong breakout of the channel, like the big gap up to bar 5 in Figure 4.13, and then look to buy the breakout pullback, like the bar 8 second attempt to reverse yesterday’s low.
Bar 2 broke a small trend channel line, but there was no earlier countertrend strength and the setup bar had only a small bull body. Smart traders would have waited for a second entry, especially a higher low, and if one did not develop, they would have viewed this as a with-trend setup, which it turned out to be. Notice how the breakout below bar 2 was in the form of a strong bear trend bar. This is because there were many longs who entered early on this small wedge, and most would not concede that the reversal had failed until there was a move below the bar 2 low of the wedge. That is where their protective stops were. Also, many bears had entry stops there as well because a failed wedge usually runs about the height of the wedge as a minimum, creating a great short entry for the measured move down. When a bear channel is steep like this, smart bears will have limit orders to short at or above the high of the prior bar, exactly where overly eager bulls are buying.
Bar 3 overshot another trend channel line, but there was no entry signal so there were very few trapped bulls.
Bar 5 opened well above the bear channel, but it was a 20 gap bar short and essentially a first moving average gap bar (close enough—its body was large and entirely above the exponential moving average), creating a trend from open move down.
Bar 6 did not reach the trend channel line, so although it tried to reverse yesterday’s low, the reversal attempt was suspect. Most traders would have waited for the overshoot, and in its absence would have wanted at least a second entry. Also, the signal bar was a doji with only a tiny body, which meant that the bulls were not strong.
Bar 8 overshot the bear trend channel line, and the signal bar was an inside bar with a good-sized bull body. This setup was also a second attempt to reverse yesterday’s low, creating a dependable opening reversal setup for a possible low of the day. It was a reversal up from the bar 7 final flag and a lower low breakout pullback from the bar 5 break above the bear channel. Remember, a bear channel is a bull flag. Some traders reasonably saw it as a major trend reversal after the rally to bar 5 broke well above the bear trend line and the moving average. Finally, it was a consecutive sell climax and its body was the largest bear body of the sell-off, which is common at the end of consecutive sell climaxes.
FIGURE 4.14 Increased Slope Usually Means Climactic Emotion
Once the slope increases, the trend is accelerating and probably about to correct. This is because the increased slope indicates increased emotion, and once the emotional traders have exited, there is neither anyone left to exit nor anyone willing to enter the trend until there is a pullback. The move up from bar 8 in Figure 4.15 was steeper than the bull trend before it, and the entire bull trend ended with the gap up bear reversal at bar 10.
The move down from bar 13 was steeper than the bear channel before it, and this sell climax was reversed up at the bar 15 strong bull trend bar, which formed a double bottom with the bar 4 start of the bull spike up to bar 10. These two days had a huge spike up and then a huge spike down and formed a large buy climax. A climax is usually followed by a trading range, as it was here in the two-legged rally to bar 20.
The large bear trend bar before bar 14 was seen at the time as either a breakout that could lead to a measured move down, or an exhaustive sell climax that might lead to a reversal up, lasting about 10 bars and two legs. Since it followed such a steep series of bear bars without a correction, it was likely the end of unsustainable and therefore climactic behavior. Many traders wait to begin buying until they see a large bear trend bar like this. Some buy on the close of the bar, but with the low of yesterday so close, many traders waited to see if the market might fall a little further. Those traders bought as bar 15 was forming, on its close, and above its high. This was a successful sell vacuum test of yesterday’s low (a double bottom major trend reversal) and the buyers took control over the market. They expected the bear breakout to fail, and bar 15 was the buy signal bar for the failed breakout. The bears who swung their shorts down to bar 15 bought them back to take profits, and they would not have done so if they were planning to short again just a few ticks and a couple of bars higher. If they thought that the pullback was going to be brief, they would have held short. The strong bull reversal bar and entry bar were evidence that the reversal was strong and that the sellers were stepping aside for about ten bars. This made the market one-sided and led to a big rally. The bears were looking for a reasonable setup to put their shorts back on, and did not get one until bar 20. The bulls understood that the bears were likely to come in, so they sold out of their longs to take profits, and planned to wait for about 10 bars before considering buying again. They bought seven bars later at the bar 22 low, which reversed up in a double bottom with the bar 17 low. It was a higher low major trend reversal (the rally to bar 20 broke above the bear trend down to bar 15) and a triangle (bars 4 and 15 were the first two pushes down).
FIGURE 4.15 Reversals Need Momentum
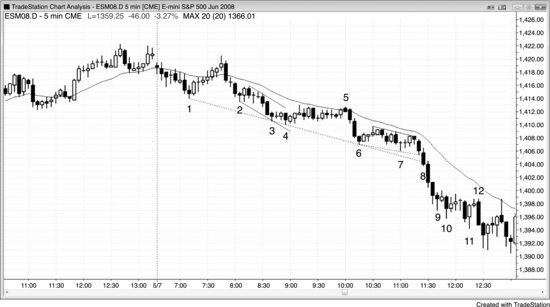
When a climax pattern fails to form any countertrend momentum, assume that you read the market wrong and are looking to trade in the wrong direction. Wedge reversals are not the same as wedge pullbacks, even though they can look the same. You need to pay attention to the context. If there is a wedge-shaped pullback in a bull trend, you can buy the first signal since you are buying in a bull trend. Unfortunately, when the market is in a bear trend, overly eager bulls treat all wedge bottoms as pullbacks, but most are reversals. When a wedge is a reversal, it is a countertrend trade and you should wait for a higher low before buying, and only after there has been a strong break of a trend line. Trying to scalp longs in a strong bear trend is a losing strategy.
As shown in Figure 4.15, bar 4 completed a three-push down move from bars 2 and 3, and also bounced off a bear trend channel line from bars 1 and 3. However, the market went sideways rather than up. The bulls were not strong so what appeared to be excess bearishness was not an excess at all. Whenever there is a strong bear trend, it is always better to only look for shorts until after there is a higher low, and even if you then buy, you need to be ready to short if the bear trend sets up a low 2.
Bar 8 was a bull reversal bar until the final seconds before it closed, and it quickly sold off into a bear trend bar. What overly eager bulls thought was going to be a bull reversal bar at the bottom of a wedge and two bear trend channel lines turned into a bear breakout of the bear trend channel lines, which meant that everyone now agreed that there was much more to go. This was confirmed by the series of bear trend bars that followed the wedge reversal failure. If you watched the market action, you would have seen the bull reversal bar collapse into a bear trend bar and you then would have shorted it, knowing that there were trapped early-entry longs who had bought what they thought was going to be a strong bull reversal bar off a bear trend channel line (don’t front-run the bars; always wait for them to close and the next bar to confirm the reversal). Even without knowing this, shorting one tick below the low of that bear trend channel line breakout is still a smart trade.
Bar 11 was another three-push down pattern, but with all of those dojis and large, overlapping bars, a second signal was needed for any long, and traders should have been looking for a small bar near the high of the barbwire to short (like bar 12, which clearly trapped longs on the breakout from the bull reversal bar entry one bar earlier). Bar 11 was a bad bull reversal bar because there was no prior significant bull strength in the form of a break above the bear trend line, and it had too much overlap with the prior bars, forcing you to be buying near the high of a bear trading range (remember, buy low, sell high!). This had been a very strong bear trend day, and the best traders would not have been looking for wedges. Instead, they would have been looking to short near the moving average. Since there were so few, the bears were very strong and smart shorts would have been selling every failed buy signal as well as low 1 and low 2 entries.
There were consecutive sell climaxes down to bars 2, 3, 6, and 9 and down from bar 12. The move down was not in a tight channel, and each excess was worked off by the market going sideways for about 10 bars. This created a series of trending trading ranges, which is common in strong trends, and it prevented an exhaustive climactic reversal.
FIGURE 4.16 Too Many Trend Channel Lines
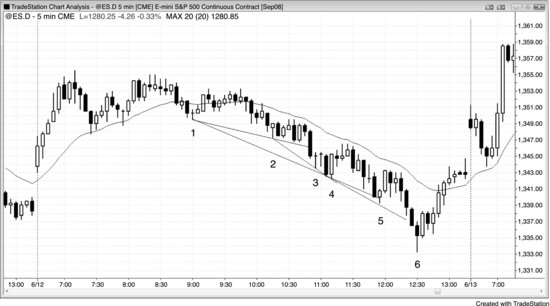
Whenever you find yourself drawing multiple trend channel lines, you are invariably blinded to what is in front of you by your anxiety over what you can’t believe is happening (see Figure 4.16). Even though the trend is in a bear channel and channels have a lot of two-sided trading, they can last much longer than what seems possible. Always assume that any channel will last forever, and once it finally does not, then change your mind. The two-sided trading gives the appearance that it will soon reverse, but most reversal attempts of anything fail. The trend is strong and you are missing all of the with-trend shorts because all you are seeing are trend channel lines and potential reversals in what you believe is an overdone sell-off in a trading range day (channels in spike and channel patterns always look that way). Be patient and trade only with the trend until there is a reversal that is so clear and strong that you don’t need to draw the line to see the excess, like the large bar 6 that reversed yesterday’s low and was a three-push down pattern (bars 4, 5, and 6). Don’t trade what you believe should be happening. Only trade what is happening, even if it seems impossible. As discussed in Chapter 15 on channels in the first book, when the market is in a bear channel, smart traders are buying only below bars and not above; they are much more interested in shorting, and look to short above prior bars, not below.
FIGURE 4.17 Volume at Reversals Is Not Particularly Helpful
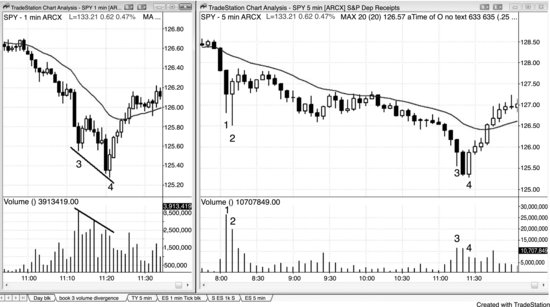
As shown in the right-hand chart in Figure 4.17, the 5 minute SPY had an exhaustive sell climax at bar 3 and a two-bar reversal at bar 4 that was followed by a strong rally above the moving average.
The chart on the left is a 1 minute chart showing a volume divergence at the low, which is common. The volume at the bar 4 low was less than the volume at the earlier bar 3 low, even though bar 4 was at a lower price. There probably was a tick divergence and divergences on many oscillators as well, but experienced traders do not have to look at anything beyond the 5 minute chart to know that.
Traditional technical analysis teaches that the volume on the bull reversal should be greater than on the final bear bar. Here, on the 5 minute chart, the volume on the bar 4 bull reversal bar was less than that of the two prior bear trend bars. Does that make the reversal less reliable? Not at all. However, it might have been enough to make a trader not buy the bottom. I don’t want the distraction and do not look at volume or any indicators when I am trading, because the chart tells me all that I need to know. Incidentally, bar 2 had much larger volume than the bar 4 low, but resulted in a failed reversal that ended with a double top bear flag.
The big tail on the bottom of bar 3 was a sign that buyers were coming in; the market usually only falls for another bar or two before trying to correct. Bar 4 was a strong two-bar reversal and a micro double bottom with the bar 3 low. Bar 3 was a type of final flag, and was probably a final flag on a smaller time frame chart.