CHAPTER 6
Expanding Triangles
An expanding triangle can be either a reversal or a continuation pattern and is made of at least five swings (sometimes seven, and rarely nine), each one greater than the prior one. Part of its strength comes from its trapping traders on each new breakout. Since it is a triangle, it is a trading range, and most breakout attempts in a trading range fail. This tendency results in the expanding triangle. In a bullish reversal (an expanding triangle bottom), it has enough strength to rally above the last higher high, trapping longs in; it then collapses to a third low, trapping longs out and bears in on the lower low, and then reverses up, forcing both sides to chase the market up. The new low is the third push down and can be thought of as a type of three-push pattern, and it can also be thought of as a breakout pullback—the market broke above the last swing high and then pulled back to a lower low. In a bear reversal (an expanding triangle top), it does the opposite. Bears are trapped in by a lower low then are forced out, and bulls get trapped in by a higher high, and both then have to chase the market as it reverses down for the final time. The initial target is a breakout beyond the opposite side of the triangle, where the market often tries to reverse again. If it succeeds, then the reversal fails, and the pattern becomes a continuation pattern in the original trend.
For example, if there is an expanding triangle top (a reversal pattern) in a bull trend, the first objective is a breakout below the pattern; in most cases, that is as far as the trade goes. If the breakout succeeds, the next objective in the reversal down is a measured move that is approximately the same height as the last leg up in the triangle. If the breakout fails and the market reverses up, then the triangle becomes a continuation pattern, which in this case would be an expanding triangle bull flag, since it is a triangle in a bull trend. The initial target would be a new high, and usually that is about as far as the trade goes. If the breakout succeeds, the next target is a measured move up that is about the size of the last leg down in the triangle. If the breakout fails and the market turns down, it is now a larger expanding triangle top with seven legs instead of the original five. At some point, either a breakout succeeds and the market makes an approximate measured move or the triangle evolves into a larger trading range.
The term triangle is misleading, because the pattern often does not look anything like a triangle. The salient point is that it is a series of progressively greater higher highs and lower lows that continue to trap breakout traders, and at some point they capitulate and then all of the traders are on the same side, creating a trend. It has three pushes and can be viewed as a variation of a three-push reversal pattern, but with deep pullbacks. For example, in a bull reversal at the bottom of a bear trend, both pullbacks form higher highs; however, in a conventional three-push pattern like a wedge bottom (a contracting triangle that is pointing down), both pullbacks would form lower highs (i.e., not an expanding pattern).
All expanding triangles are variants of major trend reversals, because the final reversal always follows a strong leg. For example, in an expanding triangle bottom, the rally from the final low follows a rally that was strong enough to go above a prior swing high, and that rally always breaks some significant bear trend line. At a minimum, the rally from the second push down breaks above the bear trend line that contained that second leg down, and the third push down is therefore a lower low major trend reversal buy setup. The rally to the first or second leg usually also breaks above some other major bear trend line.
FIGURE 6.1 Expanding Triangle Bottom in the Emini
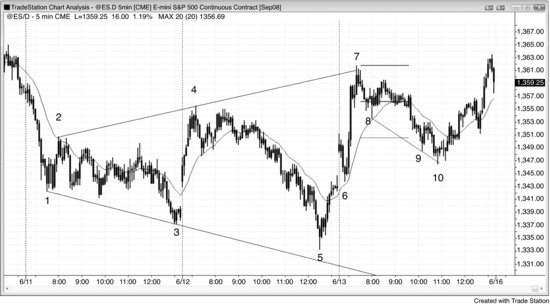
An expanding triangle bottom in a bear trend often later tries to become an expanding triangle bear flag. In Figure 6.1, the Emini ran up off an opening reversal from the bar 6 gap pullback test of the moving average and yesterday’s close. Yesterday’s low at bar 5 formed an expanding triangle bottom with bars 1, 2, 3, and 4. This was a reversal pattern, since the trend was down prior to the triangle. The first objective was a new swing high, which was reached at bar 7. Then the market usually tries to form an expanding triangle bear flag, which is a continuation pattern since it is a trading range in a bear trend. It did that at the bar 7 overshoot of the bull trend channel line (the triangle was formed by bars 2, 3, 4, 5, and 7). After a trend channel line fails breakout, especially when there is an expanding triangle, there is usually a two-legged move down. Incidentally, expanding triangles don’t have to have a perfect shape and they do not have to touch the trend channel lines (bar 5 fell short).
The rally up to bar 7 was very strong, but the low 2 short at the top of the trading range was worth taking under these circumstances. Bar 8 was the second doji in a row, and dojis represent equilibrium between bears and bulls. Since they are in balance, that balance point is often the midpoint of the move down, and is a rough guide for how much further down the market might go in its search for enough buying power to swing the market back up. The target was hit at bar 9, but the market did not rally until after overshooting the bear trend channel line and reversing up at the bar 10 wedge bull flag signal bar. Bar 10 also tested the original long entry above the bar 6 signal bar to the exact tick (a perfect breakout test).
FIGURE 6.2 Expanding Triangle Bottom Reversal
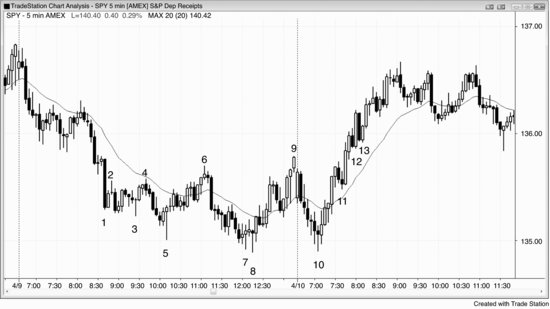
In an expanding triangle reversal pattern, the lows keep getting lower and the highs keep getting higher. Typically, there are five turns before the reversal, but sometimes there are seven, like in the 5 minute SPY chart presented in Figure 6.2. There are usually valid reasons to scalp each leg (for example, each leg is a new swing high or low in a trading range), but once the fifth leg is complete, a larger trend can develop and it is wise to swing part of the position. Also, once the pattern completes, it usually sets up an expanding triangle pattern in the opposite direction. If the first was a reversal pattern, then the next part of this pattern (which will be in the opposite direction), if it develops, will be a continuation pattern and vice versa.
Bar 5 was the fifth leg (bar 1 was the first) and therefore a buy setup for at least two legs up. However, bar 6 was a failed breakout short setup and a small wedge (it was the third of three small pushes in the channel after the spike up from bar 5). This created an expanding triangle bear flag, where the first of the five swings was bar 2.
The seventh leg had a second entry at bar 8. Bar 7 was the first setup at a new low, but it failed, as was expected since the entry was in a barbwire pattern and most traders would have waited for a second signal. Bar 8 was also a high 3 buy setup in the small bear channel after the spike down from bar 6, and the third push down often signals the end of a spike and channel bear trend pattern.
Bar 10 tested the bar 8 low, but its low was one tick higher. It was similar to a ninth leg of an expanding triangle (in trading, similar is usually good enough). As a double bottom test of yesterday’s low and a high 2 buy setup at the bottom of a trading range, it was a good opening reversal buy setup.
Bar 11 was a breakout pullback from taking out the high of the open, even though it did not break above the bar 9 high of the triangle. It was a high 1 long after a strong five-bar bull spike in a possible new bull trend and therefore a reliable buy setup.
Bar 12 was a low 2 at the top of a trading range (an expanding triangle is a trading range) and a one-tick bear breakout failure on this SPY chart. The Emini chart, however (not shown), held above the reversal bar’s low and did not trigger the pattern. The Emini gives fewer false signals because each tick is equivalent to 2.5 ticks in the SPY. Since the up momentum was strong enough so that a bull trend might be underway, traders should have waited to see if a lower high formed before considering taking shorts.
Bar 13 was a second entry for the breakout failure short above bar 9, but again there was no trend line break earlier in the rally, so it would have been unwise to short in the absence of some earlier bear strength. Bears should have waited for a lower high before shorting.
Instead of breakout failures, bars 12 and 13 were breakout pullbacks in a new bull trend.
FIGURE 6.3 Second Entry in Expanding Triangle Reversal
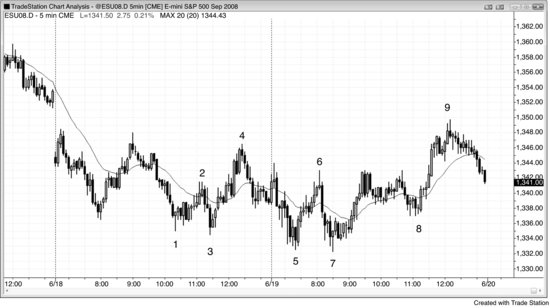
As shown in Figure 6.3, bars 1 to 5 created the five legs of the expanding triangle bottom. The entry was one tick above the bar 5 lower low. Bar 6 failed to take out the high of bar 4 before dropping to a new low. Bar 7 was a second-chance entry at the expanding triangle, but with this many bars between bars 5 and 7, the triangle had lost its influence and this had become just a double bottom reversal from a new low on the day.
Bar 8 formed a higher low that was also a double bottom pullback long from the bars 5 and 7 double bottom.
After reaching the target of a new swing high, bar 9 set up an expanding triangle bear flag (bars 2, 3, 4, 7, and 9), and this short had a target of below the bar 7 low. Eventually, however, one of these increasing larger triangles fails and a trend begins. Incidentally, the market gapped below bar 7 on the open of the next day, reaching the target. The proportionality was bad since the spacing between bars 4 and 9 was so much greater than between bars 2 and 4. When the shape is that unconventional, fewer traders will trust it and that weakens the pattern. However, traders still saw bar 9 as the top of a bear trading range, a double top bear flag with yesterday’s high, and a test of the gap above yesterday’s high, and those are reasons enough to go short.