CHAPTER 8
Double Top and Bottom Pullbacks
If a market forms a double bottom after a sell-off, and before the bull trend takes off, and it then has a higher low pullback that tests just above the double bottom low, this is a double bottom pullback long setup. The double bottom does not have to be exact, and the second bottom is often slightly lower than the first, making the pattern sometimes also a head and shoulders bottom. If the second bottom does not at least reach the first, there is a risk that the bottom is forming only a two-legged sideways to up correction, thereby making it better to look for a scalp long rather than a swing. A double bottom (or top) pullback pattern can be thought of as a three-push bottom (or a triple bottom or triangle) where the third push down did not have strong-enough sellers to create a new low. The pattern always forms at a support level, as does every move up in a bear trend. If the move up from the first of the three bottoms is strong enough, traders will wonder if the trend is evolving into a trading range or even a reversal into a bull trend. In a trading range, every move down is a bull flag and every move up is a bear flag. If the market is in the early stages of a bull trend, then every move down is also a bull flag. Whether the market is entering a trading range or a new bull trend, the sell-off from the first rally is a bull flag, even though it falls to around the level of the first bottom. The rally off the double bottom is a breakout of the bull flag. The pullback (which is the third move down) from the move up off the double bottom is also a bull flag, whether it ends above the double bottom and forms a double bottom pullback (or a triangle), it ends at the level of the double bottom and forms a triple bottom, or it falls below the double bottom and reverses up and forms a failed breakout below a double bottom (basically, a type of final flag reversal). It is also a pullback from that second bull flag, so the rally off the third push down is a breakout pullback from the breakout above the second bull flag. It does not matter where the third push down ends, and it also does not matter if the overall pattern looks like a triple bottom, a triangle, a head and shoulders bottom, a final flag, or a double bottom pullback, because the significance is the same. The third reversal up creates a three-push down reversal pattern, and traders need to be looking for opportunities to get long. When the market forms a double bottom pullback and the shape is good and the bull reversal bars for the three bottoms are strong, especially if the final one is strong, the pattern is one of the most reliable buy setups.
The move up from the second bottom is usually a breakout, even though it may last for only a couple of bars. The pullback is therefore a breakout pullback, which is one of the most reliable setups. It can also be thought of as two failed attempts to exceed the prior extreme (often a low 2), and two failed attempts usually lead to a reversal. Some technicians say that triple bottoms and tops always fail and always become continuation patterns, but they require that the three extremes be identical to the tick. With that strict definition, the pattern is so rare that it is not worth mentioning. Also, it is simply arrogant to tell the market that you will not allow it to do something, and arrogance always costs you money because it is the market and not you that gets to say what can and will happen. Traders will make much more money by using loose definitions. When something resembles a reliable pattern, it will likely trade like the reliable pattern.
This is a reversal pattern and not a continuation pattern, like the double bottom bull flag. Both are long entry setups, but one is the beginning of the trend (a reversal pattern) and the other takes place in an established trend (a continuation pattern), or at least after there has been one strong leg.
Likewise, if there is a double top in a bull trend and there is then a pullback that reaches close to the high, this double top pullback is a good short setup. Again, it does not matter what shape the three-push top takes because the significance is the same. If the signal bar is strong and there is good selling pressure, it is a sell setup, whether it looks like a triple top, a triangle, a head and shoulders top, a final flag, or a double top pullback.
Sometimes there will be both a double top and a double bottom in the same trading range. The result is usually a triangle, which means that the market is in breakout mode. The market tends to move back to the middle of the range and then test either the top or the bottom, and that third push establishes the triangle. If the range is big enough, traders can scalp shorts as the market reverses down and longs as it reverses up. If the setup is good, the probability of success is about 60 percent for a reward that is at least as large as the risk. If the trading range is too tight, traders can choose to either swing a long or short, or wait for the breakout. If the breakout is strong, trade in its direction, because the probability of a reward that is at least as large as the risk is often 70 percent or more. If it fails, trade in the opposite direction.
FIGURE 8.1 Double Bottom Pullback in the Monthly SPY
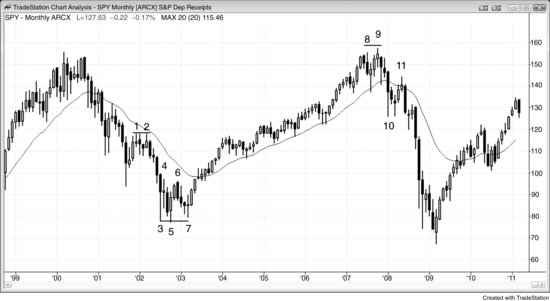
As shown in Figure 8.1, the monthly SPY had a double bottom pullback buy at the bar 7 outside bar as it went one tick above the high of the prior bar. Outside up bars can be reliable entry bars if the bar before was a decent signal bar, as was the case here. Other traders would have bought above the high of the outside up bar, at the close of the bull trend bar that followed bar 7, above the high of that bull trend bar, and at the close of the next bull trend bar, which confirmed the new trend for many traders. Buying above the high of a strong bull trend bar at the start of a move up is a reliable trade, as can be seen by the strong bull trend bar that followed.
Bar 5 was slightly below bar 3, but this is common and actually preferable in double bottom pullback buy patterns. Bar 6 was the breakout from the double bottom, and bar 7 was the pullback that successfully tested the resolve of the breakout traders. Many traders see these as triangles. A breakout pullback is one of the most reliable setups. Breakout pullbacks often are head and shoulders patterns.
Bar 11 was a pullback from the bars 8 and 9 double top. Some traders saw it as a lower high major trend reversal, a low 2 at the moving average, or a pullback from the breakout below the double top.
Bars 1 and 2 formed a double top bear flag (a continuation pattern and not a double top, which is a reversal pattern at the end of a bull trend). A double top in a bear trend is always a low 2 sell setup, because it is two pushes up. The bulls made two attempts to reverse the trend and failed, and will step aside for at least a couple of bars. This creates an absence of buyers and increases the speed and size of the move down, as the market races to a support level where it might find buyers again.
FIGURE 8.2 Bear Flag as a Double Bottom Pullback
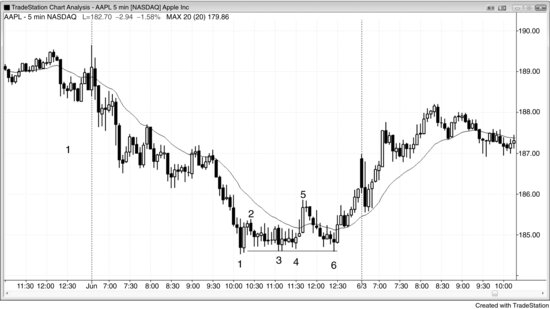
Sometimes a bear flag can be a double bottom pullback buy setup. In Figure 8.2, the two-bar reversal at bar 1 was at the end of a large second leg down on the day and therefore a possible reversal setup. However, a two-bar reversal is not enough reason to buy at the bottom of a tight bear channel. Although the move up to bar 2 was small and therefore weak, neither bar 3 nor bar 4 could take out the low and therefore they formed a double bottom bull flag. Some traders saw bar 3 as the end of a wedge bear flag with the first two pushes being four and six bars earlier. This made bar 4 a small breakout pullback buy setup from the small breakout of the bull flag that formed two bars before bar 4. Other traders saw bar 3 as a breakout of the bear flag, but the breakout had no follow-through, which made traders wonder if the flag was a final flag and if the market was going to reverse up.
Bar 6 made an exact test of the bar 3 low and was unable to drop below it (or below the bar 1 low), so this was a broader double bottom bull flag, with bar 3 (or bars 3 and 4) forming the first bottom. This is also referred to as accumulation. The institutions were defending the bar 1 low instead of attempting to run the stops, indicating that they believed that the market was going up.
Bar 5 was a moving average gap bar, which often provides the necessary countertrend momentum to lead to a trend reversal. It broke a major trend line. Bar 6 was a higher low test of the bar 1 trend extreme and a breakout pullback from the bar 5 bull spike. Bar 6 was also a higher low major trend reversal, three pushes down from bar 5, and a one-bar final flag reversal (from 2 bars earlier).
FIGURE 8.3 Weak Double Bottom Pullback
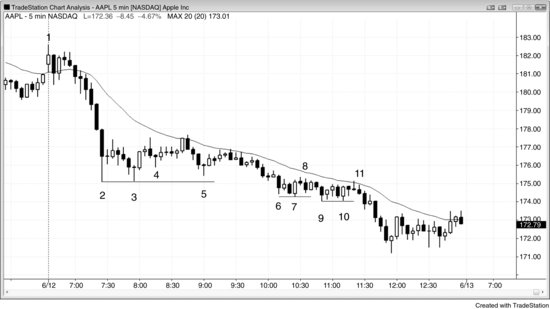
Some double bottom pullbacks just don’t look strong, and that usually means that they are part of a bear flag and not a reversal pattern. In Figure 8.3, bar 4 looked like a setup for a double bottom pullback long, but bar 3 was 5 cents above the bar 2 low in a very strong bear trend. This slightly higher low usually negates the pattern and makes a two-legged bear rally much more likely than a new bull trend. Also, the first pullback (whatever minor rally would follow bar 2) in a strong trend almost always sets up a with-trend entry, so it was not wise to be looking for bottoms here. However, the market rallied over $1.00 from the long entry, if a trader took the trade. With the big tails on bars 2, 3, and 4, and with the market still in the first 90 minutes and therefore prone to opening reversals, it was a reasonable trade. The smartest traders would have been shorting the moving average test, which came in the form of a triangle (there were three pushes up, with the first coming two bars after bar 2 and the second forming on the bar before bar 4). If you instead scalped that long, it could have been difficult to quickly switch to a shorting mentality.
Bar 8 was a double bottom pullback setup, with bar 7 being 13 cents below the bar 6 low, but the entry never triggered (the bar after bar 8 was unable to take out the high of bar 8). Again, bottom picking in a strong bear trend without a prior strong trend line break is not a good approach. The market was in a tight bear channel, and channels usually last much longer than what seems reasonable. Traders should only look to buy if there was first a strong bull breakout and then a pullback, or some other type of reversal, like the final flag reversal attempt after the spike down from the tight trading range that ended at bar 11. Even then, in the absence of a prior rally, any reversal was more likely to lead to a trading range instead of a bull trend, and therefore any long was only a scalp.
Bar 11 was a third attempt at the bottom formation. The low of bar 10 was 2 cents above the low of the bar 9. Traders who bought the double bottom would have exited or they would have reversed to short at the bar 11 low 2 at the moving average. The most experienced traders would not have bought the weak double bottom; instead they would have waited, expecting it to fail, and would have shorted the low 2 at bar 11.
At the end of the day there was a small double bottom bull flag followed by an inside bar. Since an inside bar is a pause and therefore a type of pullback, the inside bar completed a small double bottom pullback buy setup.
Bars 2 and 3 formed a double bottom, but there was also a double top within that trading range. Whenever there is both a double bottom and a double top within a trading range, there is usually a move back to the middle, which establishes a triangle, as was the case here at bar 4. The trading range continued sideways and, as expected, eventually broke out in the direction of the trend that preceded it.
FIGURE 8.4 Double Bottom and Top Pullbacks
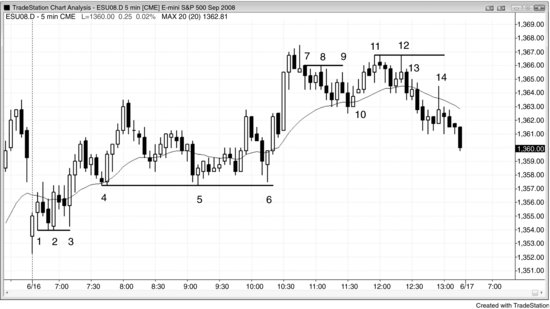
As shown in Figure 8.4, the Emini today had both double bottom and top pullback reversals. Bars 1 and 2 formed a double bottom, although at first glance bar 1 might be easy to overlook. The bottom of an entry bar has protective stops below it and it will often be tested, as it was by bar 2, and two moves down to the same level is a double bottom, even if the first one is not a swing low. With the big tail on the bottom of bar 1, there was almost certainly a 1 minute higher low (and in fact there was). Bar 3 was a deep pullback that tested the double bottom, so it was a second attempt to run the stops. It could not even get as close as the first attempt at the bar 2 low before the bears pulled out and the bulls took control. Some traders saw bars 2 and 3 as a double bottom bull flag, while others thought of them as a triple bottom bull flag or a double bottom pullback. It does not matter which feature you think is more important, because they all are buy setups.
Bars 4 and 5 created a double bottom bull flag on this trending trading range day. This double bottom was tested by the bar 6 pullback, forming a large double bottom pullback. You could have called it a triple bottom as well, but that term would not add any trading benefit here so it was not worth using. A trader might also see it as a double bottom major trend reversal from the small bear trend that ended at bar 6 (all bull flags are small bear trends).
Bar 7 was similar to bar 1, in that it was also an entry bar. It and bar 8 formed a subtle double top. Also, the two-bar reversal just before bar 7 was a push up, and the doji bar just before bar 7 was a second push up; together they formed a double top. It does not matter which pattern you think is more important since they are both topping patterns. All you need to know is that the market is trying to turn down.
Bar 8 tried to run the protective stops above the bar 7 short entry bar, but failed. Bar 9 was a second attempt and failed at an even lower price, creating a double top pullback short setup with an entry on a stop at one tick below the low of bar 9. This short formed a five-tick failure and set up a good reversal to a long on a stop above the two-bar reversal at the moving average. Bar 10 was the entry bar. This wedge pullback bull flag tested the top of the bar 4 to bar 6 trading range, and was a breakout test.
Bars 11 and 12 formed a double top bear flag short setup, and alerted traders to look for a later double top pullback short setup. The bar 13 bull trend bar was an attempt to rally and test the double top and an attempt to form a high 2.
Bar 14 was a lower high pullback that failed at the moving average, and was a double top pullback short setup as well.