CHAPTER 10
Huge Volume Reversals on Daily Charts
When a stock is in a steep bear trend on the daily chart and then has a day with volume that is five to 10 times its recent average, the bulls may have capitulated and a tradable bottom may be present. The huge volume day is very often a gap down day, and if it has a strong bull close, the odds of a profitable long increase. Traders are not necessarily looking for a bull reversal, but after a climactic sell-off, the odds are good that there will be at least a two-legged move to at least the moving average that will allow them to place a profitable trade that will last from days to weeks.
Incidentally, on a 1 minute Emini chart that is in a strong bear trend, if there is a huge volume bar (about 25,000 contracts), it is unlikely to be the end of the bear trend, but often is a sign that a pullback will come soon, usually after one or two lower lows on less volume (volume divergence). You should rarely if ever look at volume on intraday charts because of its unreliable predictive value on the 5 minute chart, which is the chart that you should mainly use for trading.
FIGURE 10.1 Huge Volume Reversal
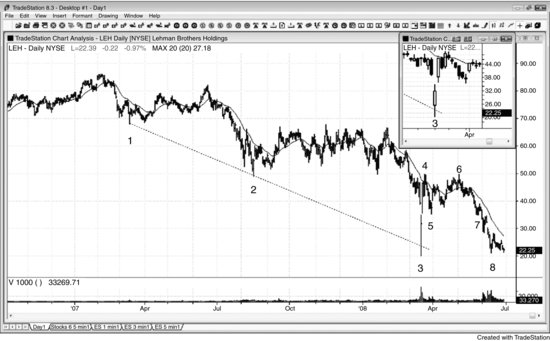
Sometimes markets reverse up on huge volume days. As shown in Figure 10.1, Lehman Brothers (LEH) opened with a huge gap down on bar 3 and then ran below a bear trend channel line (from bars 1 and 2), but rallied strongly into the close. Volume was three times that of the prior day and about 10 times that of the average of the past month. With such a strong bull trend bar (seen more clearly on the candle chart thumbnail), it was safe to buy at the close, but a more cautious trader would have waited until the market took out the high of this possible signal bar. The market gapped up on the next day. A trader could have bought the open, waited for a test down, and then bought a new intraday high, or looked for a sell-off on the 5 minute chart and bought the reversal up after the attempt to close the gap failed. This kind of strength is almost always followed by at least two legs up (the second leg up to bar 6 occurred after the successful bar 5 gap test higher low) and a penetration of the moving average.
Bars 4 and 6 formed a double top bear flag.
Bar 7 attempted to form a double bottom bull flag with bar 5, but instead resulted in a breakout pullback short entry three bars later.
As of the final bar on the chart, the market was testing the bar 3 low in an attempt to defend the stops below it and form a double bottom. Months later, LEH went out of business.
FIGURE 10.2 Huge Volume without a Reversal
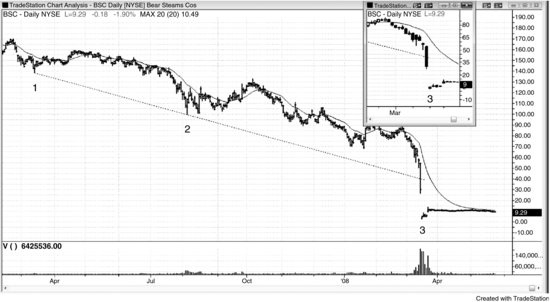
Huge volume on a big down day does not guarantee a rally. As shown in Figure 10.2, Bear Stearns (BSC) had a huge bear trend day on a Friday with volume that was about 15 times that of a typical day. The stock had lost about 70 percent of its value over the prior two weeks. However, the volume was only about one and a half times that of the day before and there was only a minimal bull tail. The price action was against the longs since there was no reversal from the break of the bear trend channel. In fact, the huge bear trend bar closed well below the line, confirming the strength of the trend channel line failure to contain the bear trend. The stock lost another 80 percent when it opened on Monday (bar 3), but traded slightly less volume. Traders who bought the Friday close, thinking that a climactic bottom was in and that there was no way that the country’s fifth largest investment bank and brokerage could fall any further, were devastated come Monday. Climactic volume in the absence of bullish price action is no reason to fade a strong bear trend.
This chart covers the same time period as the preceding LEH chart. However, the LEH chart did not break the bear trend channel line (bar 3) until Monday and it reversed up on that day on huge volume. Here, on the BSC chart, the huge volume day was a day earlier and it also broke below the bear trend channel line, but the day closed near its low with no bullish price action. It gapped down on bar 3, just like LEH (bar 3 is the Monday for both stocks), but LEH rallied strongly whereas BSC could barely rally at all. Bar 3 for BSC was still a bull reversal bar following the break of a bear trend channel line, but any traders choosing between buying LEH and BSC on that day would obviously much rather buy LEH because of its very strong bull reversal bar. Even if traders bought BSC at one tick above bar 3, they would have made more than 100 percent over the next three days, but LEH was clearly a much more certain bull bet.
Since this chart was printed, BSC was bought out by JPMorgan Chase (JPM) for a tiny fraction of its market capitalization of just a few months earlier.