CHAPTER 11
Key Times of the Day
The trading day can be divided into three periods, and although the same price action principles apply throughout the day, there are some generalizations about each period that are useful for traders. Any type of price action can happen at any time of the day, but there is a tendency for the first hour or two to be the most likely time of the day to find a trade where you can make two to three times your risk. This is the most important time of the day, and for most traders it is the easiest time to make money (and the easiest to lose money, if a trader is not careful). In general, most traders should work very hard to take trades in the first hour or two because those trades have the best trader’s equation combination of reward, risk, and probability. Because of its importance, the chapters in Part III discuss it in detail. There are often reports at 7:00 a.m. PST, and they commonly lead to the trend of the day. Computers have a clear edge in speed of analysis and order placement, and they are your competitors. When your competition has a big advantage, don’t compete. Wait for their edge to disappear, and trade when speed is no longer important. Once the always-in direction has been established, then look to take the trend trade. Even though you might miss the first bar or two, if the trend is strong, there will be plenty of points left in the trade.
On the daily chart, there is often a small tail below strong bull trend bars and above strong bear trend bars. These are often caused by opening reversals. For example, if bulls think that the day is likely to be a strong bull trend day and it trades down for the first few bars of the day, the majority of them will believe that this will likely be the low of the day and a great opportunity to buy at a tremendous value that will soon disappear. If they are right, the market will rally, and they will have bought around the low of the day. On the daily chart, there will be a small tail on the bottom of the bull trend bar that resulted from the three-bar sell-off on the open. Because they were ready for that possibility, these smart bulls made a huge reward, risking little, on a trade that probably had at least a 50 percent chance of success (remember, because of the overall character of the market, they believed that the day was likely to rally).
The middle of the day, beginning around 8:30 to 9:30 a.m. PST and ending around 11:00 to 11:30 and sometimes as late as 12:30, is more prone to two-sided trading, like trading ranges or channels. This is the time of the day when tight trading ranges are the most common. This is a terrible environment for entering on stops. In very two-sided markets, when the market goes down a little, buyers come in and take control, so entering on stops as the market is falling is the exact opposite of what the institutions are doing in these tight trading ranges. The buyers are the bears scalping out of their profitable shorts and the bulls buying for scalps up. At the top, the opposite happens and the selling predominates. The bulls sell out of their profitable long scalps, and the bears sell to initiate short scalps. There are swing traders as well, but in general, when the market is in a trading range, whether or not it is tight, most of the volume is scalping and the institutions are buying low and selling high. The best way to make money as a trader is to do what the institutions do, so if you are going to trade in a trading range, look to scalp, and buy low, sell high. Experienced traders will sell on limit orders above weak high 1 and high 2 buy signal bars at the top, and buy on limit orders below weak low 1 and low 2 signal bars at the bottom. Because limit orders trades are more difficult to evaluate accurately, beginners should avoid them. Be very careful about stop entries and only sell on a stop if you are at the top of the range as the market is turning down, and only buy on a stop near the bottom as the market is turning up. The market always races to the top and bottom, suckering hopeful beginners into buying on stops at the top and selling on stops at the bottom. They just look at the strength of the spikes up and down and ignore the trading range of the past 20 bars and end up doing the opposite of the institutions. Because so many of the trade setups are for scalps and most traders cannot make a living by scalping, they should be very selective during this time. Since the high or low of the day forms during the first third of the day in maybe 90 percent of days, the middle third of the day is usually when traders are deciding if the initial trend should resume or reverse. The bulls and the bears are active, each fighting over control and each trying to generate a trend into the close. The market often reverses around 8:30 a.m. PST and then trends for the rest of the middle third of the day. Traders need to be aware that the trend that began at the open might not last all day, and the exact opposite can develop after the first couple of hours.
Beginning traders tend to lose money in the middle third of the day. They often lose more than they have made in the first third of the day, and if that is the case, they should consider not trading in the middle third unless signals are especially strong. Many traders make most of their money in the first couple of hours of the day and then trade much less or not at all during the middle of the day. If a person owns two stores and one makes a lot of money, but the other consistently loses money no matter what the owner does, and often more than what he makes from his good store, should he continue to operate both stores? The answer is obvious. You can look at the first and middle thirds of the day as two stores. There is nothing wrong with closing that losing store. Your goal is to make money, not to trade all day long. If the price action is good all day long and you are not tired, then it is financially wise to trade all day. However, that is usually not the case. The middle third tends to have much more two-sided trading, channels, tight trading ranges, many reversals, trend bars without follow-through, and lots of dojis. Unless traders are very selective with their stop entries or capable of making money by fading moves with limit orders, they should just wait for the price action to become more predictable. It is always better to not take any trades than to take trades where your losses are greater than your wins. Beginners frequently win just often enough to make them continue what they are doing, hoping that all they need is experience. However, no matter how much experience they accumulate, a tight trading range will always be difficult to trade. It is almost always better to wait until the always-in direction is clear, so that the odds of follow-through are high enough to allow for a profitable trade.
The three periods of the day often create a trend resumption pattern. For example, if there is a sell-off for a couple of hours, and then a rally into around 11:30 a.m. PST, the market might sell off again after that, resuming the bear trend of the first third of the day. Sometimes the pattern is clearly up-down-up or down-up-down, but more often it is less obvious, even though the tendency is still there. Because of this, many traders will view any move in the middle third of the day that reverses a move of the first third as simply a potential pullback from the initial trend. They will then look for the original trend to resume around 11:30 a.m., and if there is a sign that this is what’s happening, they will take the trade. Even on days when the pattern is not clear, traders know that the market often makes some move around 11:30 a.m. that will often carry into the close of the day as the institutions begin their final trading of the day. The move can be a reversal, but it can also be a breakout. For example, if there was a strong sell-off for the first two hours and then a weak rally into 11:30 a.m., and it appears to be topping out and reversing, the market might instead break out to the upside and lead to a trend reversal day and a rally into the close. Traders aren’t married to any particular direction going into 11:30 a.m., but are always ready for a move in either direction as the market enters the final third of the day and the institutions begin their final trades.
The final period of the day runs until the close; it often resumes the trend from earlier in the day, as in a trend resumption day, but it sometimes reverses the trend and forms a reversal day. If there is a strong bull trend on the daily chart, most days will have closes above the opens and the market will usually try to rally in the final 30 to 60 minutes. Bear trends have more days with closes below the opens and often sell off into the close.
There are two very different types of price action that traders should look for in the final 30 to 60 minutes because each offers opportunities if traders are prepared, and each poses problems if they are not. First, the market sometimes will have a relentless trend in the final half hour as risk managers tell their traders that they have to cover their losing positions before the close. Momentum programs detect the strong trend and also trade wth trend relentlessly, as long as the momentum continues. On some days many mutual funds will have similar orders to fill going into the close. Traders who want to enter on pullbacks get trapped out because a pullback never comes. If you see this, enter with the trend on the close of the current bar and put your protective stop beyond the other end of the bar. If the trend continues into the close, you can make a quick windfall profit. It is worth noting that traders often get tired, and since their edge is small, they should refrain from trading if they cannot trade at their best. Traders can get tired, bored, or distracted at any time during the day and should not trade until they are back to normal. The computers don’t get tired and trade into the close as well as they did all day long. This is another one of the advantages that they have over individual traders.
When there is a bull trend on the daily chart, there will almost always be more bull trend bars than bear trend bars. The opposite is true when there is a bear trend. For example, if the market is in a strong bear trend and there is a moderate rally going into the last hour, many traders will expect the day to close near its low and for the bar on the daily chart to be a strong bear trend bar with a close near its low. Because of this, experienced traders will be quick to short any rally that begins to reverse down toward the end of the day, expecting a close near the low of the day. Other traders will wait for the sell-off to become clear and then short. The result is often a strong bear trend into the close of a bear trend day when there is a bear trend on the daily chart. The opposite is true of bull trends on the daily chart, where the preponderance of the bars close near their highs and the market often rallies into the close after a sell-off before the final hour.
The other type of close is more difficult for traders because instead of trapping them out of a winning trade, it tends to stop them out with losses. The market will trend into the close but have large bars, big tails, and two or three reversals that run stops but do not hit the original stop beyond the signal bar. If your premise that there is a trend into the close is correct and the market is forming a bar or two with large tails, you can make money if swing the trade and stick to your initial stop until after the pullback, and then tighten your stop to just beyond the pullback.
Whenever a report is released, whether it is a 7 a.m., PST, housing report or an 11:15 a.m. FOMC announcement, slippage is common as you get in or out of your trade, so the risk is often larger and the reward is often smaller. Also, the probability is only 50 percent. The result is a bad trader’s equation, and most traders should wait for seconds to minutes until the market becomes orderly before placing a trade.
FIGURE 11.1 Risk Managers Contribute to Trends into the Close
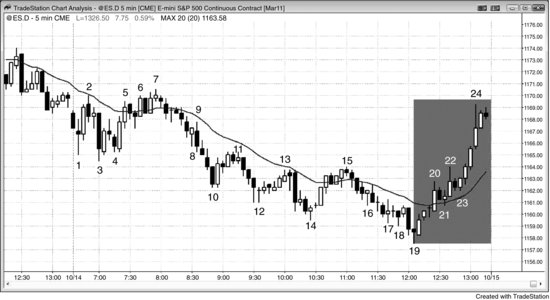
As shown in Figure 11.1, the rally into the close was due in part to the risk manager shoulder tap. As the market began to turn up and reached bar 22, all of the traders who shorted after bar 10 were in jeopardy of having losing positions by the close, and all those who shorted after bar 16 were already holding losers. Risk managers at trading firms monitor what positions traders are holding into the close. If a lot of traders are holding shorts that are suddenly becoming losers, they might be emotionally attached to their trades and hope for a late sell-off. Their bonuses depend on their performance, and they might hate to admit that they are suddenly wrong about today’s bear trend. The risk manager’s job is to be coldly objective, and he will tell the traders to buy back their shorts. If this takes place at enough firms, it can contribute to a relentless uptrend into the close. Traders at home were hoping for a pullback, but it never came. Once they realized what was happening, they could have bought above the brief pullbacks at bars 21 and 23 or bought the close of any bar, and then placed protective stops below the low of their entry bar. Momentum programs detect the relentless buying and begin buying as well, and will continue to buy as long as the momentum up is strong. Mutual and hedge fund purchases going into the close can also contribute. All of these traders are doing the opposite when the market sells off into the close.
The market was in a tight bull channel on the daily chart (not shown). Only two of the past 32 days closed near the low of the day, and 21 of the past 32 days closed above the open. In bull swings on the daily chart, most days had bull bodies, and traders were eager to buy a rally into the close.
The market was in a trading range for the first couple of hours; the range was about half the size of an average daily range, alerting traders to a possible breakout into a trending trading range day. As the market moved down from the bar 7 double top with bar 2, traders became more convinced that the breakout would be to the downside, and the selling increased. The market then formed a lower trading range, but then sold off from the bar 15 moving average gap bar, broke out to the downside, but reversed up to above the open. Remember, most reversal days begin as trending trading range days.
As is often the case, the market went sideways in the middle third of the day, and then the bear trend from bar 7 to bar 10 tried to resume in the final third of the day. However, the downside breakout failed, and the bar 10 to bar 16 trading range became the final flag in the bear trend.
FIGURE 11.2 Trends into the Close Can Be Scary
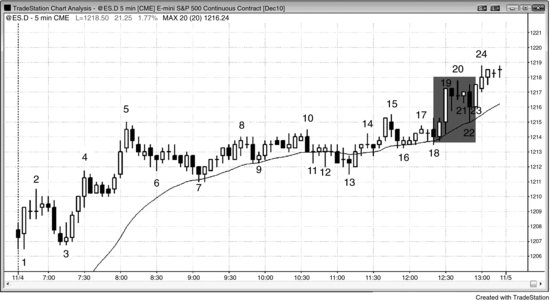
You can be right about the trend into the close and still lose money when the market has a couple of dojis before the close. As shown in Figure 11.2, the two strong bull trend bars that formed a spike up to bar 19 were likely to have follow-through, but the protective stop on any long needed to be below the spike or at least below the low of the second large bull trend bar. Once the market began forming dojis around bar 20, there was a risk of a sharp pullback. If you bought above bar 16, you could have used a tight stop below bar 20 or a breakeven stop. However, if you bought the close of the bar 19 spike or above the bar 21 doji, you needed to risk to below the low of both bars of the spike or at least to below bar 19. The tails were a warning that the market was two-sided. If you take a trade in this type of market, and only very experienced traders should ever consider staying in when the market enters a tight trading range at the end of the day, you have to trade it for the swing and allow for two-sided movement and use a wide stop.
This was a trend resumption day, where there was a rally for approximately the first third of the day, ending at bar 5, and then a trading range for the middle of the day, and a resumption of the bull trend into the close of the day. The final rally began at 11:15 a.m. PST, although the upside breakout did not come until 12:30 p.m.
FIGURE 11.3 Midday Reversal
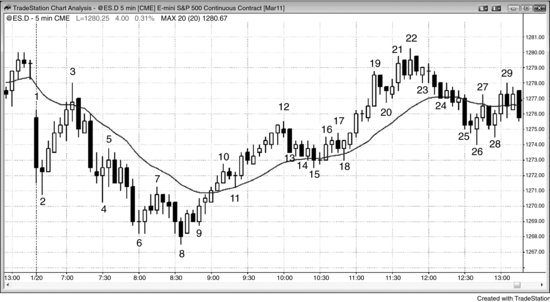
After the trend of the day becomes established within the first hour or so, the market often reverses at the start of the middle third of the day, between about 8:00 a.m. and 9:30 a.m. PST (usually around 8:30 a.m.). Sometimes the market instead enters a trading range for several hours, and then breaks out in either direction at some point in the final hour or two. The breakout can lead to either a trend resumption day or a reversal day. As shown in Figure 11.3, the rally from bar 8 to bar 12 was so strong that the earlier bear trend was unable to reassert itself going into the final third of the day. Instead, the rally from bar 8 to bar 12 resumed upward after the weak attempt at bar 17 to reverse the market down. The bull resumption began with the bar 18 pullback from the bar 12 to bar 15 wedge bull flag to the moving average. The bulls were unable to continue the rally, though, and the market sold off back to the open, creating a doji day on the daily chart.
Bar 3 was a test of the moving average and a double top with bar 1, and therefore a possible high of the day. Traders were looking for a breakout of the bottom of the opening range and then about a measured move down. Instead, the market had a bear spike down to bar 4 and then two more pushes, creating a bear spike and channel trend where the channel was a wedge. Traders saw this as a possible reversal up at the start of the middle third of the day and a potential low of the day. The buy signal was above the two-bar reversal that began with bar 8. Many traders saw the market as having flipped to always-in long on the bar 9 outside up bar, and most traders believed it was long by the end of the bar 10 bull spike.