CHAPTER 15
Always In
This might be the single most important concept in trading. Traders should constantly assess whether the market is trending, and an “always-in” approach can help a trader to make that important determination. If you had to be in the market at all times, either long or short, the always-in position is whatever your current position is. Some variation of this is used by many traders, including institutions. For example, most mutual funds are usually always-in long, and most hedge funds remain close to fully invested, but often have always-in long positions in some markets while simultaneously having always-in short positions in others. Individual traders should consider using an always-in approach if they tend to miss too many big moves.
Determining the always-in direction is different from asking whether the trend is up or down, because most trend traders don't hold a position when the market is unclear. The market, at all times, is either always-in long or always-in short, and there is usually a general consensus about the direction of the trend. Traders who take 20 or more trades a day see the always-in position flipping repeatedly throughout the day, but very few traders could reverse this often, day after day. However, traders who are just looking for the best three to 10 swings a day, and are willing to allow multiple pullbacks without changing their opinion about the direction of the current swing, have an always-in mentality. They can either reverse at each new signal or take profits once a swing begins to weaken and then look for a trade in either direction. Few traders actually stay in the market all day long, reversing at every opposite signal. Most traders need to take breaks during the day and they have a difficult time placing reversal trades. Although they will take many always-in reversal setups, they usually trade each as a swing trade, exiting before looking for a trade in the opposite direction. They focus more on making a profit that is at least as large as the risk, rather than on reversing on the next opposite signal, and use always-in signals as their entry setups. In general, if a signal is clear enough to be an always-in reversal, traders should assume that it is then at least 60 percent certain of reaching a profit target that is at least as large as the risk. Even though the minimum criterion for an always-in signal is that the market is more likely to go in the new direction than in the old one, which implies that all that is needed is 51 percent certainty, most such signals are 60 percent certain or higher. For example, in the Emini, if traders need to use a two-point stop to take a trade, they should use a profit target that is at least two points from their entry, and they will likely have at least a 60 percent chance of success if they read the price action correctly.
If traders look at the chart at this moment and are forced to initiate a position right now, either short or long, and they could decide at least slightly in favor of one direction or the other, then they see an always-in position. This is the direction of at least the short-term trend. If they cannot formulate an opinion, they should look at the moving average and at the move that led to the current state of uncertainty (remember, uncertainty means that the market is in a trading range). If most of the closes of the recent bars are below the moving average, the always-in position is probably short. If they are mostly above, always in is probably long. If the move leading up to the trading range was a rally, the always-in position is probably long. If it was a sell-off, always in is probably short. If you are hoping for a pullback to buy, the always-in position is probably long. If you are hoping for a rally to short, always in is probably short. If you simply cannot decide, then the market is in a trading range and you look to buy low and sell high. Your goal is to get synchronized with what the market is doing. It is like when you were a child and two of your friends were swinging a jump rope and you were about to run in and start jumping the rope. You would watch it intensely to sense the rhythm. Once you were reasonably confident, you began jumping. With trading, once you are reasonably confident of where the market it heading, that is the time to jump in.
Some traders use higher time frame charts to determine the always-in direction. For example, if they trade the 5 minute chart, and the 60 minute chart is in a bull trend and above the moving average, they will look only for buy setups on the 5 minute chart. Others use indicators on higher time frame charts in the same way. For example, if the 60 minute stochastic is rising, they will look only to buy pullbacks on the 5 minute chart. Some traders don't feel comfortable evaluating 10 to 20 reversals a day on the 5 minute chart and instead prefer a higher time frame chart where there might be only three to five decisions a day. This is an effective approach, but since the bars are larger, stops have to be larger as well, and that means that position sizes should be smaller.
Even before the market opens, traders have a bias that the final always-in position from yesterday might still be controlling the market. However, once there are two consecutive reasonably strong trend bars in the same direction, they probably create the new always-in direction. It is uncertain until there is a breakout and then follow-through, but it is a starting point. If the context is right, it can lead to a trade, like entering on the first pullback. With a lot of experience, a trader could theoretically stay in the market all day, reversing at each reasonable signal.
The market is always trying to reverse, and often comes very close, but lacks that last bit of follow-through that traders need to become confident that the reversal was successful. These near flips are great opportunities for the with-trend traders. For example, if there is a bull trend that forms a strong bear breakout bar, many bulls will buy the close of the bar, expecting that there will be no follow-through selling. They correctly believe that most reversal attempts fail and that this will be a brief opportunity to buy at a great price. Other bulls will wait to see what the close of the next bar looks like. If it is not a bear close, they will buy the close, and other bulls will buy above its high, and above the high of the strong bear bar where bears might have their protective stops. When the bears don't get the immediate follow-through that they need, they will buy back their shorts. With both the bulls and the bears buying, the market goes up for at least several bars. The bears will not be willing to short until another reasonable setup occurs, and that often will occur after a new trend high. When beginning traders see that strong bear spike, they become scared. They think that the market is breaking out and that they need to short immediately. All they see is the very strong bear bar and suddenly ignore the strong bull trend that preceded it. They end up shorting within a tick or two of the low of the failed breakout attempt, and get stopped out as the market works back higher. Often, the rally looks weak, so they do not buy. They keep looking to sell a low 1 or low 2 short, expecting follow-through after that strong bear spike, but the low 1 fails, and their stop gets hit. Then the low 2 fails, and they lose for a third consecutive time. This is because they do not understand what it means when a market is always-in long. It means that the bull trend is still in effect, and although it almost flipped to always-in short, it did not. Until it does, the only direction for trades is long. It is a costly mistake to keep betting that reversals will be successful, because 80 percent of them are not.
Always in is a swing approach to trading. For it to be effective, traders should look for only the most significant three to as many as 10 swings a day and not keep reversing at every minor signal (many days have 20 or more reversals, but most are too small to be traded profitably). Also, most traders exit some or all of their position once the trade has moved in their direction for a distance equal to about two or three times their initial risk, and they do not worry about staying in the market at every moment. When institutions begin to take profits, the result is a pullback to a level where these institutions will reenter in the direction of the trend, resulting in a resumption of the trend. When a strong trend transitions into a trading range, the always-in position often remains unchanged. If traders are going to trade in the trading range, they should scalp most or all of their trades. However, if the always-in position does not change, they should consider taking scalps only in the direction of the trend. For example, if there is a strong bear trend that is starting to correct up, but there is no strong bull spike and the market is staying below the moving average, the always-in position will remain down. Even though the market is in a trading range, traders should look for scalps only in the direction of the trend, which means that they should look for shorts. If there is a strong buy setup, it will probably flip the always-in position to long, at least for enough bars to buy for a scalp. However, any buy setup that is not strong enough to flip the always-in direction to up is generally not worth trading.
Since this is a swing approach, traders should not use it when the market is in a tight trading range. In fact, most traders should not trade then, and should instead wait for the breakout or failed breakout. Either can lead to an always-in swing trade. If experienced, profitable traders want to trade in a tight trading range, they should either take the always-in trade that was present prior to the formation of the tight trading range and hold for a swing profit, or simply trade scalps with limit order entries, fading the extremes of the range and the breakouts above and below the prior bars.
On trading range days, always-in reversals are often unclear until the market gets near the opposite end of the range. For example, it often is not clearly long until there is a bull spike that surges to the top of the range, and it is often not clearly short until there is a strong bear spike that races to the bottom of the range. However, buying near the top of the range and shorting near the bottom is the exact opposite of what traders should be doing. Always in is a swing concept that applies to trends, and is dangerous within trading ranges, where it is better to scalp and buy low and sell high. For example, as the market is moving toward the top of the range, there will be breakouts above swing highs within the range that might make some traders see the market as flipping to always-in long, but usually the swing high is not important enough and the breakout and follow-through are not strong enough to convince everyone that the market has flipped. If you are looking at the move up and are wondering if it has truly flipped into an always-in long move, then you are uncertain. Since uncertainty is the hallmark of a trading range, you have your answer. Trends create a sense of sustained urgency. You are certain that the market has more to go and you are desperately hoping for a pullback so you can buy lower. Traders realize that if the move up is a new bull trend and not just a brief spike up in a trading range, the move will have a series of strong bull bars and won't pause after going above each swing high. A consensus forms only if the market breaks strongly above the entire range and has follow-through, not if there is simply a sharp move within the range toward the top or bottom. Beginners are afraid that there might not be much left to the move, but experienced traders know that a strong successful breakout from a trading range will usually reach a measured move target at a minimum and provide plenty of room for a profit.
On trading range days, the strongest bear spikes often form near the low of the day because of a sell vacuum. The strong bulls expect a test of the low of the trading range, so they stop buying as the market approaches the low. This creates an imbalance and the market falls quickly in a bear spike. Also, momentum programs will sense the acceleration and they will also quickly short until the momentum slows or reverses. If traders looked at only the current leg down, they would see a strong bear spike and assume that the always-in trade had just become strongly short. However, if they stepped back and looked at the entire chart, they would be suspicious of a possible sell vacuum. Instead of looking for shorts, they would look to buy the failed breakout attempt.
So what does a trader need to see to be able to choose an always-in direction? Almost all always-in trades require a spike before traders will have confidence. Traders want to see a breakout that is strong enough for them to expect follow-through. The signs of strength of breakouts were discussed in the second book. There usually has to have been at least two consecutive strong bull trend bars before most traders will believe that the always-in direction is long, and at least two consecutive strong bear trend bars before they will think that always in is short. During the first hour, before a clear trend is established, two consecutive bull trend bars will make traders look for buy scalps, and two consecutive bear trend bars will make them look for sell scalps. This is discussed in Chapter 19 on trading the open.
If the context is right, even a single trend bar with an average range can be enough to make traders believe that the always-in position has flipped to the opposite direction. Usually, however, at least two or more consecutive trend bars are needed before enough traders believe that the direction has reversed for there to be significant follow-through. Just like a countertrend trader might be willing to hold a position through one pullback but not two (for example, when buying a bottom, the bulls will exit and sometimes reverse to short if a low 2 triggers), always-in traders will generally prefer to see a second consecutive strong trend bar before they feel that the always-in position has reversed.
Since a second trend bar is usually needed for traders to believe that the always-in position has reversed, the close of that trend bar is important. For example, if there is a bear breakout bar, then traders will carefully watch the close of the next bar. The bears will want a bear close and the bulls will want a bull body. The market has inertia, so most attempts to change what it is doing will fail. This means that many traders will buy the close of the bear breakout bar, expecting that the follow-through bar will have a bull close and the bears will give up. If the breakout is not too strong and there is a good reason to believe that the breakout should fail (like a breakout attempt at the bottom of a bull flag), this can be a good trade; but because the decision is difficult, only experienced traders should consider it. The bulls want to buy pullbacks, so they look for bear spikes to fade. They see a bear spike as a commitment by the bears who are on the wrong side of the market, and will therefore have to buy back their shorts with losses. Also, those bears will not look to sell again for at least a bar or two, so there will be fewer bears coming into the market. This increases the chances that the bulls who bought that bear spike will make a profit. Similarly, when the market is always-in short, bears look at bull spikes at the top of small legs as great opportunities to short. They assume that the bulls will be trapped and will soon have to become sellers as they exit their longs with losses.
If the follow-through bar is strong, traders can enter on the close of the bar or on a small pullback. For example, if there is a strong bull breakout and the next bar is a strong bull trend bar, many traders will buy on the close of that follow-through bar or on a one- or two-tick pullback. If the follow-through bar is weak, like a doji, it is usually better to look to buy pullbacks rather than the close of the bar. If the follow-through bar goes only a few ticks beyond the breakout bar, odds favor a failed breakout. If it goes many ticks beyond, the odds favor the bar becoming a strong trend bar once it closes. Most traders will see the market as having a clear always-in direction. Sometimes the market goes only a few bars beyond the breakout bar and then quietly reverses in a channel against the direction of the breakout without ever clearly confirming that the breakout has failed and that the always-in direction has flipped. In this case, the always-in position is probably unchanged for most traders, but they will have protective stops to get them out if the pullback grows too far. The market is likely entering a trading range, so they will convert to a trading range mode of trading, which means scalping and not allowing their winners to turn into losers. For example, if there is a bull breakout followed by a few weak bars of follow-through, and then the market begins to form a weak bear channel without ever having a bear spike, the market can remain always-in long. However, bulls should have protective stops, just in case the bear channel falls a long way without ever having a clear bear reversal. If bulls bought early on and had a large open profit, they could have their stops at breakeven. If they bought late, they should probably exit below the signal bar. In general, if the follow-through is weak, traders should not buy near the high, and should instead wait to buy a pullback. If they did buy near the top, they could only do so because they sensed urgency. If there is no immediate follow-through to prove that the urgency is present, they should exit and look to buy on a pullback.
As a guideline, the minimum requirement for an always-in flip to short is usually that the follow-through bar not have a bull close. If it is a small bear bar or a doji bar, this is confirmation that the bears are in control for most traders, but it is a sign that the new bear trend is not strong. It is better to look to sell rallies and low 1 and low 2 setups than it is to sell the closes of the bars. If the follow-through bar has a strong bull body or is a bull reversal bar, this can be a buy signal for a failed breakout. If it has a small bull body, most traders will wait for more evidence before shorting, but believe that the chance of a new trend is much less. The opposite is true when the market is breaking out into a possible always-in bull. The minimum requirement for the follow-through bar is usually that it does not have a bear close. If the follow-through bar is not impressive, then look to buy pullbacks instead of buying the close of the bar. If the follow-through bar has a bear close, the breakout might be a bull trap, and this is often a signal bar for a failed breakout short. However, occasionally the market might have flipped into a bull trend, but traders will need more confirmation before drawing that conclusion.
Once traders are confident that the breakout has follow-through, they will then look for a measured move. For example, if there is a strong bull spike lasting three bars and breaking above a trading range, many traders will believe that there will probably be a measured move up based on the height of the spike or the height of the trading range, and many will immediately buy at least a small position at the market. Since they are confident, then they are at least 60 percent certain about the directional probability (discussed in book 2) of an equidistant move, and whenever that is the case, the math favors taking a trade. As the spike continues, the risk remains constant, and the directional probability of an equidistant move will stay at 60 percent or better, but the reward grows and this makes the trade even better mathematically. If they buy at the top of a strong three-bar spike in Goldman Sachs (GS) and the spike is $1.00 tall, there is at least a 60 percent chance that the market will go up for a measured move of $1.00 before it falls $1.00 to the bottom of the spike. If the spike grows to $1.50 over the next couple of bars, they are still risking to the bottom of the spike (they would probably have tightened their stop at this point), and now the measured move target is $1.50 above the current bar and $2.00 above their entry. They now have at least a 60 percent chance of making $2.00 before losing no more than $1.00, which means that their trade is very strong. If the spike continues to grow, the probability will remain good and the reward will continue to grow. As traders tighten their stops, the risk shrinks and the trade becomes even better mathematically. In general, whenever the market is clearly always in and traders are assessing a trade using the trader's equation, they should assume that the probability is at least 60 percent.
The market usually enters always-in mode at some point in the first hour, and many traders like to take an always-in trade at that point. Some take profits once the market moves in their direction for a distance that is one or two times greater than their risk. For example, if they bought an always-in entry in Apple (AAPL) and their initial protective stop was a dollar below their entry price, they would try to exit some or all of their trade after a dollar or two of profit. Others prefer to hold their position until there is a clear reversal and the market has flipped to always in, but in the opposite direction. Then they would reverse their position and truly stay always in the market. Since most traders do not have the ability to flip on every minor reversal, they instead look for only the very strongest two to five reversals of the day. Sometimes there will be a pullback that just keeps growing, but does not clearly create an always-in reversal. For example, if the market had a strong bull spike and the market was clearly always-in long, but then there was a low-momentum pullback that went on for hours, traders need to reassess their premise. They should keep a worst-case scenario protective stop in the market just in case the pullback continues to grow to the point that the market falls below their entry price. It will sometimes do that without ever having a clear bear spike and an always-in sell signal. If they had an open profit of several Emini points, they would probably not want the market to come back to their entry price, and they might choose to use a breakeven stop. If they get stopped out, they could wait and look for an always-in trade in either direction. If the market pulls back within minutes of their entry before they had any meaningful profit, their protective stop should be below the bull spike, even though it might be far away. If it is far, their position size has to be small enough to keep their risk within their normal limits.
Once you believe that the market has become always in, it is usually best to enter at least a small position at the market or on a tiny pullback. This is especially true when the always-in direction is clear and strong. When the momentum is low and there is not that sense of urgency, some traders prefer to enter on a larger pullback. However, they risk missing the move since many great always-in trades begin with low momentum, but they just keep going without a pullback until after many bars and many points. In general, whenever the market is always-in long, traders will look at every attempt by the bears to turn the market down as a buying opportunity, because they know that most attempts to reverse a trend will fail. They will buy at and around the close of any bear trend bar, at and below the low of the prior bar or any prior swing low, and below all support levels, like bull trend lines. When the market is always-in short, traders will see every attempt by the bulls to reverse the market up as a selling opportunity, because they correctly assume that most such attempts will fail. They will short around the high of any bull trend bar, the high of the prior bar, any prior swing high, and any resistance level, like a bear trend line.
Since you are swinging during always-in trading, you have to allow pullbacks, which are inevitable. Most pullbacks are not reversal entries, so you cannot allow yourself to be constantly worrying about every move that is against your position. In general, if there is a pullback that would have hit a breakeven stop and then the market resumes in your direction for several bars, it should not come back to your entry price again. Therefore, in most cases, you could then move your stop to breakeven. If it is hit by that second pullback and you are not certain of the market's direction, just remain flat until you feel comfortable with another always-in setup. Remember, uncertainty is a hallmark of a trading range and always in is an approach for trends.
If you believe that there is an always-in direction, you should not take countertrend trades. This is because they almost certainly would have to be scalps, which means that the risk would probably be about twice the reward and the chance of success would have to be an unrealistic 70 percent or greater. If you think that there is going to be a pullback, it is far better mathematically to wait to enter in the direction of the trend at the end of the pullback than it is to bet that the pullback will be large enough and mathematically certain enough for you to make a profitable countertrend scalp.
I have a friend who patiently waits for an always-in setup in the first couple of hours every day, and when he finds one, he expects a trend to last for at least a couple of hours and cover at least a third of an average daily range. Once he sees his always-in setup, he enters the market and then places a bracket order where the stop is beyond the signal bar and his profit-taking limit order is at some measured move target or support or resistance area that is at least twice as far away as his stop. Since he is taking an always-in entry, the probability of at least an equidistant move is 60 percent or better. If he is risking two points in the Emini, then he has at least a 60 percent chance of making two points before his protective stop is hit. However, when he is risking two points, his profit target is always four points or more, and with an always-in entry, his probability of success is likely at least 50 percent. Although the probability is never known with certainty, it is likely over 60 percent with many of his entries. However, he, like many traders, does not want to trade in the middle of the day when minor reversals are common. So what does he do while he is waiting for his trade to work? He goes on errands or out for exercise. He comes back a couple of hours later, and at that point, he looks for an always-in trade into the close of the day.
What constitutes a strong always-in market? Since always in can occur only when there is trend or at least a potential trend, look for the signs of strength in trends and reversals. There is a list of them at the beginning of this book (Introduction). The more that are present, the more likely you will make a profit. An obvious one is a strong spike, especially if it lasts for several bars. For example, if there is a strong reversal up on the open and the spike at this point is made of three reasonably sized bull trend bars, traders are buying at the market and on tiny pullbacks. They do not want to wait for a pullback, because they are more confident that the market will be higher at some point over the next several bars than they are that there will be a pullback. This urgency is a perfect always-in situation, and if you are not long, you should consider buying at least a small position at the market or on a limit order located a few ticks below the high of the bar. You can see where your stop would have to be, which might be at the low of the entry bar of the reversal. If that means you have to risk eight points and you normally risk only two, then take only a quarter of your normal position size. The most important consideration for you is that you must get long, even if it is a tiny position, because you are confident that the market is going higher. If you believe that the day is becoming a strong bull trend day, try to hold at least some of your position until the close of the day, unless a clear and strong bear reversal develops.
For stocks, breakeven stops have less chance of being hit, so it is more profitable to look to swing trade. Typically, look to scalp out a third to a half after about a 0.5 to 1 percent move or about twice the size of your initial risk, and then swing the balance. If the market appears to be reversing against your trade but has not yet reversed, like at a test of a high of the day, take off another quarter to a third, but always try to let at least a quarter run until your breakeven stop is hit, until there is a clear and strong opposite signal, or until the close. Trends often go much further than you could ever imagine.
Hold the position through repeated pullbacks until you exit at your target price, until there is a clear reversal setup, or until the protective stop is hit. Sometimes a pullback is violent, but not enough to trigger an always-in reversal, so stick with your original plan and don't be upset by a single large trend bar against your position. If your stop is hit, stay out of the market until there is another clear and strong setup in either direction. If there is a clear and strong setup, repeat the process. If your trading size is two contracts and you are long one when a reversal pattern triggers, sell three. One gets you out of your remaining long position and the other two start the process in this new, opposite direction. Scalp the first for one to two times the size of your risk and swing the second.
The key to this approach is to enter or reverse only when there is a clear and strong setup. If not, rely on your breakeven stop, even though you may give back all of the gains on your swing portion. If you watch a small basket of stocks, almost every day at least one will set up with a reliable entry that will allow you to put on a swing trade.
At any moment during the day you might decide that there is clearly a trend or that there has been a clear reversal. You need one or both for any always-in trade. One side is in control of the swing and there is likely more to go in that direction. Think about where the protective stop would be and calculate the number of ticks that you would be required to risk if you were to enter at the market. As a general rule, the trend will likely continue about the same number of ticks and the odds of success are better than 50–50, since you believe that there is a trend. If you are confident that the market is always in, the probability is likely 60 percent or more. After the trend continues, you are usually able to trail the protective stop and reduce your risk. Also, your original profit goal can increase if the market has trended a long way since your entry, and the new protective stop location leads to a new profit projection. This results in a revised evaluation with a profit potential that is greater than your risk with the probability of success still greater than 50–50. The improving math that is inherent in swing trading during trends is the reason that it is one of the best ways to trade, especially for beginners.
Experienced traders can use the always-in approach to scale into positions in the direction of the trend, but this requires confidence in your assessment of the strength of the trend. For example, if traders feel that there is a strong bull trend, then they might use limit orders to scale into longs based on the recent average daily range. If they are trading the Emini and the recent average daily range has been about 12 to 15 points and the largest pullback in the past couple of hours has only been two points, they might buy a small position on a one-point pullback and buy more at one and two points lower (10 to 20 percent of the average daily range) and then maybe use a stop on the entire position another couple of points down. If the earlier pullbacks were three points, they might instead place a limit order to buy three points down and buy more two or three points lower and use a two-point stop on the entire position. If at any time the market flipped to always-in short, they would exit the position and look to get short. Scaling in is discussed in book 2.
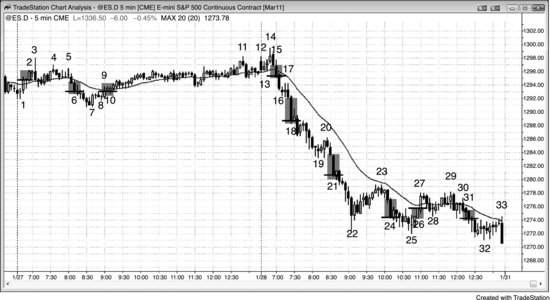
FIGURE 15.1 Always-In Swing Trading
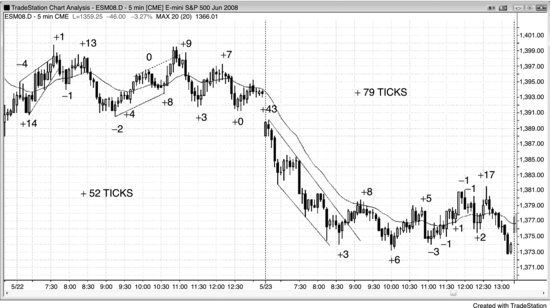
Always-in trading can be a profitable swing trading approach during both trend days and trading range days, if the trading range days have large enough swings. As shown in Figure 15.1, the first day was a trading range day, and the always-in approach could have netted 52 ticks, or about $600 per contract. The second day began as a trend from the open bear and then entered a trading range. An always-in trader could have netted 79 ticks or about $950 per contract. A trader who traded two lots, scalping one and swinging one, could have had 10 successful scalps each day, yielding an additional $450 per contract per day. It sounds and looks easy, but is very difficult to do.
FIGURE 15.2 Higher Time Frame Charts
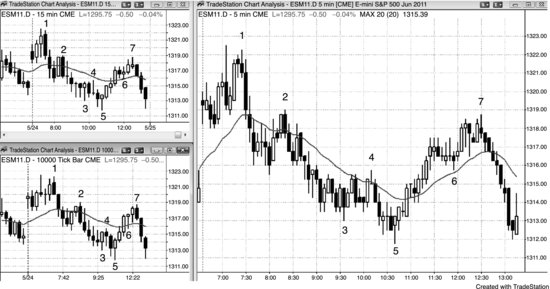
A 5 minute chart, such as the one on the right in Figure 15.2, has 81 bars and more than 20 reversals on most days. Traders who are uncomfortable making that many decisions about the always-in direction can reduce the number of decisions by reducing the number of bars on the chart. The bar numbering on all three charts is the same. The chart on the upper left is a 15 minute chart and the one on the bottom left has 10,000 ticks per bar. Both of these higher time frame charts had far fewer reversals, yet had several good signals, which were enough for a trader to make a living. Since the bars are bigger, stops have to be larger to give the trade a chance to work. To keep the total dollars at risk the same as with a trade on the 5 minute chart, the position size has to be smaller.
FIGURE 15.3 Gap Up, Then Pullback
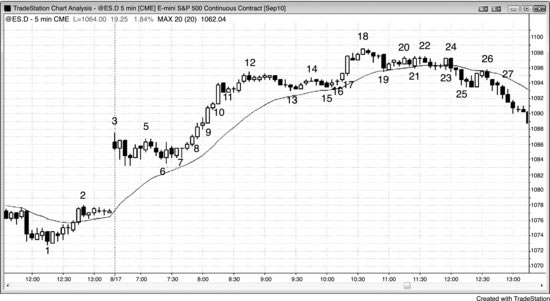
As shown in Figure 15.3, the market had a large gap up, but a strong bear reversal bar followed, so the day might have become a trend from the open bear day. This is a reliable always-in short setup. However, traders know that large bull trend days can develop whenever there is a large gap up and that the market often trades sideways to down for an hour before there is a bull breakout. Because of this, even though they shorted, they were willing to reverse to long. Bar 4 was a bear trend bar, but it had a large tail and no follow-through over the next couple of bars. Also, the second bar of the day was a strong bull bar instead of a strong bear bar, which traders would have wanted to see for their entry bar. This was not behaving like a strong bear trend. Many would have exited above the inside bar after bar 4 and waited for a second signal, but technically the market was still always-in short because there had not been a clear buy signal. There was a small two-legged move up to bar 5, and the market might have been trying to form a double top with either the first or the second bar of the day. It did not matter which you chose to consider as the first top, because the implication was the same. Some traders thought of the first top as the first bar and others attached more significance to the second bar. The bar after bar 5 was a bear inside bar and a second sell signal, but the market again failed to create a strong bear trend bar over the next couple of bars. Again, the bears would have seen this as a problem. At this point, the market had been in a tiny range for over 30 minutes, and when that happens, especially when there is a large gap opening, the market is in breakout mode. Traders would have placed buy stops at one tick above the high of the range and would go short on a stop at one tick below the low of the range. This was a reliable breakout mode situation.
Bar 7 was a bull ii pattern after the bar 5 double top and after the bars 4 and 6 double bottom. An ii pattern is a pause, which is a type of pullback, so this was an even smaller breakout mode setup since the market was setting up both a double top pullback and a double bottom pullback entry. Although some traders would have entered on the breakout of the ii pattern, most would have waited for the breakout of the opening range.
The bar before bar 8 was a strong bull trend bar that closed above the bar 5 high, and many traders went long above that swing high. Bar 8 was an even larger bull trend bar and a breakout of the opening range. At this point, traders saw the bull breakout of a breakout mode setup on a strong gap up day and believed that the market was now in a bull trend. Since they didn't know if there would be a pullback anytime soon and they were confident that the market would likely be higher before long, they were buying at the market, which was exactly what the institutions were doing and therefore the correct thing to do. The odds were good that the range would be at least equal to the recent average daily range, and that increase in range would very likely be due to higher prices. Beginners are often frightened by the rapidity of a breakout and the size of the stop required, but they should learn to enter at least a small position at the market and hold until there is a strong sell setup, like the bar 18 final flag reversal. If they bought around the close of bar 8, their theoretical protective stop was below bar 7, the most recent higher low. If this is three times larger than they are comfortable using, they should buy just one third size. Alternatively, they could risk to just below the bar 8 low, since a strong breakout should have immediate follow-through. They would have a higher chance of being stopped out, but if the market hit their stop and turned back up, they could buy again for the swing.
Bars 9 and 10 were also large bull trend bars, but as such they were buy climaxes, and consecutive buy climaxes are usually soon followed by a larger sideways to down correction. The bars became small and the market entered a tight trading range for the next couple of hours, but it never pulled back to the moving average. It tried to on the pullbacks to bars 13 and 15, but the bulls were so aggressive that they had buy limit orders several ticks above the moving average. They were so afraid that the market might not touch the moving average that they placed their buy orders above it. This is a sign of a very strong bull market. However, whenever there is a long sideways correction in a strong bull trend, it will break the bull trend line and it might become a final flag, as it did here. This made the bulls ready to quickly take profits. Bars 11, 13, and 15 were three pushes down in a tight trading range and can be viewed as a triangle or a wedge bull flag.
Consecutive bear trend bars breaking below a trading range will not necessarily convince traders that the always-in direction has flipped to short. The two bear trend bars that broke below the tight trading range that followed bar 12 were small, and there was no prior bear strength. Traders did not short and instead were looking to buy a 20 gap bar pullback to the moving average. The three bear trend bars that broke below the bar 14 lower high did not create an impressive bear spike, and the bulls were still looking to buy the first pullback to the moving average. There was no significant selling pressure leading up to this and no significant bear strength. Traders believed that the always-in direction was still long, and they bought the two-legged sideways correction to bar 15.
Bar 17 was another strong bull breakout and therefore also a spike and a climax, but since it might have been a breakout of a final flag, it could have failed and been followed by a trend reversal. Bulls and bears look for large bull trend bars in a trend that has gone on for 20 or more bars, especially if the move up is out of a potential final flag, as it was here. Traders saw the large trend bar as climactic, and suspected that a correction might soon begin. Because of this, traders began to sell. The bulls sold out of their longs to take profits, and the bears sold to initiate new shorts. They sold on the close of the bar, above its high, on any small bar that followed (especially if it had a bear close), and below the low of the prior bar. Both the bulls and the bears expected at least a two-legged correction that would last at least 10 bars and possibly test the bottom of the bar 15 bottom of the potential final flag. If the move down was very strong, both would have waited to buy. If it was a simple two-legged correction and the market looked poised to rally, both would have bought. The bulls would have reinstated their longs, and the bears would have bought back their profitable shorts. Here, the series of bear bars down from bar 14 were likely to be followed by lower prices, and therefore there was no significant buying into the close.
Bar 18 was the third push up on the day (bars 3 and 12 were the first two pushes) and a possible final flag reversal, both from the large trading range between bar 11 and bar 16, which was a triangle, and from the two small bars that followed the bar 17 buy climax. It was also the third push up, where bars 14 and 17 were the first two pushes. The market often pulls back around 10:30 to 11:00 a.m. PST, with the pullback ending around 11:30 a.m. Also, the market had not touched the moving average all day, although it came close at bar 15. The next pullback was likely to be deeper, since subsequent pullbacks often are, especially after 11:00 a.m. PST or so, and a deeper pullback would have been so close to the moving average that it would almost certainly have to penetrate it, at least by a little. This combination of factors made experienced traders wonder if the strong bull trend was transitioning into a trading range. There was also a chance that the pullback could become a large, deep pullback, or even a bear trend, since the triangle to bar 15 broke the steep trend line from the bull trend between bars 6 and 12, and bar 18 was a possible higher high trend reversal. Many took their final profits below the two-bar reversal at the bar 18 high, and looked for at least a two-legged, 10 bar correction that touched the moving average before considering getting long again into the close of the day.
Bar 19 was a strong bear spike, which alerted traders to a possible bear channel after a pullback. Some traders would have reversed to short on the final flag top, but since the market had not yet touched the moving average all day, there would have been 20 gap bar longs coming in at the moving average. Because of this, the always-in position was probably still long. Bulls assumed that there would likely not be a bear bar for the next bar, so they bought at the close of the bar. Most attempts to flip the always-in position fail, especially in a strong trend.
Bar 23 was a double bottom long entry at the moving average, but became the first bar of a two-bar reversal down. The always-in position flipped to short for most traders once the market traded below the bar 24 low. This was a bull trap and a small final flag top (the breakout from a final flag can be a lower high). The bar after bar 25 was a first moving average gap bar long setup, but the trend was now down. There was a strong bull trend bar, but instead of a failed breakout below the top trading range, it failed to have follow-through and was followed by a breakout pullback short entry at the moving average either on bar 26 as it went outside down or below its low (shorting below a bear bar that is a moving average test below the moving average is a reliable trade).
By bar 27, the market was clearly always-in short, and traders were shorting at the market for the trend into the close. Risk managers were walking the floors and telling their traders that they had to dump their longs. The traders hated that because they were clinging to the hope that the bull trend would resume and bail them out, but their boss would not allow them to wait. They and the risk managers get paid for performance, and the traders can be emotionally attached to their losing longs, but the risk manager's job is to be unemotional and to accept losses when doing so makes sense. The boss always wins, and the result was a bear trend into the close. The trend is enhanced by momentum sell programs that detect the strong trend and sell into it, as long as the momentum down continues.
In the rally from bar 6 to bar 12, the biggest pullback was only about a couple of points. Experienced traders might have placed limit orders to scale in on any one- or two-point pullback and add on at one to two points lower, and might have risked two to three points below their final entry. If the market flipped to always-in short, they would have exited their longs and looked to go short. If they bought one contract on a one-point pullback and added one more one point lower, they would have been long two contracts at bar 13. They could have placed their protective stops two to three points lower or maybe a couple of points below the moving average. Since this was a bull trend, they expected at least a test of the high, and they could have taken a one-point profit on their first contract as the market went to a new high and then either placed a limit order to exit the other contract at about four points (about twice their initial risk on that entry) or exited once the market stalled around bar 18 where the market might have been setting up a final flag reversal from the bar 12 to bar 16 potential final flag.
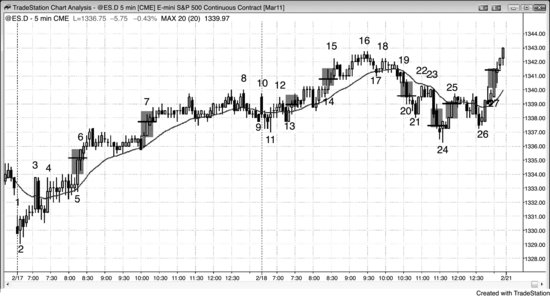
FIGURE 15.4 Look for Early Swing Setups
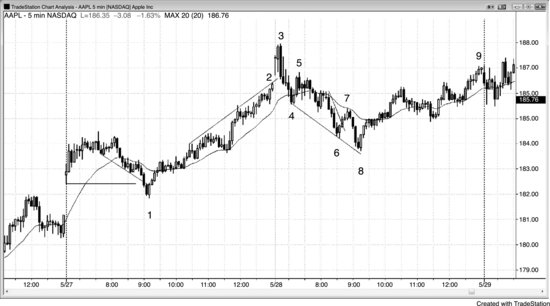
Traders should look for always-in trades early in the day because they often result in profitable swing trades. Also, sometimes just a single strong trend bar is all that is required to make most traders believe that the market has established an always-in direction. In Figure 15.4, the bar 3 strong bear outside down bar that reversed down from the breakout above the bull channel probably made most traders believe that there would be follow-through and that the always-in position was now short. This large bear bar following the strong bull trend bar was a reasonable candidate for a high of the day and a trend from the open bear setup.
AAPL had a gap test at bar 1, which was a strong reversal bar that reversed up after hitting a new low on the day and after breaking below a bear trend channel line. This was a great entry for a swing long that would have netted almost $4.00 by the close. The gap up was the spike and bar 1 was the pullback that led to the channel that topped out at bar 3. Some traders assumed that the always-in position had flipped to long above bar 1, and others came to that conclusion during either of the two bull trend bars that followed. The five-bar bull spike erased the five-bar bear spike that led to the bar 1 low. This was a climactic reversal, and the odds favored at least a second leg up.
The four-bar bull spike to bar 7 was strong, but the four-bar bear spike down to bar 6 had been stronger. Most traders still believed that the always-in position was still short and they wanted to see a higher low or lower low pullback before looking for longs.
Bar 8 was a reversal up in a wedge bull flag and a higher high above bar 1. If you simply exited your short instead of reversing to long, the trade would have netted about $2.40. Many traders believed that the always-in position reversed to up when the market went above bar 8, and more became convinced in the bull trend bar that followed. The prior bull strength on the move up to bar 7 was a sign of buying pressure, and it gave the bulls confidence that the buying might even be stronger on this second attempt to reverse the market up.
When the market needs one more bar to flip the always-in direction, traders often fade the move, expecting that bar to not materialize. For example, if bar 5 was a strong bull trend bar, many traders would have changed their always-in short position to long (most saw the market always-in short after the five bars down from bar 3). Because they know that most attempts to flip the direction fail, they would have shorted the close of the bull trend bar before bar 5, expecting bar 5 to not be a strong bull bar and for the bear swing to resume.
FIGURE 15.5 Follow-Through Is Often Likely
Whenever traders are confident of the direction over the next several bars, there is an opportunity for a trade. Each gray rectangle in Figure 15.5 is an area where traders believed that there would have been follow-through. The small horizontal line within each box was at the price where most traders shared that belief, although many traders were confident earlier. When a trend is strong, as it was in the sell-off from bar 14, there usually are several consecutive breakouts where traders develop renewed confidence.
Although some traders are strict always-in traders and stay in the market, long or short, for the entire day, most take profits along the way and exit whenever they believe that the market has lost its direction. Traders will generally exit a trade on a signal in the opposite direction, even if that signal is not strong enough for them to reverse direction. Remember, it takes less to convince traders that it is time to exit a long than it does for them to take a short. The bulls who bought at the close of bar 1 or one tick above its high were concerned by the large bar 3 bear reversal bar, especially since opening reversals can have protracted follow-through. Bar 3 alone was not likely to be enough for most traders to see the market as always-in short, but many would have exited their longs or reversed to short below the bar 4 small wedge bear flag lower high. Others would have exited their longs or reversed to short below the bar 5 second-entry breakout pullback from that bear flag. Most traders would have seen the market as always-in short by the close of the bear bar that broke below bar 5, one tick below its low, or the close of bar 6.
The strong reversal up from a new low of the day at bar 7 was a concern for the bears because it was another opening reversal and a possible low of the day. There was a two-bar spike down from bar 3, and bar 7 was the third push down in a possible spike and wedge channel, where the bar after bar 3 was the first push down and bar 6 was the second. Some bears would have exited above bar 7, and most would have gotten out above the bar 8 higher low. Bar 7 was a breakout above the micro channel from bar 5, and bar 8 was the breakout pullback buy signal. Many traders saw the market as flipping to always-in long above bar 8, and most were convinced when the market reversed above the bull ii pattern at bar 10, which was also a failed low 2 short. They believed that the bear flag failed and that the market would go up for at least a measured move based on the height of the bar 7 to bar 9 bear flag.
In the free fall from bar 14, there were several other areas where traders developed renewed confidence that the market was going to fall more over the following bars, like on the close of bar 18, one tick below the inside bar that followed it, and one tick below the bar 18 low. Even though the inside bar after bar 18 had a bull body, traders still felt that the trend was down and that the bar was likely a low 1 short setup. This was also the case at bars 21 and 24. The trader's equation is excellent for shorting, even if the probability only feels like it is 50 percent. It is actually at least 60 percent, but traders often are frightened and are in denial, and conclude that the probability of an equidistant move is only 50 percent. This gives them a plausible, but incorrect, reason to not take the trade. They should short an “I don't care” size position at the market and use whatever size protective stop is appropriate, like above the high of the most recent big bear trend bar, and then hold through pullbacks until there is a clear buy setup, like the bar 25 lower low major trend reversal. If the risk is four times bigger than normal, trade no more than one quarter normal size. If they are still afraid, trade just 10 percent normal size. It is important to get short when the institutions are shorting so aggressively, because run-away trends have the strongest trader's equations.
FIGURE 15.6 Always-In Setups
As shown in Figure 15.6, there were several areas where traders were confident of the direction over at least the next several bars, and each was a reasonable entry for an always-in trade. Aggressive traders would have entered earlier and taken more reversal trades, but the highlighted areas were where the majority of traders were confident of the always-in direction.
The traders who bought on the close of bar 14 or above the doji high 1 that followed it would have been concerned about the second-entry short at the bar 16 higher high. This was also a potential top of the channel that followed the bar 14 spike, and the entire move from bar 11 to bar 16 might have been a higher high after the potential bar 7 to bar 12 final flag. Most bulls would have exited below bar 16, and aggressive traders would have shorted, thinking that this was a reasonable always-in flip. More conservative traders who look for only three to five reversals a day would have waited for the strong bear close on bar 19 or bar 20 before seeing the market as always-in short.
When traders are confident, they should assume that they are at least 60 percent certain. If their risk is about two points, then they need a profit target that is at least two points to have a favorable trader's equation. This means that they could have looked for entries around each of these areas and, after entering, placed a bracket order for their exit. Their stop could be two points away from their entry price, and their profit-taking limit order could also be two points away. If the market approaches their profit target but then reverses, as it did on the rally after the bar 7 close, they could tighten their stop. In this case, they would have exited below the two-bar reversal at around breakeven. Some traders won't adjust their stop and will hold until their premise is clearly no longer valid, allowing pullbacks along the way. Other traders will try for three- or four-point profit targets when they think that the signal is strong enough, like buying the close of either bar 5 or bar 6, buying above the bar 13 breakout pullback (from the bars 9 and 11 high 2 bull flag), shorting below the bar 16 small wedge top, shorting the close of bar 20, shorting below the bars 22 and 23 small low 2 breakout pullback, or buying above the bar 26 breakout pullback. Some traders would see those as the strongest setups, and therefore maybe 70 percent certain of reaching a two-point profit target before hitting a two-point scalp. They would then just go for the two points, knowing that the math was very strong.
Since most traders saw the market as always-in long by bar 6, they expected that attempts to reverse it to short would fail. They then looked to buy the closes of strong bear trend bars, like the one that formed four bars after bar 6 and the one that tested the moving average two bars before bar 7.