CHAPTER 21
Detailed Day Trading Examples
This chapter provides many detailed examples of reasonable day trades that incorporate the fundamental ideas from all three books.
FIGURE 21.1 T-Note 10,000-Share Chart
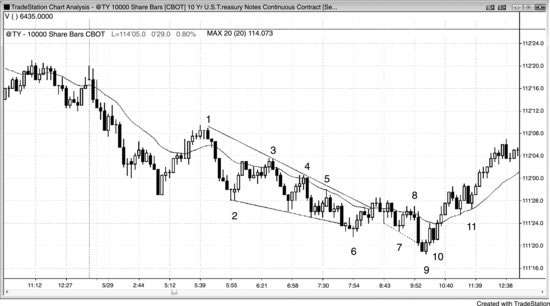
Figure 21.1 is a 10-Year U.S. Treasury Note Futures chart based on 10,000 shares per bar. Each bar closed as soon as the volume in the bar passed 10,000 contracts. Since the final trade in each bar can have any number of contracts, most of the bars have more than 10,000 contracts instead of exactly 10,000 contracts. The bars are not based on time, so some bars might take a few seconds to form, while others may take more than 10 minutes to surpass 10,000 contracts.
Bars 3, 4, and 5 were shorts on tests of the moving average in a bear trend.
Bar 6 was a second-entry bear trend channel line overshoot and reversal up, but the signal bar was weak (a small doji). However, the rally from the bar 6 wedge reversal broke the trend line, setting up a long on a test of the low.
Bar 7 was a two-legged higher low, but it was a doji, which is a sign of two-sided trading and not of strong buying, and it followed two strong bear trend bars. Although this was a minimally acceptable buy setup, it would have been better to wait for a stronger signal. If you took it, you would have exited below bar 8 because that was a low 2 short setup at the moving average and it had a bear body. That is a strong sell signal, and countertrend traders should have exited and possibly even reversed on any second attempt by the bears to resume the trend. Countertrend traders trying to buy in a bear trend should always exit on a low 2 signal, unless the trend has clearly already reversed and the low 2 setup is likely to fail. Bar 11 is an example of this.
Bar 9 was a lower low major trend reversal and breakout pullback from the breakout of the wedge bottom that ended at bar 6, and a buy setup for a possible strong trend reversal. It was also a bear trend channel overshoot and reversal, and it was a bull reversal bar and a two-bar reversal. The trading range from bar 6 to bar 9 was a tight channel and became the final flag of the bear trend. Also, it was a reversal from a larger wedge channel following the spike down to bar 2. The channel of a spike and channel bear often ends with three pushes and it did here (bars 2, 6, and 9).
Bar 10 was a breakout above an inside bar that ended the first tiny pullback (bear trend bar), so traders could have gone long above it or added to their longs from above bar 9. After the spike and channel bear (bar 2 ended the spike) and the three pushes down (bars 2, 6, and 9 ended them), it was likely that a protracted two-legged up move would develop, so the bar 10 pause was likely to just be part of the first leg up and not the start of the second leg up. After a bear channel that lasted 20 or 30 bars, the correction was likely to have at least half as many bars as a general rule. If the correction is too small, bears will be hesitant to short and bulls would continue to buy because they would suspect that the correction needed more bars for clarity. Both needed to see if the market was reversing, and the four-bar bull spike up from bar 10 was strong evidence that it was. The bear spike and channel formation was likely to retrace to around the bar 3 start of the channel, which it did. Longs often take profits there. This is the area where some started to scale in, and once the market gets back to their very first entry, they often exit their entire position. They got out of their original longs that they established between bars 2 and 3 at about breakeven, and they made a profit on all of their lower entries. Bears often short aggressively again because they know that the market started down from this area earlier in the day, and it could do the same again. The day was over and there was not enough time left for the bears to make a profit, so they therefore chose to not short into the close.
Bar 11 was a high 2 buy setup (the high 1 was two bars earlier) after a strong bull spike. Traders were expecting at least two legs up, and this two-legged pullback was so small compared to the size of the spike that it might not have signified the end of the first leg up. Traders believed that one of three things was happening: the pullback was so small that it was just part of a complex first leg; the first leg was over and the second leg up was beginning; or the first leg was over and there would be a deeper pullback and then a move above the top of this leg. All three possibilities meant that the market was going higher and this was therefore a great buying opportunity. Yes, bar 11 was an entry bar from a two-bar reversal top, which was the second entry for a moving average gap bar short in a bear trend. This might have led to a test of the bear low. However, the spike up flipped the market to always-in long in the minds of most traders, so the chance of the short going very far was small. Most traders saw the reversal as much stronger than the short setup.
FIGURE 21.2 Strong Open in the EUR/USD
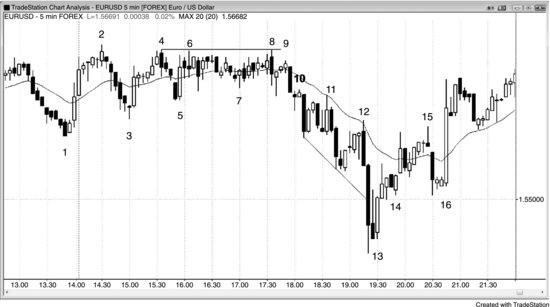
As shown in Figure 21.2, the 5 minute EUR/USD (forex) reversed down at bar 2 after a new high. This bull leg had strong momentum, as evidenced by eight bars in a row without a bear trend bar, so the odds were high that any pullback would test the bar 2 high before it fell below the bar 1 bottom of the bull spike. Bar 3 was a moving average gap bar that also was a breakout test of the bar 1 beginning of the rally. It and the two bars before it formed a micro wedge, which should have led to at least a bounce up. It was also a wedge bull flag after the strong bull spike. The first leg down was three bars before bar 2, the second push down was two bars after bar 2, and the third was bar 3.
The market formed a triangle, which ended up as a tight trading range. Triangles have at least three pushes in one direction, and bars 2, 4, and either 6 or 8 formed three pushes up, while bar 1 or 3 along with bars 5 and 7 formed three pushes down. When there are multiple possibilities, some traders will place more importance on one whereas other traders will feel more strongly about others. Whenever there is confusion, the market is in a trading range and therefore in breakout mode, and most traders should wait for the breakout instead of trading within a tight trading range.
Bar 8 was a failed upside breakout attempt (one tick below the bar 4 high) that reversed through the bottom of the range in a bear outside bar. It formed a double top bear flag with bar 4 or bar 6.
Bar 9 was a breakout pullback small bar above the middle of the outside bar, offering a low-risk short.
Bar 10 was another breakout pullback short.
Bar 11 was a low 2 short at the moving average with a bear signal bar and a second attempt to break out below the bar 3 spike low.
Bar 12 was another low 2 short at the moving average. Always keep placing your orders. A bear might become complacent because of the bull doji higher low, but you still need to be thinking that the market is in a bear swing, and if it falls below this bar, it will form a low 2 short.
Bar 13 was an ii setup for a long after a trend channel line overshoot and sell climax bar. This was a parabolic wedge bottom, which means that the move accelerated down to the final low and then reversed up. There were three pushes down from bar 10, and the slope of the trend line from the first two pushes (the swing lows after bars 10 and 11) was flatter than that of the trend line created by the second and third pushes (the swing low after bar 11 and the final low just before bar 13).
The market had been trending down for about 20 bars and suddenly had the largest bear trend bar (two bars before bar 13) and largest two-bar bear spike of the bear trend. This spike had a good chance of representing exhaustion, and it might have been the last weak bulls exiting and the last weak bears shorting. The strong bulls were buying in here and would scale in lower instead of panicking out, and the strong bears would have shorted only after a big pullback. This created a good chance of at least a two-legged rally lasting at least 10 bars. The strong bull inside bar was a sign that the buyers were taking control, and it was a good signal bar.
Bar 15 was three pushes up and the first moving average gap bar. The two-bar bull spike from bar 13 was the spike up. Spike and wedge patterns usually have two more pushes up before a correction down, as this one did.
Bar 16 was an ii setup for a higher low long, since traders were expecting at least two legs up from the trend channel overshoot and reversal off the bar 13 low entry. It formed a double bottom bull flag with the bar 14 bottom of the wedge channel up to bar 15. The large bear trend bar trapped bears into shorts and trapped weak bulls out of longs.
FIGURE 21.3 Soybeans Buy Climax on the Open
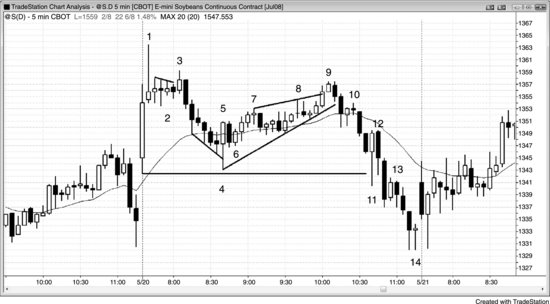
As shown in Figure 21.3, the 5 minute chart of soybeans had a buy climax on the open and then a small final flag, and later a wedge bear flag and a large second leg down.
Bar 2 was a doji trading range after the bar 1 spike up and therefore a bad buy setup. There was too much risk of more sideways to down price action. Aggressive traders placed limit orders to short at the high of the prior bar and were filled on bar 3, expecting the high 1 to fail. Bar 3 was a low 2 short, a lower high, and a final flag short. Traders were looking for more of a correction after the bar 1 buy climax and a possible opening reversal and high of the day.
Bar 4 overshot a bear trend channel line and reversed up from a double bottom with the first bar of the day. This could have been the low of the day. The entry was above the bar 6 ii bar, which had a bull close and a close above the moving average.
Bar 9 was a lower high wedge bear flag and a double top bear flag with bar 3. It was a four-legged move up from the bar 4 low, making it a low 4 variation. The market could have been forming a large two-legged move down from bar 1, and traders would have shorted below bar 9 or below the bear bar after it. You can see how the bar after that was a large bear trend bar, indicating that many traders shorted below the bear bar after bar 9.
Bar 10 was a breakout pullback from the trend line breakout.
Bar 11 was a huge bull reversal bar following a new low on the day and was a two-bar reversal. However, bar 12 could not trade above it. This made bar 12 a great short signal bar because the trapped longs who entered early in bar 11 would have exited below the bar 12 bear trend bar. It was also a breakout pullback short setup. Bar 13 was a breakout pullback short entry.
FIGURE 21.4 Crude Oil Wedge Top
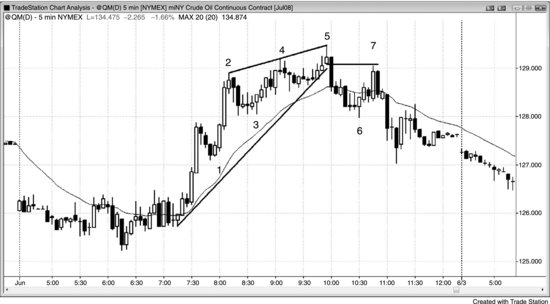
As shown in Figure 21.4, the 5 minute chart of crude oil had a wedge top and then a lower high. Bar 1 was a high 1 breakout pullback from the breakout of the earlier trading range. It was a two-bar reversal and the first pullback after a strong two-bar bull spike, which broke out of a trading range and turned the market into always-in long.
Bar 3 was a good high 2 long above the bull trend bar, despite the barbwire and the second buy climax, because the top at bar 2 was not strong enough to indicate that the bears were in control.
Bar 5 was a wedge top and the top of the channel that followed the bar 2 bull spike. The two-sided trading since bar 2 continued with prominent tails, overlapping bars, pullbacks, and bear bodies, so the odds of a test of the bar 3 channel low were good.
The move down to bar 6 broke the trend line and broke slightly below the bar 3 higher low of the bull trend, indicating strong bears.
Bar 7 was a two-legged breakout test of the bar 5 signal bar low, a lower high after a break below the bull trend line and therefore a possible major trend reversal, a two-bar reversal short setup, a sharp rejection of the poke above the moving average, and a wedge bear flag. The first push up in the wedge bear flag lower high was the small bull bar that formed four bars before bar 6, and the second push up was the bar after bar 6.
FIGURE 21.5 Scalps on a 1 Minute Chart
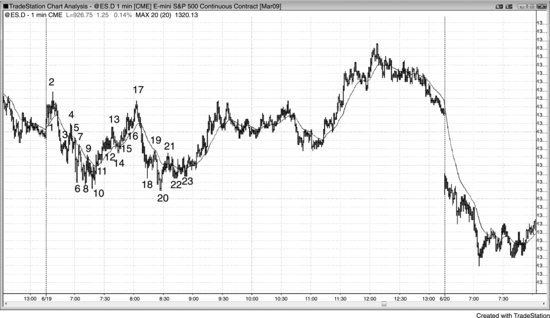
Figure 21.5 is a 1 minute chart showing many price action scalps in the first 90 minutes. The next chart is a close-up of this area. It is virtually impossible for most traders to read a chart correctly fast enough to catch most of these trades, but the chart illustrates that price action analysis works even on the 1 minute level.
FIGURE 21.6 Scalps on the Open on a 1 Minute Chart
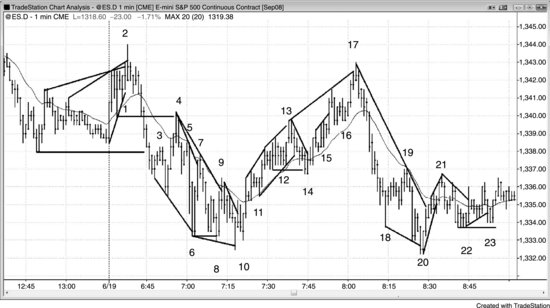
Figure 21.6 is a close-up of the 1 minute Emini's first 90 minutes, highlighting price action scalp setups. The numbering is the same as on the prior chart.
Bar 1 was a high 2 long (there were two pushes down).
Bar 2 was a wedge short and a final flag.
Bar 3 was a breakout pullback short and a low 1 after a bear spike.
Bar 4 was a breakout test short, a lower high, and a low 2 where bar 3 was the low 1.
Bar 5 was a lower high and a low 2 short below the moving average.
Bar 6 was a wedge long, a two-bar reversal, and an expanding triangle bottom.
Bar 7 was a failed trend line breakout short and a double top bear flag with bar 5.
Bar 8 was a two-legged lower low after the bar 7 break of a trend line, and a lower low on a trading range day.
Bar 10 was a wedge reversal second entry and a higher low. The higher low might have meant that a bull trend was forming.
Bar 11 was the first pullback after a trend line break. It was a high 2 long where the high 1 was three bars earlier.
Bar 12 was another bull high 2.
Bar 13 was a wedge short, a final flag, and a possible double top bear flag (with bar 4).
Bar 14 was a failed bull trend line break, a failed break below the trading range, a double bottom bull flag, and a possible start of a second leg up.
Bar 15 was a high 2. There was a bull flag breakout pullback entry two bars earlier.
Bar 16 was a high 2 in a bull trend.
Bar 17 was a wedge and a failed test of the high of the day (a double top), and therefore a possible lower high.
Bar 19 was a bear low 2 at the moving average, a wedge bear flag, a five-tick failure for traders who bought bar 18, and the first pullback after a bear spike that flipped the market to always-in short.
Bar 20 was two pushes to a new low of the day (bar 18 was the first) in a trading range day (even though there was a strong bear leg from the bar 17 high, it was not a bear day at this point). It was also a reversal up after a one-tick new low of the day (a one-tick failed breakout and a double bottom). It was also a wedge and a two-bar reversal up after a breakout of a two-bar final flag.
Bar 21 was a second leg up, a wedge bear flag (the ii pattern before bar 20 was the first push up), and a possible double top bear flag (with bar 19).
Bar 22 was a two-legged pullback to a higher low after a trend line break (bars 17 to 19) and a double bottom (bars 10 and 20) pullback long.
Bar 23 was a failed trend line break and a double bottom (bar 23 was one tick higher than bar 22) bull flag.